デモ
| Before(小数表示) | After(整数表示) |
|---|---|
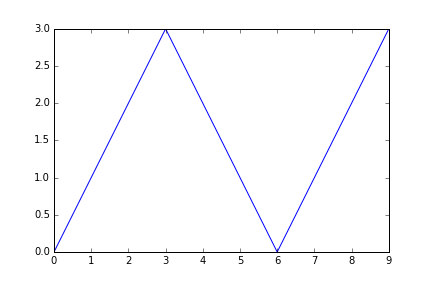 |
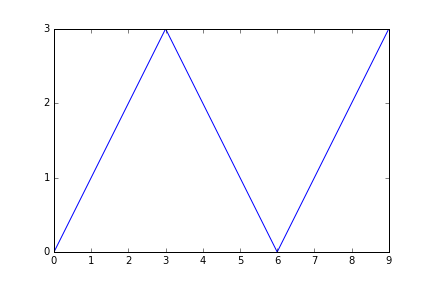 |
方法
Locatorを1に変更する。
from matplotlib.ticker import *
ax = plt.gca()
ax.yaxis.set_major_locator(MultipleLocator(1))	# x軸の場合は yaxis -> xaxis
参考
matplotlib - memoring
http://seesaawiki.jp/met-python/d/matplotlib#content_9_31_4