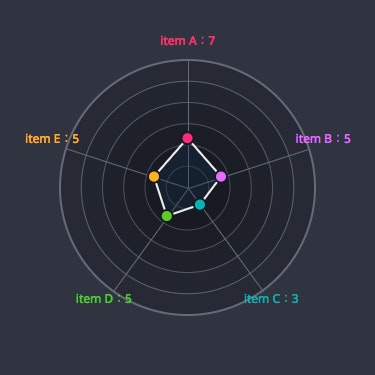
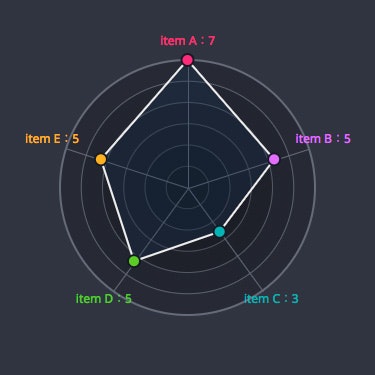
svg chart 2日目は Radar Chart です。項目数や値上限に制約を設けないように実装していきます。マウント時に矩形が拡大するアニメーション付きです。
code: github / $ yarn 1216
 |
 |
|---|
Record
Record 配列は以下の通りで、配列要素数は不問で多角形を描きます。score は正の整数である必要がありますが、上限を設けません。
components/records.ts
type Record = {
  color: string
  score: number
  title: string
}
ダミーデータを利用します。
components/records.ts
const defaultRecords: Record[] = [
  { color: '#ff0079', score: 7, title: 'item A' },
  { color: '#e36dff', score: 5, title: 'item B' },
  { color: '#00b5b5', score: 3, title: 'item C' },
  { color: '#5bcc18', score: 5, title: 'item D' },
  { color: '#ffb100', score: 5, title: 'item E' }
]
点座標算出関数
中央座標だけでなく、Records を突合した多角点座標の算出が必要です。Custom Hooks ではない純関数でこれを処理します。
components/chartSrc.ts
const getChartSrc = (
  records: Record[],
  max: number,
  size: number,
  center: number,
  progress: number,
  itemLabelIeject: number
) => {
  // 背景の中央からの放線を描く配列
  const linesPoints: LinePoint[] = records.map(
    (record, index, src) => {
      const angle = (Math.PI * 2 * index) / src.length
      const dis = size * 0.5
      const x = center + Math.cos(angle - Math.PI / 2) * dis
      const y = center + Math.sin(angle - Math.PI / 2) * dis
      return { x, y, title: record.title }
    }
  )
  // 多角形を描く点座標配列
  const radarPoints: RadarPoint[] = records.map(
    (record, index, src) => {
      const angle = (Math.PI * 2 * index) / src.length
      const dis =
        size * 0.5 * (record.score / max) * progress
      const x = center + Math.cos(angle - Math.PI / 2) * dis
      const y = center + Math.sin(angle - Math.PI / 2) * dis
      return { x, y, color: record.color }
    }
  )
  const itemsPoints: ItemPoint[] = records.map(
    (record, index, src) => {
      const angle = (Math.PI * 2 * index) / src.length
      const dis = size * 0.5 + itemLabelIeject
      const x = center + Math.cos(angle - Math.PI / 2) * dis
      const y = center + Math.sin(angle - Math.PI / 2) * dis
      return {
        x,
        y,
        title: record.title,
        color: record.color,
        score: record.score
      }
    }
  )
  return { linesPoints, radarPoints, itemsPoints }
}
useRadarChart
先に用意した純関数を、useMemo で利用します。アニメーションに進捗時、画面リサイズ時に、点座標を再計算します。
components/useRadarChart.ts
const useRadarChart = (props: Props) => {
  const [resource] = useState<State>(getRecords())
  const options = useMemo(
    (): Options =>
      merge(defaultOptions(), {
        padding: props.padding,
        itemLabelIeject: props.itemLabelIeject
      }),
    [props.padding, props.itemLabelIeject]
  )
  const { progress } = useProgress()
  const { size } = useWindowResize(() => {
    if (props.ref.current === null) return 0
    const {
      width
    } = props.ref.current.getBoundingClientRect()
    return width - options.padding * 2
  })
  const rectSize = useMemo(
    () => size + options.padding * 2,
    [size, options.padding]
  )
  const center = useMemo(() => rectSize * 0.5, [rectSize])
  const stepCount = useMemo(() => resource.max, [resource])
  const radius = useMemo(() => size * 0.5, [size])
  const { radarPoints, linesPoints, itemsPoints } = useMemo(
    () =>
      getChartSrc(
        resource.records,
        resource.max,
        size,
        center,
        progress,
        options.itemLabelIeject
      ),
    [resource, size, center, progress]
  )
  return {
    size,
    rectSize,
    center,
    radius,
    stepCount,
    radarPoints,
    linesPoints,
    itemsPoints
  }
}
Context Hooks
先に定義した Custom Hooks をもって Provider を作ります。
components/context.ts
import { createContext } from 'react'
import { useRadarChart } from './useRadarChart'

export const RadarChartContext = createContext(
  {} as ReturnType<typeof useRadarChart>
)
components/provider.tsx
export default (props: Props) => {
  const ref = useRef(null! as HTMLDivElement)
  const value = useRadarChart({
    ref,
    padding: props.padding,
    itemLabelIeject: props.itemLabelIeject
  })
  return (
    <RadarChartContext.Provider value={value}>
      <div ref={ref}>{props.children}</div>
    </RadarChartContext.Provider>
  )
}
SVG要素への分配
Chart コンポーネントが svg タグを含む wrapper です。Provider より下層は Chart に関する座標や色を useContext で取得、表示要素を作りこむことが出来ます。svg element の置き換えが自由で、DOM を svg の外側に置くことも可能です。
components/index.tsx
const View = (props: Props) => (
  <Provider>
    <div className={props.className}>
      <Chart>
        <BgCircles />
        <BgLines />
        <RadarPolygon />
        <RadarCircles />
        <ItemTexts />
      </Chart>
    </div>
  </Provider>
)
多角形頂点の小さい円は、点座標配列のみを利用します。
components/chart/radarCircles.tsx
export default () => {
  const { radarPoints } = useContext(RadarChartContext)
  return useMemo(
    () => <View points={radarPoints} radius={6} />,
    [radarPoints]
  )
}
多角形を描くコンポーネントも、点座標配列のみを利用します。
components/chart/radarPolygon.tsx
export default () => {
  const { radarPoints } = useContext(RadarChartContext)
  return useMemo(() => <View points={radarPoints} />, [
    radarPoints
  ])
}