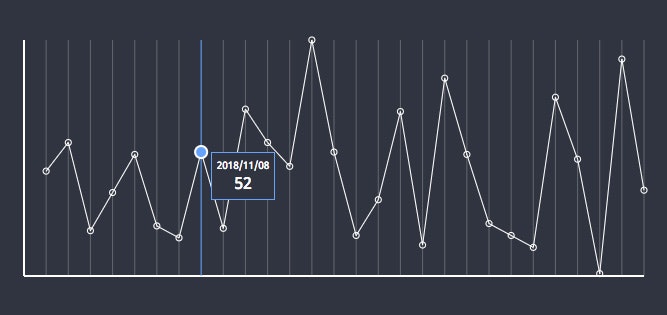
svg chart 3日目は Line Chart です。レコード数や上限値に制約を設けない様に実装します。Chart にマウスオーバーすると、該当レコード内訳のツールチップが点座標に表示されます。
code: github / $ yarn 1217
 |
|---|
Record
まずは Record 定義です。サンプルでは mock 生成関数を利用しています。
components/records.ts
type Record = {
  dateLabel: string
  amount: number
}
点座標算出関数
Records と描画領域を突合し、点座標を算出します。daily record を表す chart なので、日付け毎の点座標・情報を確保。列幅は統一なので、別で確保します。
components/chartSrc.ts
const getChartSrc = (records: Record[], bound: Bound) => {
  const count = records.length
  const max = Math.max.apply(
    Math,
    records.map(record => record.amount)
  )
  const startY = bound.height + bound.y
  const paths: string[] = []
  const chartPoints = records.map((record, index) => {
    const i = index + 1
    const x = (bound.width / count) * i + bound.x
    const y = startY - (bound.height * record.amount) / max
    paths.push(`${x},${y}`)
    return {
      x,
      y,
      amount: record.amount,
      dateLabel: record.dateLabel,
      current: false
    }
  })
  return {
    chartPoints,
    chartPath: paths.join(' '),
    chartColumnWidth: bound.width / count
  }
}
useLineChart
今回の Custom Hooks です。先に用意した純関数を、useState で利用します。
components/useLineChart.ts
const useLineChart = (props: Props) => {
  const padding = useMemo(...)
  const svgRect = useMemo(...)
  const chartBound = useMemo(...)
  const [{ chartPoints, chartPath, chartColumnWidth }, updateChart] = useState(getChartSrc(props.records, chartBound)) // here
  const [currentPoint, updateCurrentPoint] = useState<null | Point>(null)
  const handleEnterHitarea = useCallback(...)
  const handleLeaveHitarea = useCallback(...)
  return {
    records: props.records,
    svgRect,
    chartPoints,
    chartPath,
    chartBound,
    chartColumnWidth,
    currentPoint,
    handleEnterHitarea,
    handleLeaveHitarea
  }
}
Context Hooks
先に定義した Custom Hooks をもって Provider を作ります。
import { createContext } from 'react'
import { useLineChart } from './useLineChart'

export const LineChartContext = createContext(
  {} as ReturnType<typeof useLineChart>
)
export default (props: Props) => {
  const value = useLineChart({
    records: props.records,
    width: props.width,
    height: props.height
  })
  return (
    <LineChartContext.Provider value={value}>
      {props.children}
    </LineChartContext.Provider>
  )
}
要素への分配
Chart コンポーネントが svg タグを含む wrapper です。RecordsHitArea は透明な矩形を横一列に配置しています。これがマウスイベントを listen するので、マウスを横に移動させると、ツールチップがカーソルに追従する様な動きを得ることができます。
components/chart/recordsCircles.tsx
const View = (props: Props) => {
  const columnCount = 28
  const max = 100
  const width = 640
  const height = 256
  const records = mockRecords(columnCount, max)
  return (
    <Provider
      width={width}
      height={height}
      records={records}
    >
      <div className={props.className}>
        <Chart>
          <BgBaseLines />
          <BgColumnLines />
          <RecordsLine />
          <RecordsCircles />
          <RecordsHitArea />
        </Chart>
        <Info />
      </div>
    </Provider>
  )
}
日付け毎の点を表示するコンポーネントです。
components/chart/recordsCircles.tsx
export default () => {
  const { chartPoints } = useContext(LineChartContext)
  return useMemo(
    () => <StyledView chartPoints={chartPoints} />,
    [chartPoints]
  )
}
折れ線を描くコンポーネントです。
components/chart/recordsLine.tsx
export default () => {
  const { chartBound, chartPath } = useContext(
    LineChartContext
  )
  return useMemo(
    () => (
      <View
        d={`M${chartBound.x},${chartBound.y} M${chartPath}`}
      />
    ),
    [chartBound, chartPath]
  )
}
Infoコンポーネント(ツールチップ)は SVG ではありません。SVG の上に重ねた DOM で、position: absolute の要素に座標を適用して重ねています。表現するものによっては、SVG よりも DOM で描いた方が目的に適していることがあります。
components/info.tsx
export default () => {
  const { currentPoint } = useContext(LineChartContext)
  return useMemo(
    () => {
      if (currentPoint === null) return <div />
      const { dateLabel, amount } = currentPoint
      const top = currentPoint.y
      const left = currentPoint.x + 10
      return (
        <StyledView
          dateLabel={dateLabel}
          amount={amount}
          top={top}
          left={left}
        />
      )
    },
    [currentPoint]
  )
}