先日、林野庁から、栃木県、兵庫県、高知県のデータが公開されました。
森林の未来を導く森林情報サイト~羅森盤~
各種データは、G空間情報センターに登録されています。
参照用のWebGISのページもあります。
その中で、TerrainRGBが公開されていたので、栃木県の山を立体的に表示してみようと思います。

残念ながらTerrrainRGBはG空間情報センターのページにはないようですが、
ブラウザのデバッグツールのNetworkを除くと
https://rinya-tochigi.geospatial.jp/2023/rinya/tile/terrainRGB/8/227/99.png
最大拡大してみてもZoomレベル18まで配信されています。
https://rinya-tochigi.geospatial.jp/2023/rinya/tile/terrainRGB/18/232645/102246.png
G空間情報センターのドメインgeospatiol.jpから配信されているようなので、このTerrainRGBを使います。
地図の表示には、MapLibreを使用します。
本家にサンプルがあるので見本にします。
3D Terrain - MapLibre GL JS
地理院の衛星写真を背景にして
栃木県の男体山が見える初期位置に調整します。
ソースは以下のとおりです。
<!DOCTYPE html>
<html lang="ja">
<head>
    <title>3D Terrain確認(栃木)</title>
    <meta property="og:description" content="Go beyond hillshade and show elevation in actual 3D." />
    <meta charset='utf-8'>
    <meta name="viewport" content="width=device-width, initial-scale=1">
    <link rel='stylesheet' href='https://unpkg.com/maplibre-gl@3.3.1/dist/maplibre-gl.css' />
    <script src='https://unpkg.com/maplibre-gl@3.3.1/dist/maplibre-gl.js'></script>
    <style>
        body { margin: 0; padding: 0; }
        html, body, #map { height: 100%; }
    </style>
</head>
<body>
<div id="map"></div>
<script>
    const map = (window.map = new maplibregl.Map({
        container: 'map',
        zoom: 15,
        center: [139.49997,36.75429],   //栃木県 男体山が見える用調整
        pitch: 70,
        bearing: -45,
        hash: true,
        style: {
            version: 8,
            sources: {
                gsi: {
                    type: 'raster',
                    tiles: ['https://cyberjapandata.gsi.go.jp/xyz/seamlessphoto/{z}/{x}/{y}.jpg'], //衛星写真
                    tileSize: 256,
                    attribution: '<a href="https://maps.gsi.go.jp/development/ichiran.html" target="_blank">地理院タイル</a>',
                    maxzoom: 19
                },
                terrainSource: {
                    type: 'raster-dem',
                    tiles: ["https://rinya-tochigi.geospatial.jp/2023/rinya/tile/terrainRGB/{z}/{x}/{y}.png"], //G空間情報センター 栃木のTerrainRGB
                    tileSize: 256,
                    attribution: '<a href="https://www.geospatial.jp/ckan/dataset/dem05_tochigi" target="_blank">栃木県</a>',
                    minzoom: 0,
                    maxzoom: 12,
                    bounds: [-180, -85.05112877980659, 180, 85.0511287798066],
                    center: [0, 0, 6]
                }
            },
            layers: [
                {
                    id: 'gsi',
                    type: 'raster',
                    source: 'gsi'
                }
            ],
            terrain: {
                source: 'terrainSource',
                exaggeration: 1
            }

        },
        maxZoom: 18,
        maxPitch: 85
    }));

    map.addControl(
        new maplibregl.NavigationControl({
            visualizePitch: true,
            showZoom: true,
            showCompass: true
        })
    );

    map.addControl(
        new maplibregl.TerrainControl({
            source: 'terrainSource',
            exaggeration: 1
        })
    );
</script>
</body>
</html>
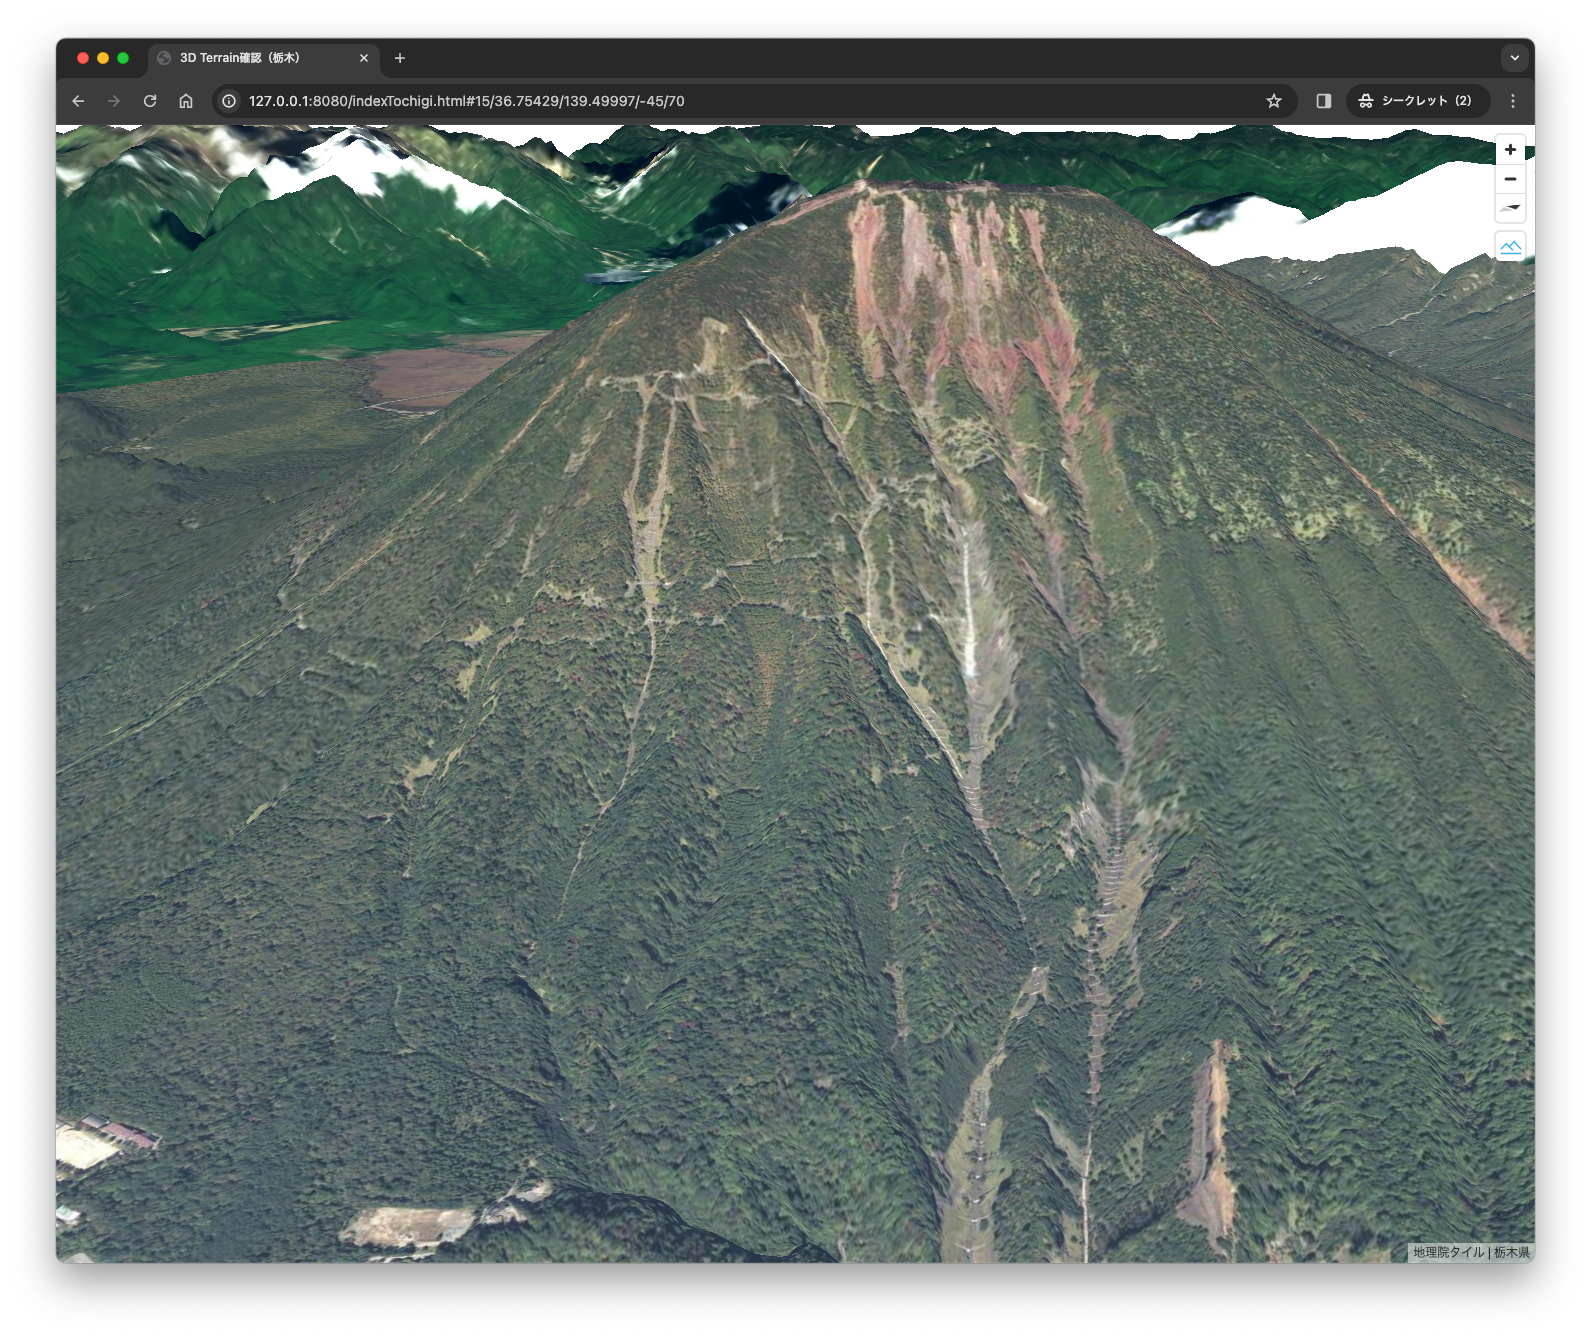
うまく表示できました。
やはり山が立体で見えるのは良いですね。
ただ気になる点もあります。
中禅寺湖の半分が切れている、標高が極端に低くなっています。

想像できる理由としては、
- 林野部門が整備したデータなので山が専門、水部分は守備範囲外。
- 航空レーザー測量の関係で、水部は、NodataになっておりTerrainRGBの0=-10000になってしまっている。
栃木県自体が台地状になっている。Terrainデータが無いところは、-10000になっているので、Nodataなのかと想像します。

ちなみにTerrainRGBの計算式は
height = -10000 + ((R * 256 * 256 + G * 256 + B) * 0.1)
TerrianRGBについては、こちらの記事で詳しく解説してくれてます。