最近、空気が悪くなった????
PM2.5 測定してみました。
最近、いろいろな匂いがするので、気のせいか確かめたよ。
環境基準の、35μ
測定結果は、2.5μg と 環境省の測定値、2μ と、ほぼ同じ!!
Sharp GP2Y1010AU0F Optical Dust Sensor PM2.5 測定
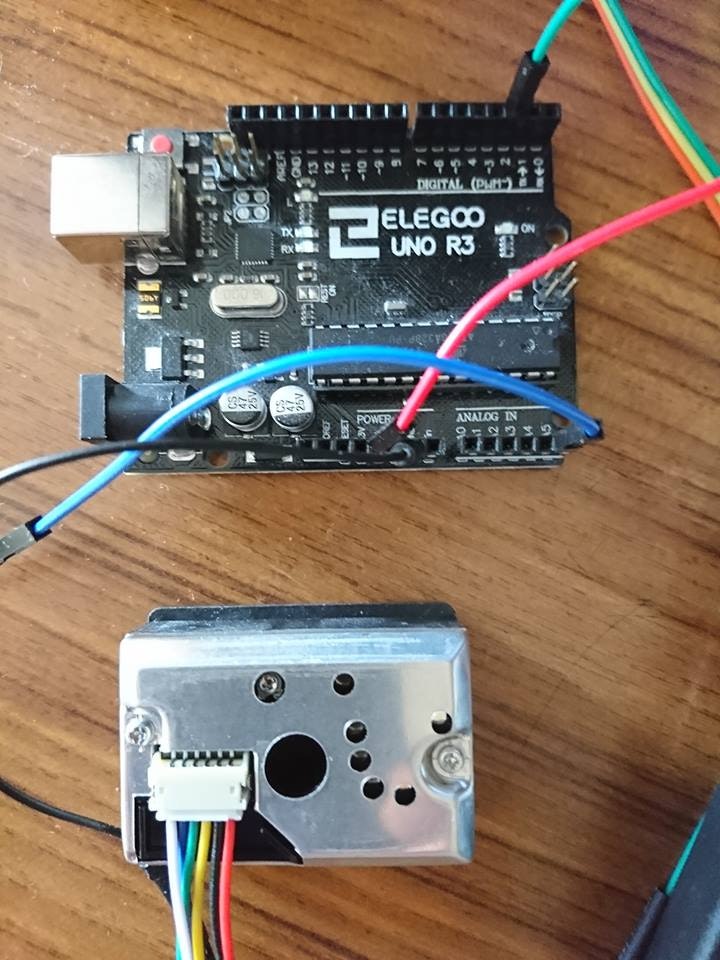
こちらの情報を参考に作成
Vo=289.11mV, DustDensity=0.71ug/m3
Vo=291.70mV, DustDensity=1.23ug/m3
Vo=298.34mV, DustDensity=2.56ug/m3
Vo=294.68mV, DustDensity=1.83ug/m3
Vo=292.97mV, DustDensity=1.48ug/m3
Vo=295.61mV, DustDensity=2.01ug/m3
Vo=290.43mV, DustDensity=0.98ug/m3
Vo=297.90mV, DustDensity=2.47ug/m3
Vo=295.41mV, DustDensity=1.97ug/m3
Vo=290.77mV, DustDensity=1.04ug/m3
Vo=293.85mV, DustDensity=1.66ug/m3
Vo=297.95mV, DustDensity=2.48ug/m3
Vo=296.92mV, DustDensity=2.28ug/m3
Vo=293.85mV, DustDensity=1.66ug/m3
Vo=290.53mV, DustDensity=1.00ug/m3
Vo=318.12mV, DustDensity=6.51ug/m3
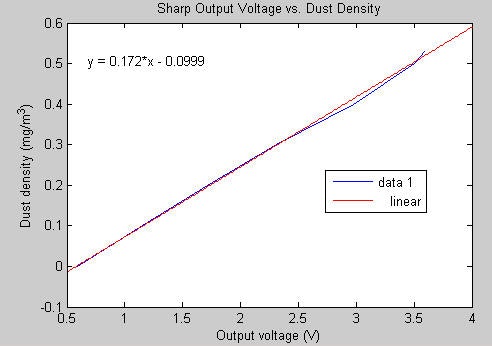
Voltage と、PM2.5濃度が比例してます。
Data compared to air quality:
3000 + = Very Bad
1050-3000 = Bad
300-1050 = Ordinary
150-300 = Good
75-150 = Very Good
0-75 = Tiptop
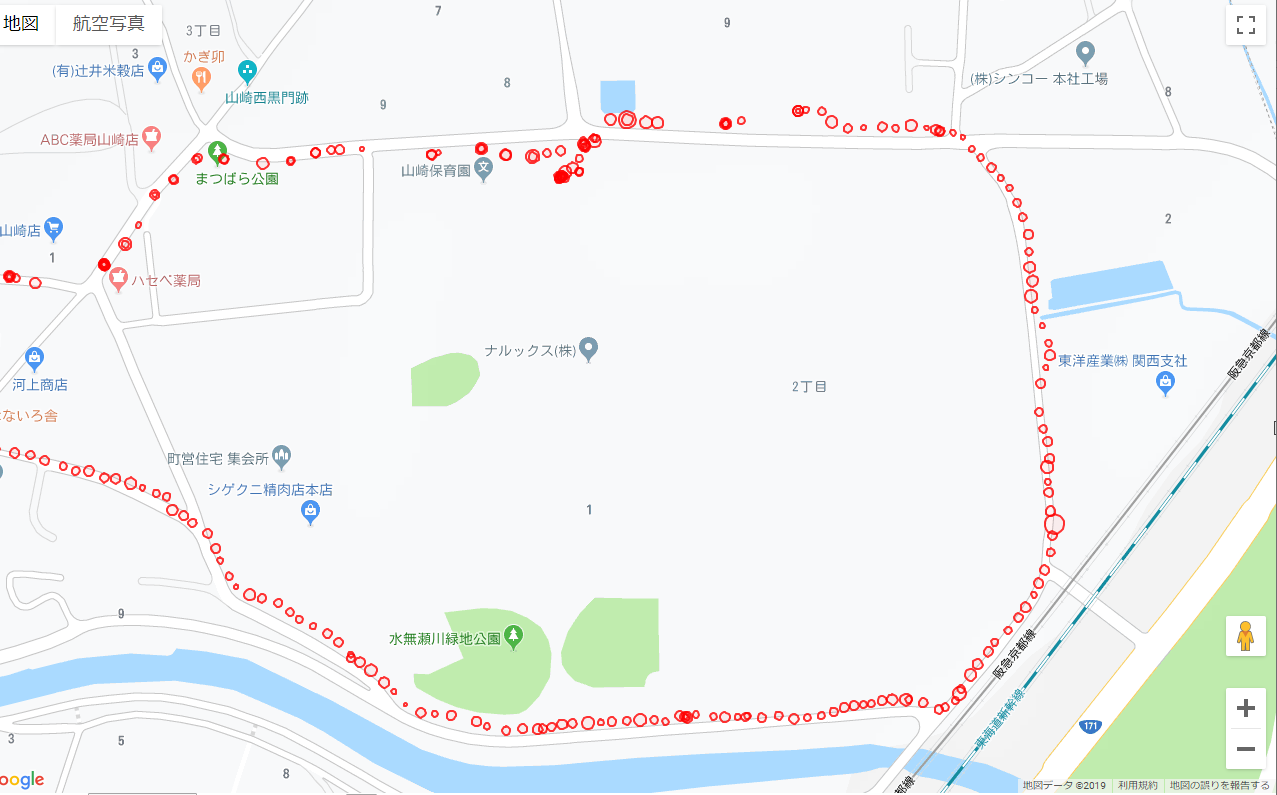
測定結果を地図上にマッピングしてみた。