目次
- はじめに
- 要件定義
- ユーザーストーリー
- 技術スタック
-
実装
5.1 バックエンド (main.py)
5.2 フロントエンド (index.html) - セットアップと実行方法
- 将来の拡張可能性
- まとめ
はじめに
この記事では、FastAPIとPlotly.jsを使用して、株価データを取得・表示するWebアプリケーションの構築方法を詳しく解説します。このアプリケーションでは、ユーザーが選択した企業の株価チャートを表示し、期間の調整や移動平均線の表示が可能です。また、カスタム銘柄コードの入力にも対応しています。

要件定義

機能要件
- ユーザーが指定した株式銘柄の株価データを表示する
- 株価データには終値と20日移動平均線を含む
- デフォルトで5つの主要な日本企業を選択可能にする
- ユーザーが任意の期間を指定してデータを取得できる
- 期間を前後に移動する機能を提供する
- 株価チャートをグラフィカルに表示する
- 選択した企業の銘柄コードと企業名を表示する
- カスタム銘柄コードの入力を可能にする
非機能要件
- レスポンス時間:データ取得から表示まで3秒以内
- ユーザビリティ:直感的なUIで、ITに詳しくないユーザーでも操作可能
- セキュリティ:ユーザーの個人情報を収集しない
- スケーラビリティ:将来的に企業リストの拡張が容易にできる設計
- 保守性:コードの可読性を高め、将来の機能追加や修正が容易になるようにする
- モバイル対応:レスポンシブデザインを採用し、様々なデバイスで使用可能にする
ユーザーストーリー

-
投資初心者として、私は簡単に主要企業の株価推移を確認したいので、デフォルトで表示される企業リストから選択できるようにしてほしい。
-
アクティブな投資家として、私は特定の期間の株価動向を分析したいので、自由に日付範囲を指定してデータを取得できるようにしてほしい。
-
長期投資家として、私は株価の長期トレンドを把握したいので、簡単に表示期間を前後に移動できるボタンがほしい。
-
ファンダメンタル分析を行う投資家として、私は企業の正式名称を確認しながら株価チャートを見たいので、銘柄コードと共に企業名も表示してほしい。
-
テクニカル分析を行う投資家として、私は移動平均線と株価を比較したいので、チャート上に両方を表示してほしい。
-
幅広い投資家として、私は様々な企業の株価を分析したいので、カスタム銘柄コードを入力できるようにしてほしい。
技術スタック
- バックエンド:FastAPI (Python)
- フロントエンド:HTML, JavaScript, jQuery
- データ可視化:Plotly.js
- 株価データ取得:yfinance ライブラリ
- スタイリング:CSS, Google Fonts
実装

将来、オプションところは未実装
バックエンド (main.py)
from fastapi import FastAPI, Request, HTTPException
from fastapi.responses import HTMLResponse
from fastapi.templating import Jinja2Templates
import yfinance as yf
import pandas as pd
import numpy as np
from datetime import datetime, timedelta

app = FastAPI()

templates = Jinja2Templates(directory="templates")

DEFAULT_STOCKS = [
    {"code": "7203.T", "name": "トヨタ自動車"},
    {"code": "9984.T", "name": "ソフトバンクグループ"},
    {"code": "6758.T", "name": "ソニーグループ"},
    {"code": "6861.T", "name": "キーエンス"},
    {"code": "9433.T", "name": "KDDI"}
]

def handle_nan_infinity(obj):
    if isinstance(obj, (np.float64, np.float32, float)):
        if np.isnan(obj) or np.isinf(obj):
            return None
    return obj

@app.get("/", response_class=HTMLResponse)
async def read_root(request: Request):
    return templates.TemplateResponse("index.html", {"request": request, "default_stocks": DEFAULT_STOCKS})

@app.get("/api/stock-data")
async def get_stock_data(ticker: str, start_date: str, end_date: str):
    try:
        stock = yf.Ticker(ticker)
        df = stock.history(start=start_date, end=end_date)

        if df.empty:
            raise HTTPException(status_code=404, detail="No data found for the given ticker and date range")

        close_prices = [handle_nan_infinity(price) for price in df['Close'].tolist()]
        dates = df.index.strftime('%Y-%m-%d').tolist()

        # 20日移動平均の計算
        ma_20 = [handle_nan_infinity(ma) for ma in df['Close'].rolling(window=20).mean().tolist()]

        # 企業名を取得
        company_name = stock.info.get('longName', 'Unknown')

        return {
            "dates": dates,
            "prices": close_prices,
            "ma_20": ma_20,
            "company_name": company_name
        }
    except Exception as e:
        raise HTTPException(status_code=500, detail=str(e))
フロントエンド (index.html)
<!DOCTYPE html>
<html lang="ja">
<head>
    <meta charset="UTF-8">
    <meta name="viewport" content="width=device-width, initial-scale=1.0">
    <title>StockViz - 株価分析アプリ</title>
    <script src="https://cdn.plot.ly/plotly-latest.min.js"></script>
    <script src="https://code.jquery.com/jquery-3.6.0.min.js"></script>
    <link href="https://fonts.googleapis.com/css2?family=Poppins:wght@300;400;600&display=swap" rel="stylesheet">
    <style>
        :root {
            --primary-color: #6C63FF;
            --secondary-color: #FF6584;
            --background-color: #F0F2F5;
            --text-color: #333333;
        }
        body {
            font-family: 'Poppins', sans-serif;
            margin: 0;
            padding: 0;
            background-color: var(--background-color);
            color: var(--text-color);
        }
        .container {
            max-width: 1200px;
            margin: 0 auto;
            padding: 20px;
        }
        h1 {
            text-align: center;
            color: var(--primary-color);
            font-size: 2.5em;
            margin-bottom: 30px;
        }
        #stock-info {
            background-color: white;
            border-radius: 10px;
            padding: 20px;
            margin-bottom: 20px;
            box-shadow: 0 4px 6px rgba(0, 0, 0, 0.1);
            transition: all 0.3s ease;
        }
        #stock-info:hover {
            transform: translateY(-5px);
            box-shadow: 0 6px 8px rgba(0, 0, 0, 0.15);
        }
        #stock-form {
            display: flex;
            flex-wrap: wrap;
            gap: 10px;
            margin-bottom: 20px;
        }
        select, input, button {
            padding: 10px;
            border: none;
            border-radius: 5px;
            font-size: 16px;
        }
        select, input[type="text"], input[type="date"] {
            flex-grow: 1;
            min-width: 200px;
        }
        button {
            background-color: var(--primary-color);
            color: white;
            cursor: pointer;
            transition: background-color 0.3s ease;
        }
        button:hover {
            background-color: #5A52D5;
        }
        #custom-ticker {
            display: none;
        }
        #stock-chart {
            background-color: white;
            border-radius: 10px;
            padding: 20px;
            box-shadow: 0 4px 6px rgba(0, 0, 0, 0.1);
            min-height: 400px;
        }
        #error-message {
            color: var(--secondary-color);
            text-align: center;
            margin-top: 10px;
        }
        .loading {
            text-align: center;
            padding: 20px;
            font-style: italic;
            color: var(--primary-color);
        }
        @media (max-width: 768px) {
            #stock-form {
                flex-direction: column;
            }
            select, input, button {
                width: 100%;
            }
        }
    </style>
</head>
<body>
    <div class="container">
        <h1>StockViz 📈</h1>
        <div id="stock-info"></div>
        <form id="stock-form">
            <select id="stock-select">
                <option value="">カスタム銘柄コードを入力</option>
                {% for stock in default_stocks %}
                    <option value="{{ stock.code }}">{{ stock.name }} ({{ stock.code }})</option>
                {% endfor %}
            </select>
            <input type="text" id="custom-ticker" placeholder="カスタム銘柄コード(例: 7203.T)">
            <input type="date" id="start-date" name="start-date" required>
            <input type="date" id="end-date" name="end-date" required>
            <button type="submit">データ取得</button>
        </form>
        <div>
            <button id="prev-period">◀ 前の期間</button>
            <button id="next-period">次の期間 ▶</button>
        </div>
        <div id="stock-chart"></div>
        <div id="error-message"></div>
    </div>

    <script>
        $(document).ready(function() {
            let currentStartDate, currentEndDate;

            function updateDates(startDate, endDate) {
                currentStartDate = new Date(startDate);
                currentEndDate = new Date(endDate);
                $('#start-date').val(currentStartDate.toISOString().split('T')[0]);
                $('#end-date').val(currentEndDate.toISOString().split('T')[0]);
            }

            const today = new Date();
            const oneYearAgo = new Date(today.getFullYear() - 1, today.getMonth(), today.getDate());
            updateDates(oneYearAgo, today);

            $('#stock-select').change(function() {
                if ($(this).val() === "") {
                    $('#custom-ticker').slideDown();
                } else {
                    $('#custom-ticker').slideUp();
                }
            });

            function fetchStockData() {
                let ticker = $('#stock-select').val();
                if (ticker === "") {
                    ticker = $('#custom-ticker').val();
                }
                const startDate = $('#start-date').val();
                const endDate = $('#end-date').val();

                $('#error-message').text('');
                $('#stock-info').html('<p class="loading">データを取得中...</p>');
                $('#stock-chart').html('<p class="loading">グラフを準備中...</p>');

                $.ajax({
                    url: `/api/stock-data?ticker=${ticker}&start_date=${startDate}&end_date=${endDate}`,
                    method: 'GET',
                    success: function(data) {
                        $('#stock-info').html(`<h2>${data.company_name} (${ticker})</h2>`);

                        const trace1 = {
                            x: data.dates,
                            y: data.prices,
                            type: 'scatter',
                            mode: 'lines',
                            name: '終値',
                            line: {color: '#6C63FF'}
                        };

                        const trace2 = {
                            x: data.dates,
                            y: data.ma_20,
                            type: 'scatter',
                            mode: 'lines',
                            name: '20日移動平均',
                            line: {color: '#FF6584'}
                        };

                        const layout = {
                            title: `${data.company_name}の株価チャート`,
                            xaxis: {
                                title: '日付',
                                rangeslider: {visible: false},
                                type: 'date'
                            },
                            yaxis: { title: '価格' },
                            template: 'plotly_white',
                            showlegend: true,
                            legend: {
                                x: 0,
                                y: 1,
                                traceorder: 'normal',
                                font: {
                                    family: 'sans-serif',
                                    size: 12,
                                    color: '#000'
                                },
                                bgcolor: '#E2E2E2',
                                bordercolor: '#FFFFFF',
                                borderwidth: 2
                            },
                            dragmode: 'zoom',
                            hovermode: 'closest',
                            margin: {
                                l: 50,
                                r: 50,
                                b: 50,
                                t: 50,
                                pad: 4
                            }
                        };

                        const config = {
                            responsive: true,
                            displayModeBar: true,
                            modeBarButtonsToAdd: ['drawline', 'drawopenpath', 'eraseshape'],
                            modeBarButtonsToRemove: ['lasso2d']
                        };

                        Plotly.newPlot('stock-chart', [trace1, trace2], layout, config);
                    },
                    error: function(jqXHR, textStatus, errorThrown) {
                        console.error("APIリクエストエラー:", textStatus, errorThrown);
                        $('#error-message').text('データの取得に失敗しました。銘柄コードと日付を確認してください。');
                        $('#stock-info').html('');
                        $('#stock-chart').html('');
                    }
                });
            }

            $('#stock-form').submit(function(e) {
                e.preventDefault();
                fetchStockData();
            });

            $('#prev-period, #next-period').click(function() {
                const direction = $(this).attr('id') === 'prev-period' ? -1 : 1;
                const periodLength = currentEndDate - currentStartDate;
                currentStartDate = new Date(currentStartDate.getTime() + direction * periodLength);
                currentEndDate = new Date(currentEndDate.getTime() + direction * periodLength);
                updateDates(currentStartDate, currentEndDate);
                fetchStockData();
            });

            // 初期データ取得を遅延実行
            setTimeout(function() {
                if ($('#stock-select').val() !== "") {
                    fetchStockData();
                } else {
                    $('#stock-info').html('<p>銘柄を選択してデータを取得してください。</p>');
                    $('#stock-chart').html('<p>ここに株価チャートが表示されます。</p>');
                }
            }, 100);
        });
    </script>
</body>
</html>
セットアップと実行方法
-
必要なパッケージをインストールします:
pip install fastapi uvicorn jinja2 yfinance pandas -
main.pyとindex.htmlファイルを作成し、上記のコードをそれぞれ貼り付けます。 -
index.htmlファイルはtemplatesディレクトリ内に配置してください。 -
以下のコマンドでアプリケーションを起動します:
uvicorn main:app --reload -
ブラウザで
http://localhost:8000にアクセスすると、アプリケーションが表示されます。
使用方法
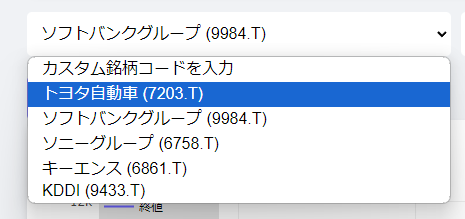
- ドロップダウンメニューから既定の銘柄を選択するか、「カスタム銘柄コードを入力」を選択してカスタムコードを入力します。
- 日付範囲を設定します(デフォルトは過去1年間)。
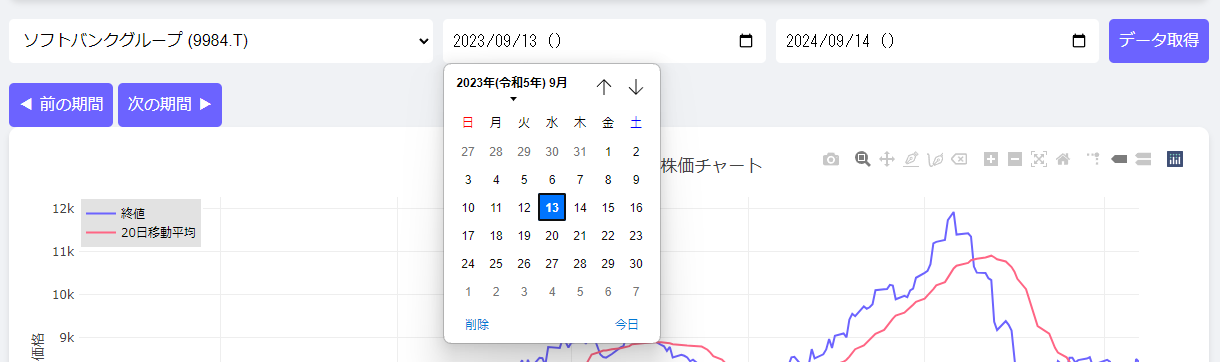
- 「データ取得」ボタンをクリックして株価データを取得・表示します。
- 「前の期間」「次の期間」ボタンで日付範囲を移動できます。
- グラフ上でズームやパン、ホバーして詳細情報の確認ができます。


主な特徴
- 直感的なUI: ユーザーフレンドリーなインターフェースで、簡単に操作できます。
- カスタム銘柄入力: 既定の銘柄以外も分析可能です。
- インタラクティブなグラフ: Plotly.jsを使用した高度な視覚化機能を提供します。
- レスポンシブデザイン: 様々なデバイスに対応します。
- エラーハンドリング: ユーザーに分かりやすいエラーメッセージを表示します。
将来の拡張可能性
- 複数銘柄の同時比較機能
- より多くの技術的指標(RSI、MACD等)の追加
- ニュースフィードの統合
- ユーザーアカウント機能(お気に入り銘柄の保存など)
- アラート機能(特定の条件を満たした場合に通知)
- データのエクスポート機能(CSV、PDFなど)
- より詳細な財務情報の表示
- ダークモードの実装
まとめ

このプロジェクトでは、FastAPIとPlotly.jsを使用して、使いやすく機能的な株価分析Webアプリケーションを作成しました。ユーザーは主要な日本企業やカスタム銘柄の株価データを簡単に取得し、視覚化することができます。
アプリケーションは、投資初心者からアクティブな投資家まで、幅広いユーザーのニーズに対応しています。モダンなデザインと直感的なUIにより、ユーザーエクスペリエンスが向上し、株価データの分析がより楽しく効果的になりました。
今後は、ユーザーフィードバックを基に機能を改善し、より多くの分析ツールや情報を提供することで、さらに有用なアプリケーションに発展させていくことができるでしょう。また、提案された拡張機能を実装することで、アプリケーションの価値をさらに高めることができます。
このプロジェクトを通じて、Webアプリケーションのバックエンドとフロントエンドの連携、APIの作成、データの可視化、そしてユーザーインターフェースデザインについて学ぶことができました。これらのスキルは、他の多くのWebアプリケーション開発プロジェクトにも応用可能です。