はじめに
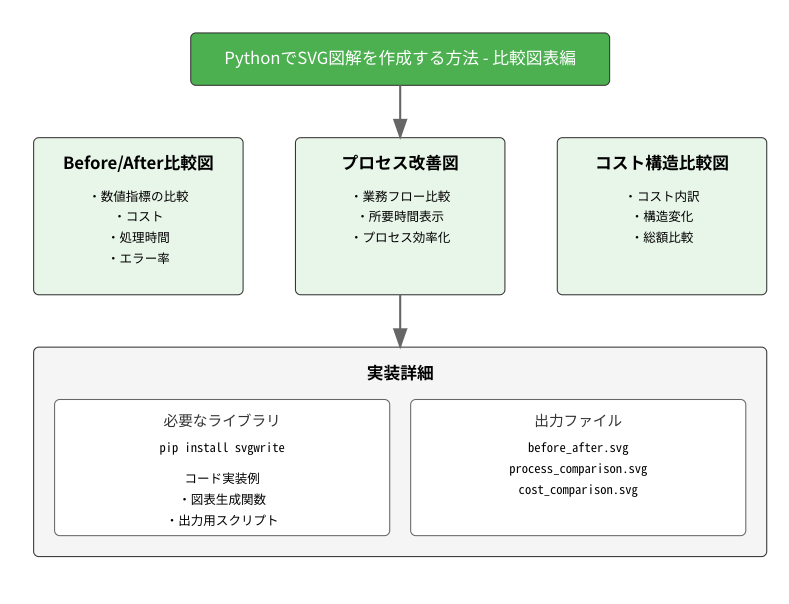
ビジネスプレゼンテーションやレポートで効果的な比較図表を作成したい場合、SVG(Scalable Vector Graphics)は最適な選択肢の一つです。本記事では、Pythonを使用してビジネス向けの比較図表を作成する方法を解説します。
環境準備
pip install svgwrite
1. Before/After比較図
導入効果や改善結果を示す際に使用できる、シンプルな Before/After 比較図を作成します。
import svgwrite

def create_before_after():
    # SVGキャンバスの作成
    dwg = svgwrite.Drawing('before_after.svg', size=('800px', '400px'))

    # スタイルの定義
    dwg.defs.add(dwg.style('''
        .title { font-size: 20px; font-weight: bold; }
        .metric { font-size: 16px; }
        .value { font-size: 24px; font-weight: bold; }
    '''))

    # Before(左側)
    dwg.add(dwg.rect((50, 50), (300, 300),
                     fill='#f0f0f0',
                     stroke='#333'))
    dwg.add(dwg.text('導入前', (200, 80),
                     class_='title',
                     text_anchor='middle'))

    # After(右側)
    dwg.add(dwg.rect((450, 50), (300, 300),
                     fill='#e6f3ff',
                     stroke='#333'))
    dwg.add(dwg.text('導入後', (600, 80),
                     class_='title',
                     text_anchor='middle'))

    # 比較指標の追加
    metrics = [
        ('コスト', '¥1,000,000', '¥400,000'),
        ('処理時間', '240分', '30分'),
        ('エラー率', '5.0%', '0.1%'),
    ]

    for i, (label, before, after) in enumerate(metrics):
        y = 150 + i * 70
        # ラベル
        dwg.add(dwg.text(label, (50, y), class_='metric'))
        # Before値
        dwg.add(dwg.text(before, (200, y),
                        class_='value',
                        text_anchor='middle'))
        # After値
        dwg.add(dwg.text(after, (600, y),
                        class_='value',
                        text_anchor='middle'))

    dwg.save()
2. プロセス改善図
業務プロセスの改善前後を比較する図表です。
def create_process_comparison():
    dwg = svgwrite.Drawing('process_comparison.svg',
                          size=('1000px', '500px'))

    # スタイルの定義
    dwg.defs.add(dwg.style('''
        .title { font-size: 20px; font-weight: bold; }
        .process { font-size: 14px; }
        .arrow { fill: none; stroke: #666; stroke-width: 2; }
        .time { font-size: 12px; fill: #666; }
    '''))

    # 矢印マーカーの定義
    marker = dwg.marker(insert=(0, 0), size=(10, 10))
    marker.add(dwg.path(d='M0,0 L10,5 L0,10 Z', fill='#666'))
    dwg.defs.add(marker)

    # 従来のプロセス(上段)
    y1 = 100
    processes1 = [
        ('申請受付\n(2日)', 150),
        ('内容確認\n(3日)', 150),
        ('承認処理\n(2日)', 150),
        ('通知送信\n(1日)', 150)
    ]

    x = 100
    for i, (process, width) in enumerate(processes1):
        # プロセスボックス
        dwg.add(dwg.rect((x, y1), (width, 60),
                        fill='#f0f0f0',
                        stroke='#333'))
        # プロセス名と所要時間
        process_name, time = process.split('\n')
        dwg.add(dwg.text(process_name, (x + width/2, y1 + 25),
                        class_='process',
                        text_anchor='middle'))
        dwg.add(dwg.text(time, (x + width/2, y1 + 45),
                        class_='time',
                        text_anchor='middle'))

        # 矢印(最後以外)
        if i < len(processes1) - 1:
            dwg.add(dwg.line((x + width, y1 + 30),
                            (x + width + 20, y1 + 30),
                            class_='arrow',
                            marker_end=marker.get_funciri()))
        x += width + 20

    # 改善後のプロセス(下段)
    y2 = 300
    processes2 = [
        ('電子申請\n(即時)', 150),
        ('自動チェック\n(即時)', 150),
        ('AI承認\n(1時間)', 150),
        ('自動通知\n(即時)', 150)
    ]

    x = 100
    for i, (process, width) in enumerate(processes2):
        dwg.add(dwg.rect((x, y2), (width, 60),
                        fill='#e6f3ff',
                        stroke='#333'))
        process_name, time = process.split('\n')
        dwg.add(dwg.text(process_name, (x + width/2, y2 + 25),
                        class_='process',
                        text_anchor='middle'))
        dwg.add(dwg.text(time, (x + width/2, y2 + 45),
                        class_='time',
                        text_anchor='middle'))

        if i < len(processes2) - 1:
            dwg.add(dwg.line((x + width, y2 + 30),
                            (x + width + 20, y2 + 30),
                            class_='arrow',
                            marker_end=marker.get_funciri()))
        x += width + 20

    # タイトル
    dwg.add(dwg.text('従来のプロセス', (100, y1 - 20),
                     class_='title'))
    dwg.add(dwg.text('改善後のプロセス', (100, y2 - 20),
                     class_='title'))

    dwg.save()
3. コスト構造比較図
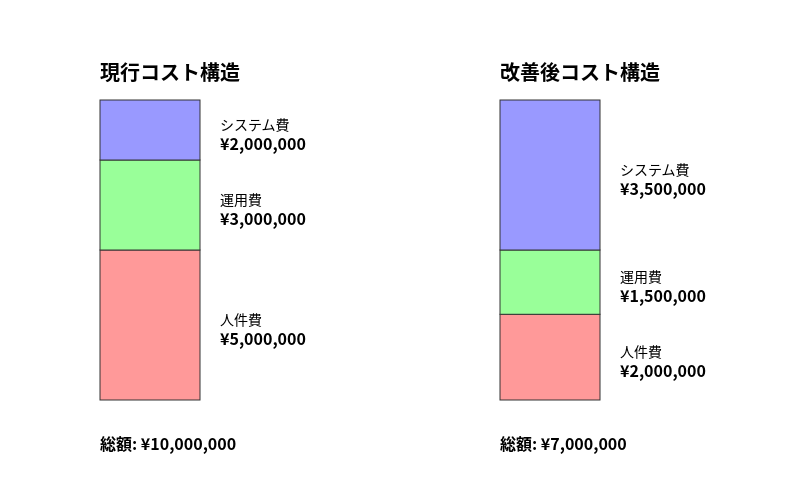
コスト構造の変化を視覚的に表現する図表です。
def create_cost_comparison():
    dwg = svgwrite.Drawing('cost_comparison.svg',
                          size=('800px', '500px'))

    # スタイルの定義
    dwg.defs.add(dwg.style('''
        .title { font-size: 20px; font-weight: bold; }
        .label { font-size: 14px; }
        .value { font-size: 16px; font-weight: bold; }
    '''))

    # 積み上げバーの作成
    def create_stacked_bar(x, y, values, colors, labels, total_height=300):
        current_y = y + total_height
        for i, (value, color, label) in enumerate(zip(values, colors, labels)):
            height = (value / sum(values)) * total_height
            dwg.add(dwg.rect((x, current_y - height),
                            (100, height),
                            fill=color,
                            stroke='#333'))
            # ラベルと値
            dwg.add(dwg.text(f'{label}', (x + 120, current_y - height/2),
                            class_='label'))
            dwg.add(dwg.text(f'¥{value:,}', (x + 120, current_y - height/2 + 20),
                            class_='value'))
            current_y -= height

    # 現行コスト(左側)
    current_costs = [5000000, 3000000, 2000000]
    current_colors = ['#ff9999', '#99ff99', '#9999ff']
    current_labels = ['人件費', '運用費', 'システム費']

    create_stacked_bar(100, 100, current_costs,
                      current_colors, current_labels)

    # 改善後コスト(右側)
    new_costs = [2000000, 1500000, 3500000]
    create_stacked_bar(500, 100, new_costs,
                      current_colors, current_labels)

    # タイトル
    dwg.add(dwg.text('現行コスト構造', (100, 80), class_='title'))
    dwg.add(dwg.text('改善後コスト構造', (500, 80), class_='title'))

    # 総額表示
    dwg.add(dwg.text(f'総額: ¥{sum(current_costs):,}',
                     (100, 450), class_='value'))
    dwg.add(dwg.text(f'総額: ¥{sum(new_costs):,}',
                     (500, 450), class_='value'))

    dwg.save()
まとめ
このコード例を活用することで、以下のような比較図表が作成できます:
- Before/After比較図:施策の効果を数値で示す
- プロセス改善図:業務フローの改善を視覚化
- コスト構造比較図:コストの内訳変化を表現


