はじめに
ビジネスプロセスを図解する際、PlantUMLやMermaidなどの既存ツールを使うことが多いですが、より柔軟なカスタマイズや自動生成が必要な場合は、Pythonを使ってSVGを直接生成する方法が有効です。
環境準備
必要なライブラリをインストールします:
pip install svgwrite pyyaml
実装
プロセス図を生成するクラスと、設定ファイルからの生成スクリプトを実装します:
import svgwrite
from typing import List, Dict
import yaml

class ProcessDiagram:
    def __init__(self, width: int = 1200, height: int = 600):
        self.dwg = svgwrite.Drawing(size=(width, height))
        self.node_width = 120
        self.node_height = 60
        self.spacing = 100
        self.current_x = 50
        self.current_y = 50

    def add_process_node(self, text: str, fill: str = "#E8F4F9") -> tuple:
        """プロセスノードを追加"""
        group = self.dwg.g()

        # 長方形を描画
        rect = self.dwg.rect(
            insert=(self.current_x, self.current_y),
            size=(self.node_width, self.node_height),
            fill=fill,
            stroke="black",
            rx=5, ry=5
        )
        group.add(rect)

        # テキストを追加(中央揃え)
        text_element = self.dwg.text(
            text,
            insert=(self.current_x + self.node_width/2,
                    self.current_y + self.node_height/2),
            text_anchor="middle",
            dominant_baseline="middle"
        )
        group.add(text_element)

        self.dwg.add(group)

        # 現在の座標を返す(矢印描画用)
        return (self.current_x, self.current_y)

    def add_arrow(self, start: tuple, end: tuple):
        """ノード間の矢印を追加"""
        # 始点と終点の調整(ノードの端から開始)
        start_x = start[0] + self.node_width
        start_y = start[1] + self.node_height/2
        end_x = end[0]
        end_y = end[1] + self.node_height/2

        # 矢印を描画
        arrow = self.dwg.path(
            d=f"M {start_x},{start_y} L {end_x},{end_y}",
            stroke="black",
            fill="none",
            marker_end=self.arrow_marker()
        )
        self.dwg.add(arrow)

    def arrow_marker(self):
        """矢印マーカーの定義"""
        marker = self.dwg.marker(
            insert=(10,5), size=(10,10),
            orient="auto",
            markerUnits="strokeWidth"
        )
        marker.add(self.dwg.path(
            d="M 0,0 L 10,5 L 0,10 L 4,5 Z",
            fill="black"
        ))
        self.dwg.defs.add(marker)
        return marker.get_funciri()

    def save(self, filename: str):
        """SVGファイルを保存"""
        self.dwg.save()

def generate_process_diagram(config_file: str, output_file: str):
    # 設定ファイルの読み込み
    with open(config_file, 'r', encoding='utf-8') as f:
        config = yaml.safe_load(f)

    # 図の初期化
    diagram = ProcessDiagram()

    # ノードの位置を記録
    node_positions = {}

    # プロセスノードの追加
    for i, process in enumerate(config['processes']):
        # ノードを追加し、位置を記録
        pos = diagram.add_process_node(process['name'], process.get('color', '#E8F4F9'))
        node_positions[process['name']] = pos

        # 次のノードの位置を設定
        diagram.current_x += diagram.node_width + diagram.spacing

    # 矢印の追加
    for process in config['processes']:
        if 'next' in process:
            start_pos = node_positions[process['name']]
            end_pos = node_positions[process['next']]
            diagram.add_arrow(start_pos, end_pos)

    # SVGファイルの保存
    diagram.save(output_file)
設定ファイルの作成
プロセスの定義をYAMLファイルで管理します:
# process_config.yaml
processes:
  - name: 受注受付
    color: "#E8F4F9"
    next: 在庫確認
  - name: 在庫確認
    color: "#E8F4F9"
    next: 出荷準備
  - name: 出荷準備
    color: "#E8F4F9"
    next: 配送
  - name: 配送
    color: "#E8F4F9"
使用例
if __name__ == "__main__":
    generate_process_diagram('process_config.yaml', 'business_process.svg')
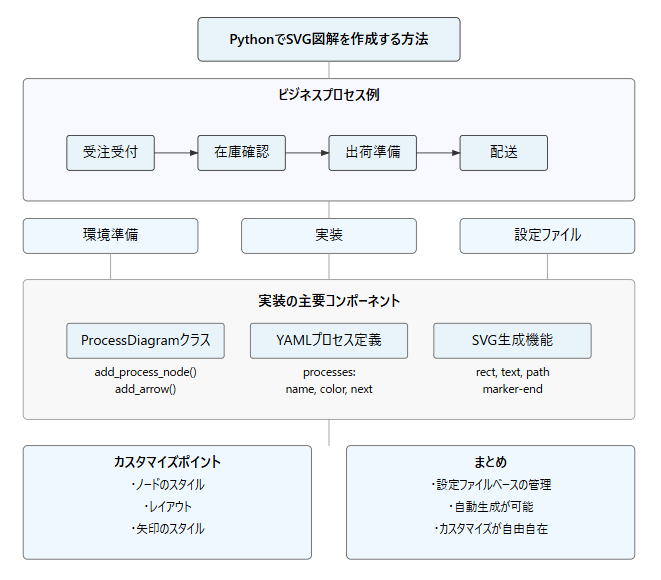
出力結果
カスタマイズのポイント
-
ノードのスタイル
-
node_width、node_heightでサイズを調整 -
fillパラメータで背景色を変更 -
rx、ryで角の丸みを調整
-
-
レイアウト
-
spacingでノード間の距離を調整 -
current_x、current_yで開始位置を設定
-
-
矢印のスタイル
-
strokeで線の色を変更 -
marker-endで矢印の形状をカスタマイズ
-
まとめ
- 設定ファイルベースの管理で保守性が向上
- プログラムによる自動生成が可能
- 細かいカスタマイズが自由自在
- バージョン管理が容易

