はじめに
データ可視化は、データ分析において重要な役割を果たします。本記事では、Google Colab環境でMatplotlibを使用してSVGグラフを作成する方法を、実践的なコード例とともに解説します。SVG形式は、拡大してもぼやけない高品質なベクターグラフィックスを提供します。
必要なライブラリのインポート
import matplotlib.pyplot as plt
import numpy as np
import pandas as pd

# Google Colab用のインライン表示設定
%matplotlib inline
Google DriveのマウントとSVG保存用のディレクトリ設定
from google.colab import drive
drive.mount('/content/drive')

# SVG保存用のディレクトリパス
SAVE_DIR = '/content/drive/My Drive/matplotlib_svg/'

# ディレクトリが存在しない場合は作成
import os
os.makedirs(SAVE_DIR, exist_ok=True)
1. 折れ線グラフ
折れ線グラフは、時系列データの表現に適しています。
シンプルな折れ線グラフ
# データの準備
x = np.linspace(0, 10, 100)
y = np.sin(x)

# グラフの作成
plt.figure(figsize=(10, 6))
plt.plot(x, y, label='sin(x)')

# グラフの装飾
plt.title('Simple Line Plot')
plt.xlabel('X axis')
plt.ylabel('Y axis')
plt.legend()
plt.grid(True)

# SVGとして保存
plt.savefig(f'{SAVE_DIR}simple_line.svg', format='svg', bbox_inches='tight', dpi=300)

# グラフの表示
plt.show()
plt.close()
複数系列の折れ線グラフ
# データの準備
x = np.linspace(0, 2*np.pi, 100)
y1 = np.sin(x)
y2 = np.cos(x)

# グラフの作成
plt.figure(figsize=(10, 6))
plt.plot(x, y1, label='sin(x)')
plt.plot(x, y2, label='cos(x)')

# グラフの装飾
plt.title('Multiple Line Plot')
plt.xlabel('X axis')
plt.ylabel('Y axis')
plt.legend()
plt.grid(True)

# SVGとして保存
plt.savefig(f'{SAVE_DIR}multiple_line.svg', format='svg', bbox_inches='tight', dpi=300)

# グラフの表示
plt.show()
plt.close()
2. 棒グラフ
棒グラフは、カテゴリカルデータの比較に適しています。
シンプルな棒グラフ
# データの準備
categories = ['A', 'B', 'C', 'D', 'E']
values = [23, 45, 56, 78, 43]

# グラフの作成
plt.figure(figsize=(10, 6))
bars = plt.bar(categories, values)

# 棒の上に値を表示
for bar in bars:
    height = bar.get_height()
    plt.text(bar.get_x() + bar.get_width()/2., height,
             f'{height:,}',
             ha='center', va='bottom')

# グラフの装飾
plt.title('Simple Bar Plot')
plt.xlabel('Categories')
plt.ylabel('Values')

# SVGとして保存
plt.savefig(f'{SAVE_DIR}simple_bar.svg', format='svg', bbox_inches='tight', dpi=300)

# グラフの表示
plt.show()
plt.close()
グループ化された棒グラフ
# データの準備
labels = ['Group A', 'Group B', 'Group C', 'Group D']
men_means = [20, 34, 30, 35]
women_means = [25, 32, 34, 20]

x = np.arange(len(labels))
width = 0.35

# グラフの作成
plt.figure(figsize=(10, 6))
plt.bar(x - width/2, men_means, width, label='Men')
plt.bar(x + width/2, women_means, width, label='Women')

# グラフの装飾
plt.title('Grouped Bar Plot')
plt.xlabel('Groups')
plt.ylabel('Values')
plt.xticks(x, labels)
plt.legend()

# SVGとして保存
plt.savefig(f'{SAVE_DIR}grouped_bar.svg', format='svg', bbox_inches='tight', dpi=300)

# グラフの表示
plt.show()
plt.close()
3. 散布図
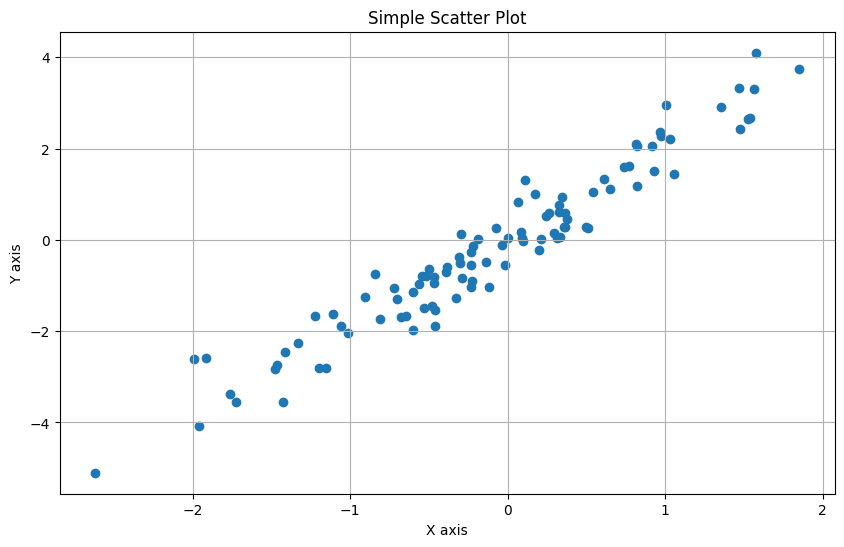
散布図は、2つの変数間の関係を視覚化するのに適しています。
シンプルな散布図
# データの準備
np.random.seed(42)
x = np.random.normal(0, 1, 100)
y = 2 * x + np.random.normal(0, 0.5, 100)

# グラフの作成
plt.figure(figsize=(10, 6))
plt.scatter(x, y)

# グラフの装飾
plt.title('Simple Scatter Plot')
plt.xlabel('X axis')
plt.ylabel('Y axis')
plt.grid(True)

# SVGとして保存
plt.savefig(f'{SAVE_DIR}scatter.svg', format='svg', bbox_inches='tight', dpi=300)

# グラフの表示
plt.show()
plt.close()
カラーマップを使用した散布図
# データの準備
np.random.seed(42)
x = np.random.normal(0, 1, 100)
y = np.random.normal(0, 1, 100)
colors = np.random.rand(100)

# グラフの作成
plt.figure(figsize=(10, 6))
scatter = plt.scatter(x, y, c=colors, cmap='viridis')
plt.colorbar(scatter)

# グラフの装飾
plt.title('Scatter Plot with Colormap')
plt.xlabel('X axis')
plt.ylabel('Y axis')
plt.grid(True)

# SVGとして保存
plt.savefig(f'{SAVE_DIR}scatter_colormap.svg', format='svg', bbox_inches='tight', dpi=300)

# グラフの表示
plt.show()
plt.close()
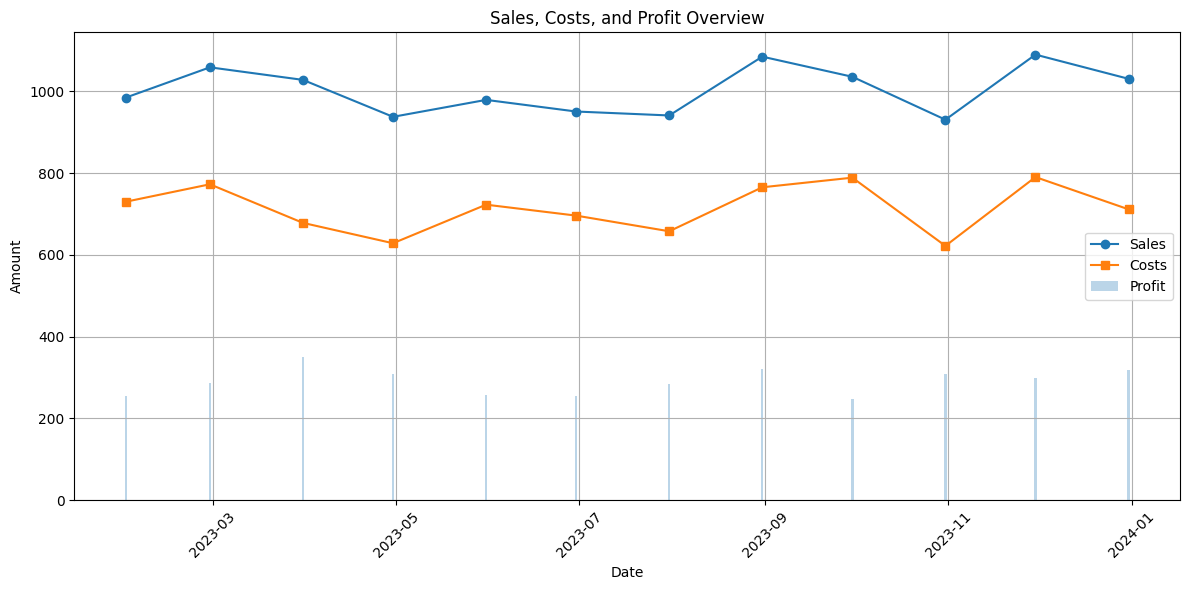
実践例:売上データの可視化
# サンプルデータの作成
dates = pd.date_range('2023-01-01', '2023-12-31', freq='M')
sales = np.random.normal(1000, 100, len(dates))
costs = sales * 0.7 + np.random.normal(0, 50, len(dates))
profit = sales - costs

# データフレームの作成
df = pd.DataFrame({
    'Date': dates,
    'Sales': sales,
    'Costs': costs,
    'Profit': profit
})

# 複合グラフの作成
plt.figure(figsize=(12, 6))
plt.plot(df['Date'], df['Sales'], marker='o', label='Sales')
plt.plot(df['Date'], df['Costs'], marker='s', label='Costs')
plt.bar(df['Date'], df['Profit'], alpha=0.3, label='Profit')

plt.title('Sales, Costs, and Profit Overview')
plt.xlabel('Date')
plt.ylabel('Amount')
plt.legend()
plt.grid(True)
plt.xticks(rotation=45)

# グラフの表示(余白を自動調整)
plt.tight_layout()

# SVGとして保存
plt.savefig(f'{SAVE_DIR}sales_overview.svg', format='svg', bbox_inches='tight', dpi=300)

# グラフの表示
plt.show()
plt.close()
SVGファイル保存のポイント
- 解像度とクオリティ
plt.savefig('filename.svg', format='svg', dpi=300, bbox_inches='tight')
-
format='svg': SVG形式での保存を指定 -
dpi=300: 高解像度で保存 -
bbox_inches='tight': 余白を適切に調整
- Google Driveへの保存
- 保存先ディレクトリを事前に作成
- パスは絶対パスで指定
- ファイル名は分かりやすい命名規則で
- メモリ管理
- グラフ作成後は
plt.close()でメモリを解放 - 大量のグラフを作成する場合は特に重要
まとめ
本記事では以下の内容を解説しました:
- 基本的なグラフタイプ(折れ線・棒・散布図)の作成方法
- SVGファイルとしての保存方法
- Google Colab環境での効率的なグラフ作成
SVG形式でグラフを保存することで:
- 画質を損なうことなく拡大可能
- ウェブでの表示に最適
- 後から編集可能


