はじめに
この記事では、Google Colaboratoryを使用して画像ファイルからSVGを生成する方法を説明します。PythonのOpenCVとnumpyのみを使用して実装します。
概要
- 画像の前処理(グレースケール化、エッジ検出)
- 輪郭抽出
- SVGパスの生成
- SVGファイルの出力
実装コード
import cv2
import numpy as np
from google.colab import files
from pathlib import Path
import base64

def upload_and_process_image():
    """Google Colabで画像をアップロードして処理する"""
    uploaded = files.upload()
    file_name = next(iter(uploaded))
    return cv2.imdecode(np.frombuffer(uploaded[file_name], np.uint8), cv2.IMREAD_COLOR)

def preprocess_image(image):
    """画像の前処理を行う"""
    # グレースケール変換
    gray = cv2.cvtColor(image, cv2.COLOR_BGR2GRAY)
    # ノイズ除去
    blurred = cv2.GaussianBlur(gray, (5, 5), 0)
    # エッジ検出
    edges = cv2.Canny(blurred, 50, 150)
    return edges

def extract_contours_with_colors(image, edges):
    """エッジから輪郭を抽出し、色情報も取得する"""
    contours, _ = cv2.findContours(edges, cv2.RETR_EXTERNAL, cv2.CHAIN_APPROX_SIMPLE)

    # 小さすぎる輪郭を除外
    min_contour_length = 10
    contours = [cnt for cnt in contours if len(cnt) >= min_contour_length]

    # 各輪郭の代表色を取得
    contours_with_colors = []
    for contour in contours:
        # マスクを作成
        mask = np.zeros(image.shape[:2], dtype=np.uint8)
        cv2.drawContours(mask, [contour], -1, 255, -1)

        # マスク領域の平均色を計算
        mean_color = cv2.mean(image, mask=mask)[:3]

        contours_with_colors.append({
            'contour': contour,
            'color': mean_color
        })

    return contours_with_colors

def contour_to_path(contour):
    """輪郭データをSVGパスに変換する"""
    if len(contour) < 2:
        return ""

    path = f"M {contour[0][0][0]},{contour[0][0][1]}"
    for point in contour[1:]:
        path += f" L {point[0][0]},{point[0][1]}"
    path += " Z"
    return path

def generate_svg(contours_with_colors, width, height):
    """SVGファイルを生成する(色情報付き)"""
    svg = f'<svg xmlns="http://www.w3.org/2000/svg" width="{width}" height="{height}">\n'

    for item in contours_with_colors:
        contour = item['contour']
        color = item['color']

        # RGB値を16進数に変換
        color_hex = '#{:02x}{:02x}{:02x}'.format(
            int(color[2]),  # OpenCVはBGR順なのでインデックスを調整
            int(color[1]),
            int(color[0])
        )

        path = contour_to_path(contour)
        if path:
            # 輪郭を塗りつぶしとストロークの両方で表現
            svg += f'  <path d="{path}" fill="{color_hex}" stroke="{color_hex}" stroke-width="1" opacity="0.8"/>\n'

    svg += '</svg>'
    return svg

def save_svg(svg_content, output_path):
    """SVGファイルを保存する"""
    with open(output_path, 'w', encoding='utf-8') as f:
        f.write(svg_content)

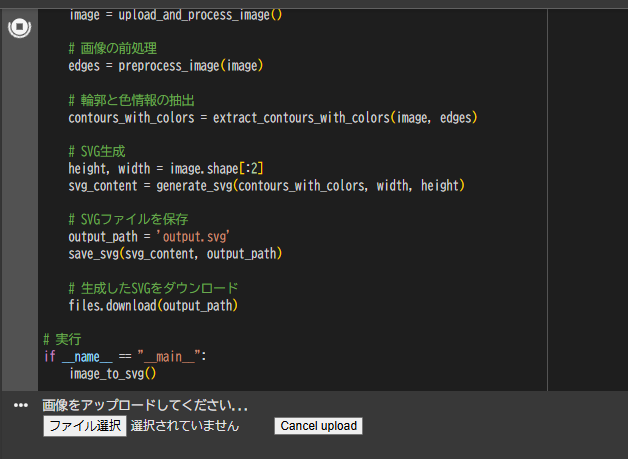
def image_to_svg():
    """メイン処理(色情報付き)"""
    # 画像をアップロード
    print("画像をアップロードしてください...")
    image = upload_and_process_image()

    # 画像の前処理
    edges = preprocess_image(image)

    # 輪郭と色情報の抽出
    contours_with_colors = extract_contours_with_colors(image, edges)

    # SVG生成
    height, width = image.shape[:2]
    svg_content = generate_svg(contours_with_colors, width, height)

    # SVGファイルを保存
    output_path = 'output.svg'
    save_svg(svg_content, output_path)

    # 生成したSVGをダウンロード
    files.download(output_path)

# 実行
if __name__ == "__main__":
    image_to_svg()
使用方法
- Google Colabで新しいノートブックを作成します。
- 上記のコードをセルにコピー&ペーストします。
- セルを実行すると、画像のアップロード画面が表示されます。
- 変換したい画像を選択してアップロードします。
- 処理が完了すると、自動的にSVGファイルがダウンロードされます。
処理の詳細説明
1. 画像の前処理
- ガウシアンブラーでノイズを除去
- Cannyエッジ検出で輪郭を抽出
- 元画像の色情報を保持
2. 輪郭と色情報の抽出
-
cv2.findContoursで輪郭点列を取得 - 小さすぎる輪郭を除外してノイズを削減
- 各輪郭領域の平均色を計算
- マスクを使用して正確な領域の色を抽出
3. SVGパスの生成
- 輪郭点列をSVGのパスコマンドに変換
- Mコマンドで開始点を指定
- Lコマンドで直線を描画
- Zコマンドでパスを閉じる
4. SVGファイルの出力
- SVGヘッダーとスタイルを設定
- パスデータを追加
- ファイルとして保存
カスタマイズのポイント
- エッジ検出の閾値調整
edges = cv2.Canny(blurred, 50, 150) # 閾値を調整して検出感度を変更
- 輪郭の最小サイズ変更
min_contour_length = 10 # 値を変更して細かい輪郭の除外基準を調整
- 色の透明度調整
# SVGのopacity値を変更して透明度を調整
svg += f'  <path d="{path}" fill="{color_hex}" stroke="{color_hex}" stroke-width="1" opacity="0.8"/>\n'
- 色の抽出方法のカスタマイズ
# 平均色の計算方法を変更(例:メディアン値を使用)
median_color = cv2.medianBlur(masked_image, ksize=5)
注意点
- 複雑な画像の場合、処理に時間がかかる可能性があります。期待するような抽出ができなことがあります。
- 画像のサイズが大きい場合は、事前にリサイズすることをお勧めします
- エッジ検出の閾値は画像によって調整が必要な場合があります
まとめ
このコードを使用することで、Google Colab上で簡単に画像からSVGを生成することができます。外部ライブラリに依存せず、基本的なPythonライブラリのみを使用しているため、環境構築も容易です。
画像の種類や目的に応じて、パラメータを調整することで、より良い結果を得ることができます。
参考資料
- OpenCV公式ドキュメント: https://docs.opencv.org/
- SVG仕様: https://www.w3.org/TR/SVG2/
- Google Colab ドキュメント: https://colab.research.google.com/


