はじめに
こんにちは!今回は、Pythonを使ってSVGで時系列データを可視化する方法について解説します。
特に以下の4つの図表の作成方法を詳しく見ていきましょう:
- タイムライン
- ロードマップ
- マイルストーン図
- ガントチャート
環境準備
まずは必要なライブラリをインストールします:
pip install svgwrite
1. タイムライン図の作成
タイムラインは、出来事や進捗を時系列で表現する基本的な図です。
import svgwrite

def create_timeline():
    # SVGキャンバスの作成
    dwg = svgwrite.Drawing('timeline.svg', size=('800px', '400px'))

    # 背景の追加
    dwg.add(dwg.rect(insert=(0, 0), size=('100%', '100%'),
                     fill='white'))

    # メインライン
    dwg.add(dwg.line(start=(100, 200), end=(700, 200),
                     stroke='#2196F3', stroke_width=4))

    # イベントの追加
    events = [
        {'x': 150, 'text': '要件定義', 'date': '2024/1'},
        {'x': 300, 'text': '設計完了', 'date': '2024/3'},
        {'x': 450, 'text': 'MVP完成', 'date': '2024/6'},
        {'x': 600, 'text': '正式リリース', 'date': '2024/9'}
    ]

    for event in events:
        # イベントポイント
        dwg.add(dwg.circle(center=(event['x'], 200), r=10,
                          fill='#2196F3'))

        # イベントテキスト(上部)
        dwg.add(dwg.text(event['text'],
                        insert=(event['x'], 170),
                        text_anchor='middle',
                        style="font-family: Arial; font-size: 14px"))

        # 日付(下部)
        dwg.add(dwg.text(event['date'],
                        insert=(event['x'], 230),
                        text_anchor='middle',
                        style="font-family: Arial; font-size: 12px"))

    dwg.save()

create_timeline()
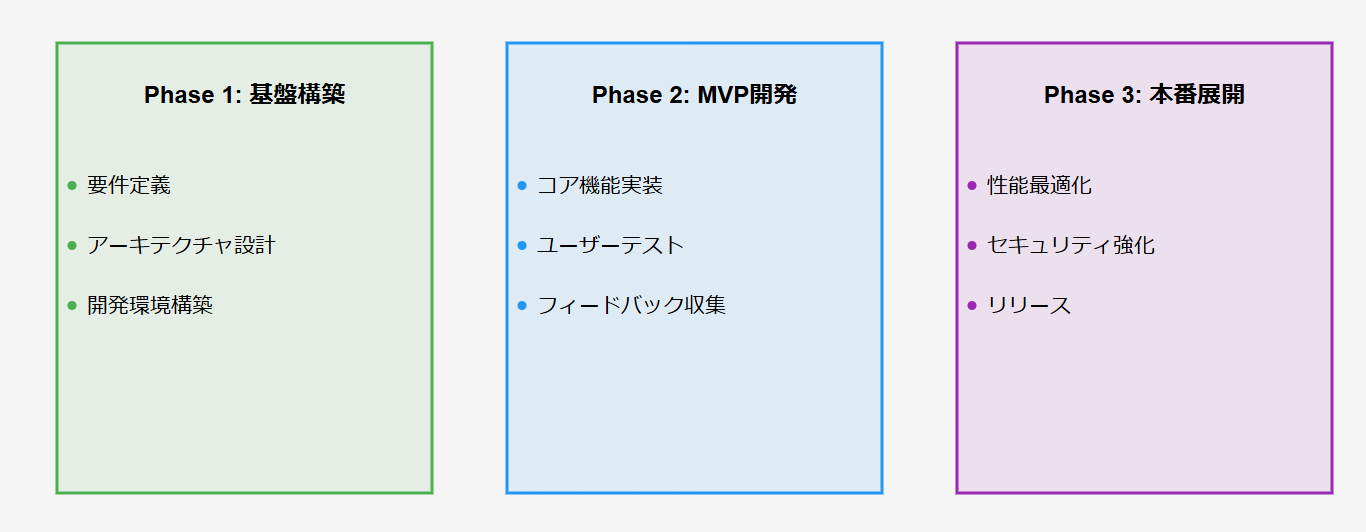
2. ロードマップの作成
ロードマップは、プロジェクトの大きな方向性と主要なマイルストーンを示す図です。
def create_roadmap():
    dwg = svgwrite.Drawing('roadmap.svg', size=('1000px', '500px'))

    # 背景
    dwg.add(dwg.rect(insert=(0, 0), size=('100%', '100%'),
                     fill='#f5f5f5'))

    # フェーズの定義
    phases = [
        {
            'title': 'Phase 1: 基盤構築',
            'items': ['要件定義', 'アーキテクチャ設計', '開発環境構築'],
            'start_x': 100,
            'color': '#4CAF50'
        },
        {
            'title': 'Phase 2: MVP開発',
            'items': ['コア機能実装', 'ユーザーテスト', 'フィードバック収集'],
            'start_x': 400,
            'color': '#2196F3'
        },
        {
            'title': 'Phase 3: 本番展開',
            'items': ['性能最適化', 'セキュリティ強化', 'リリース'],
            'start_x': 700,
            'color': '#9C27B0'
        }
    ]

    for phase in phases:
        # フェーズボックス
        dwg.add(dwg.rect(insert=(phase['start_x'], 100),
                        size=(250, 300),
                        fill=phase['color'],
                        fill_opacity=0.1,
                        stroke=phase['color'],
                        stroke_width=2))

        # フェーズタイトル
        dwg.add(dwg.text(phase['title'],
                        insert=(phase['start_x'] + 125, 140),
                        text_anchor='middle',
                        style="font-family: Arial; font-weight: bold; font-size: 16px"))

        # フェーズアイテム
        for i, item in enumerate(phase['items']):
            dwg.add(dwg.text(item,
                           insert=(phase['start_x'] + 20, 200 + i * 40),
                           style="font-family: Arial; font-size: 14px"))

            # チェックマーク
            dwg.add(dwg.circle(center=(phase['start_x'] + 10, 195 + i * 40),
                             r=3, fill=phase['color']))

    dwg.save()

create_roadmap()
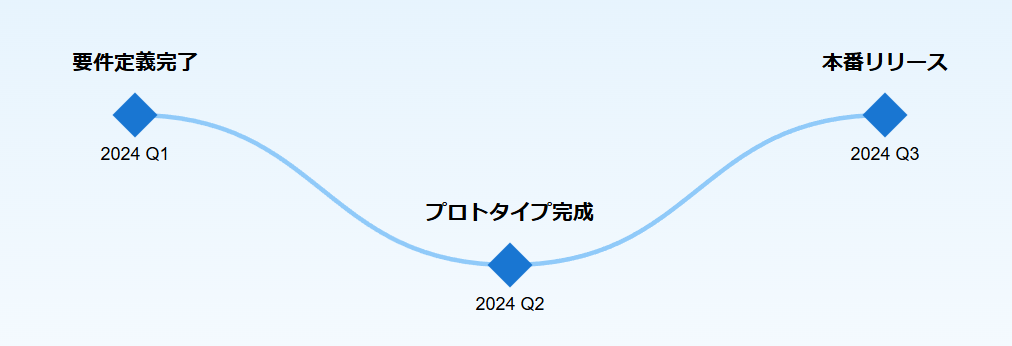
3. マイルストーン図の作成
マイルストーン図は、重要な達成ポイントを視覚的に表現します。
def create_milestone():
    dwg = svgwrite.Drawing('milestone.svg', size=('900px', '500px'))

    # 背景グラデーション
    gradient = dwg.defs.add(dwg.linearGradient(id="bg_grad",
                                              x1="0%", y1="0%",
                                              x2="0%", y2="100%"))
    gradient.add_stop_color(offset='0%', color='#E3F2FD', opacity=1)
    gradient.add_stop_color(offset='100%', color='white', opacity=1)

    # 背景適用
    dwg.add(dwg.rect(insert=(0, 0), size=('100%', '100%'),
                     fill="url(#bg_grad)"))

    # マイルストーンデータ
    milestones = [
        {'x': 150, 'y': 150, 'text': '要件定義完了', 'date': '2024 Q1'},
        {'x': 400, 'y': 250, 'text': 'プロトタイプ完成', 'date': '2024 Q2'},
        {'x': 650, 'y': 150, 'text': '本番リリース', 'date': '2024 Q3'},
    ]

    # 接続線
    for i in range(len(milestones)-1):
        dwg.add(dwg.path(d=f"M{milestones[i]['x']},{milestones[i]['y']} "
                          f"C{(milestones[i]['x']+milestones[i+1]['x'])/2},{milestones[i]['y']} "
                          f"{(milestones[i]['x']+milestones[i+1]['x'])/2},{milestones[i+1]['y']} "
                          f"{milestones[i+1]['x']},{milestones[i+1]['y']}",
                        stroke="#90CAF9",
                        stroke_width=3,
                        fill="none"))

    # マイルストーンの描画
    for ms in milestones:
        # マイルストーンシンボル
        dwg.add(dwg.polygon(points=[(ms['x']-15, ms['y']),
                                  (ms['x'], ms['y']-15),
                                  (ms['x']+15, ms['y']),
                                  (ms['x'], ms['y']+15)],
                           fill="#1976D2"))

        # テキスト
        dwg.add(dwg.text(ms['text'],
                        insert=(ms['x'], ms['y']-30),
                        text_anchor='middle',
                        style="font-family: Arial; font-size: 14px; font-weight: bold"))

        # 日付
        dwg.add(dwg.text(ms['date'],
                        insert=(ms['x'], ms['y']+30),
                        text_anchor='middle',
                        style="font-family: Arial; font-size: 12px"))

    dwg.save()

create_milestone()
4. ガントチャートの作成
ガントチャートは、プロジェクトのタスクスケジュールを視覚的に表現します。
def create_gantt():
    dwg = svgwrite.Drawing('gantt.svg', size=('1000px', '600px'))

    # 背景
    dwg.add(dwg.rect(insert=(0, 0), size=('100%', '100%'),
                     fill='white'))

    # タスクデータ
    tasks = [
        {'name': '要件定義', 'start': 0, 'duration': 4, 'progress': 100},
        {'name': 'DB設計', 'start': 3, 'duration': 3, 'progress': 80},
        {'name': 'UI/UX設計', 'start': 4, 'duration': 4, 'progress': 60},
        {'name': 'バックエンド開発', 'start': 6, 'duration': 6, 'progress': 40},
        {'name': 'フロントエンド開発', 'start': 7, 'duration': 5, 'progress': 30},
        {'name': 'テスト', 'start': 11, 'duration': 3, 'progress': 0}
    ]

    # 定数
    left_margin = 150
    top_margin = 50
    cell_width = 50
    row_height = 40

    # グリッド線と月表示
    months = ['1月', '2月', '3月', '4月', '5月', '6月']
    for i, month in enumerate(months):
        # 月表示
        dwg.add(dwg.text(month,
                        insert=(left_margin + i * cell_width * 2, 30),
                        style="font-family: Arial; font-size: 12px"))

        # グリッド線
        dwg.add(dwg.line(start=(left_margin + i * cell_width * 2, top_margin),
                        end=(left_margin + i * cell_width * 2, top_margin + len(tasks) * row_height),
                        stroke='#E0E0E0',
                        stroke_width=1))

    # タスクバーの描画
    for i, task in enumerate(tasks):
        # タスク名
        dwg.add(dwg.text(task['name'],
                        insert=(10, top_margin + i * row_height + row_height/2),
                        style="font-family: Arial; font-size: 14px"))

        # タスクバー背景
        dwg.add(dwg.rect(insert=(left_margin + task['start'] * cell_width,
                                top_margin + i * row_height + row_height/4),
                        size=(task['duration'] * cell_width, row_height/2),
                        fill='#E3F2FD',
                        stroke='#2196F3',
                        stroke_width=1))

        # 進捗バー
        if task['progress'] > 0:
            dwg.add(dwg.rect(insert=(left_margin + task['start'] * cell_width,
                                    top_margin + i * row_height + row_height/4),
                            size=(task['duration'] * cell_width * task['progress']/100,
                                 row_height/2),
                            fill='#2196F3',
                            fill_opacity=0.7))

        # 進捗パーセント表示
        dwg.add(dwg.text(f"{task['progress']}%",
                        insert=(left_margin + (task['start'] + task['duration']) * cell_width + 10,
                               top_margin + i * row_height + row_height/2),
                        style="font-family: Arial; font-size: 12px"))

    dwg.save()

create_gantt()
まとめ
これらの図表は、プロジェクトの進捗や計画を視覚的に表現する強力なツールです。
SVGを使用することで:
- 高品質でスケーラブルな図表が作成可能
- カスタマイズ性が高い
- Web表示に最適
- 軽量
以上の実装を基に、自身のプロジェクトに合わせてカスタマイズしていただければと思います!


