はじめに
GUIアプリケーションで重い処理を行う際、メインスレッドがフリーズしないようにするには非同期処理が必要です。
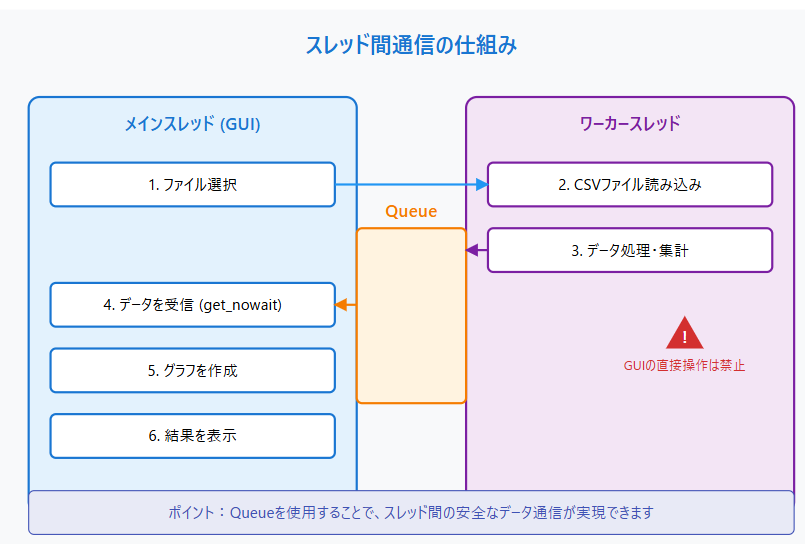
本記事では、Queueを使って安全にデータを受け渡す方法を、実践的なCSVデータ可視化アプリケーションの実装を通じて解説します。
よくある問題点と解決策
問題1: UIのフリーズ
# 悪い例
def button_click():
    result = heavy_process()  # UIがフリーズ
    show_result(result)

# 良い例
def button_click():
    thread = threading.Thread(target=process_in_background)
    thread.start()

def process_in_background():
    result = heavy_process()
    result_queue.put(result)  # Queueで安全に結果を送信
問題2: スレッドからのGUI操作
# 悪い例
def background_thread():
    result = process_data()
    label.config(text=result)  # 危険!

# 良い例
def background_thread():
    result = process_data()
    queue.put(result)

def check_queue():  # メインスレッドで実行
    try:
        result = queue.get_nowait()
        label.config(text=result)  # 安全
    except Queue.Empty:
        pass
    root.after(100, check_queue)
サンプルアプリケーション
CSVデータを読み込んでグラフ表示するアプリケーションを実装してみましょう。
import tkinter as tk
from tkinter import ttk, filedialog
import threading
import queue
import pandas as pd
import matplotlib.pyplot as plt
from matplotlib.backends.backend_tkagg import FigureCanvasTkAgg

class DataProcessWindow:
    def __init__(self, master, file_path, result_queue):
        self.top = tk.Toplevel(master)
        self.top.title("データ処理中")
        self.top.geometry("300x150")

        self.file_path = file_path
        self.result_queue = result_queue

        self.progress = ttk.Progressbar(
            self.top,
            mode='indeterminate',
            length=200
        )
        self.progress.pack(pady=20)
        self.progress.start()

        # 処理スレッドの開始
        self.thread = threading.Thread(target=self.process_data)
        self.thread.daemon = True
        self.thread.start()

    def create_figures(self, data):
        """メインスレッドでグラフを作成(重要)"""
        fig, ax = plt.subplots(figsize=(10, 6))
        data.plot(kind='bar', ax=ax)
        plt.tight_layout()
        return fig

    def process_data(self):
        try:
            # CSVファイルの読み込みと処理
            df = pd.read_csv(self.file_path)
            monthly_sum = df.groupby('month')['value'].sum()

            # 集計結果をキューに送信
            self.result_queue.put(('data', monthly_sum))

        except Exception as e:
            self.result_queue.put(('error', str(e)))
        finally:
            self.result_queue.put(('close_window', None))

class MainWindow:
    def __init__(self):
        self.root = tk.Tk()
        self.root.title("データ分析")
        self.root.geometry("400x300")

        self.file_button = ttk.Button(
            self.root,
            text="ファイルを選択",
            command=self.select_file
        )
        self.file_button.pack(pady=20)

        self.result_queue = queue.Queue()
        self.check_queue()

    def select_file(self):
        file_path = filedialog.askopenfilename(
            filetypes=[("CSV files", "*.csv")]
        )
        if file_path:
            self.file_button.config(state='disabled')
            self.process_window = DataProcessWindow(
                self.root, file_path, self.result_queue
            )

    def check_queue(self):
        try:
            while True:
                status, data = self.result_queue.get_nowait()

                if status == 'data':
                    # メインスレッドでグラフを作成
                    fig = self.process_window.create_figures(data)
                    self.show_result(fig)
                    self.file_button.config(state='normal')
                elif status == 'close_window':
                    if self.process_window:
                        self.process_window.top.destroy()

        except queue.Empty:
            pass
        finally:
            self.root.after(100, self.check_queue)

    def show_result(self, figure):
        window = tk.Toplevel(self.root)
        window.title("分析結果")
        window.geometry("800x600")

        canvas = FigureCanvasTkAgg(figure, master=window)
        canvas.draw()
        canvas.get_tk_widget().pack(fill=tk.BOTH, expand=True)

        # マウスイベントによるエラーを回避
        canvas.mpl_connect('motion_notify_event', lambda event: None)

    def run(self):
        self.root.mainloop()

if __name__ == "__main__":
    app = MainWindow()
    app.run()
動作確認用のサンプルデータ
以下の内容をsample_data.csvとして保存してください:
month,value,category
2023-01,1250000,A
2023-02,1380000,A
2023-03,1420000,A
2023-04,1580000,A
2023-05,1680000,A
2023-06,1720000,A
動作例
ファイル選択を押下するとファイルダイアログが開く。
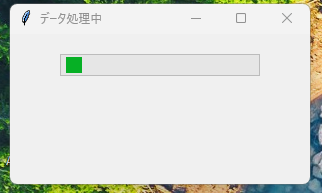
入力するCSVをファイルを選択すると、読み込みのプログレスバーが表示される。

読み込みが完了すると分析結果のグラフがの画面が出力される。
実装のポイント
-
スレッド間通信は必ずQueueを使用
- バックグラウンドスレッドからGUIを直接操作しない
- データやステータスはすべてQueueを介して送受信
-
Matplotlibの操作はメインスレッドで
- グラフの作成や更新は必ずメインスレッドで行う
- バックグラウンドスレッドではデータ処理のみを実施
-
例外処理を忘れずに
- バックグラウンドスレッドでの例外はキューで通知
- メインスレッドで適切にエラーハンドリング
まとめ
-
Queueを使用することで、スレッド間の安全なデータ通信が実現できます - GUIの操作は必ずメインスレッドで行うことで、予期せぬエラーを防げます
- 適切な非同期処理により、レスポンシブなGUIアプリケーションが実装できます


