はじめに
コンピュータのリソース使用状況をリアルタイムで可視化する、オリジナルのシステムモニターを作ってみませんか?この記事では、Pythonを使ってデスクトップアプリケーションとして動作する、美しいシステムモニターを実装していきます。
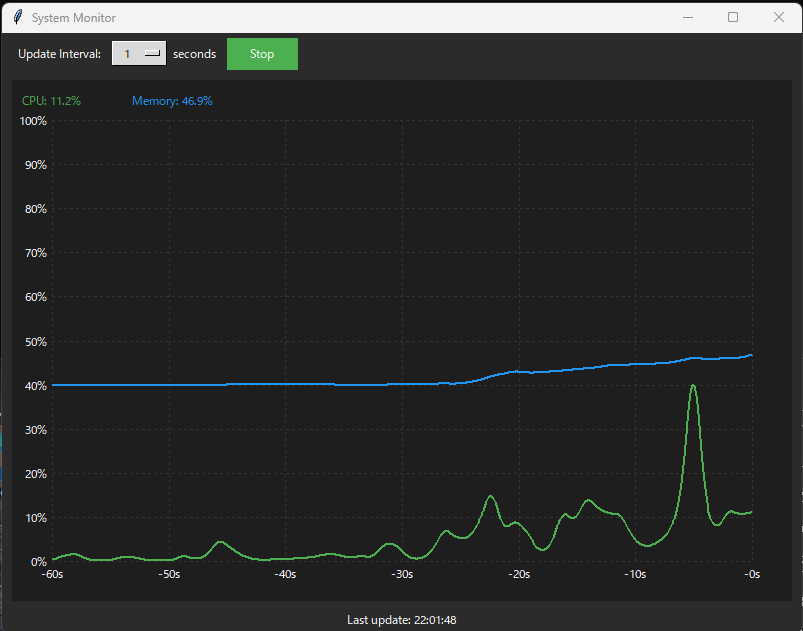
完成イメージ
- CPU・メモリ使用率をリアルタイムでグラフ表示
- ダークモードのモダンなUI
- 更新間隔のカスタマイズ機能
- 開始/停止機能付き
使用する技術とライブラリ
- tkinter: PythonのGUIライブラリ
- psutil: システム情報取得ライブラリ
- datetime: 時刻表示用
- math: 計算処理用
実装のポイント
1. モダンなUIデザイン
- ダークモードをベースにした配色
- フラットデザインのボタン
- 適切な余白とパディング
- 洗練されたグリッドライン
2. スマートなデータ管理
- 直近60秒分のデータのみを保持し、メモリ使用を最適化
- 例外処理によるロバストな実装
- 柔軟な更新間隔の設定
3. 美しいグラフ描画
- スムージング効果による滑らかな線
- 適切なパディングとスケーリング
- 動的なキャンバスサイズ対応
- グリッドラインによる視認性向上
実装コード
import tkinter as tk
from tkinter import ttk
import psutil
import time
from datetime import datetime
import math

class SystemMonitor:
    def __init__(self, root):
        self.root = root
        self.root.title("System Monitor")
        self.root.geometry("800x600")
        self.root.configure(bg='#2b2b2b')

        # スタイル設定
        style = ttk.Style()
        style.theme_use('default')
        style.configure('TButton',
                       padding=6,
                       relief="flat",
                       background="#4CAF50",
                       foreground="white")
        style.configure('TLabel',
                       background='#2b2b2b',
                       foreground='white')

        # コントロールフレーム
        control_frame = tk.Frame(root, bg='#2b2b2b')
        control_frame.pack(fill='x', padx=10, pady=5)

        # 更新間隔の設定
        ttk.Label(control_frame,
                 text="Update Interval:",
                 style='TLabel').pack(side='left', padx=5)

        self.interval_var = tk.StringVar(value='1')
        interval_menu = ttk.OptionMenu(control_frame,
                                     self.interval_var,
                                     '1',
                                     '1', '2', '5', '10',
                                     command=self.change_interval)
        interval_menu.pack(side='left', padx=5)

        ttk.Label(control_frame,
                 text="seconds",
                 style='TLabel').pack(side='left')

        # 開始/停止ボタン
        self.running = True
        self.toggle_button = ttk.Button(control_frame,
                                      text="Stop",
                                      command=self.toggle_update)
        self.toggle_button.pack(side='left', padx=10)

        # グラフキャンバス
        self.canvas = tk.Canvas(root,
                              bg='#1E1E1E',
                              width=750,
                              height=500,
                              highlightthickness=0)
        self.canvas.pack(padx=10, pady=5, fill='both', expand=True)

        # ステータスバー
        self.status_var = tk.StringVar()
        status_label = ttk.Label(root,
                               textvariable=self.status_var,
                               style='TLabel')
        status_label.pack(pady=5)

        # データ初期化
        self.cpu_history = []
        self.memory_history = []
        self.max_points = 60  # 60秒分のデータを保持

        # 初回更新
        self.update_data()

    def update_data(self):
        """データの更新とグラフの描画"""
        if not self.running:
            return

        try:
            # データ収集
            cpu_percent = psutil.cpu_percent()
            memory_percent = psutil.virtual_memory().percent

            # 履歴の更新
            self.cpu_history.append(cpu_percent)
            self.memory_history.append(memory_percent)

            # 履歴を制限
            if len(self.cpu_history) > self.max_points:
                self.cpu_history.pop(0)
                self.memory_history.pop(0)

            # グラフの描画
            self.draw_graph()

            # ステータスの更新
            self.status_var.set(f"Last update: {datetime.now().strftime('%H:%M:%S')}")

            # 次の更新をスケジュール
            interval = int(self.interval_var.get()) * 1000
            self.root.after(interval, self.update_data)

        except Exception as e:
            self.status_var.set(f"Error: {str(e)}")
            self.root.after(1000, self.update_data)

    def draw_graph(self):
        """グラフの描画"""
        self.canvas.delete('all')  # キャンバスをクリア

        # キャンバスのサイズ取得
        width = self.canvas.winfo_width()
        height = self.canvas.winfo_height()
        padding = 40

        # グリッドの描画
        self.draw_grid(width, height, padding)

        # データが存在する場合のみグラフを描画
        if self.cpu_history:
            # CPU使用率のライン
            self.draw_line(self.cpu_history, '#4CAF50', width, height, padding)
            # メモリ使用率のライン
            self.draw_line(self.memory_history, '#2196F3', width, height, padding)

        # 現在値の表示
        current_cpu = self.cpu_history[-1] if self.cpu_history else 0
        current_memory = self.memory_history[-1] if self.memory_history else 0

        self.canvas.create_text(10, 20,
                              text=f"CPU: {current_cpu:.1f}%",
                              fill='#4CAF50',
                              anchor='w')
        self.canvas.create_text(120, 20,
                              text=f"Memory: {current_memory:.1f}%",
                              fill='#2196F3',
                              anchor='w')

    def draw_grid(self, width, height, padding):
        """グリッドの描画"""
        # Y軸の目盛りと数値
        for i in range(11):  # 0%から100%まで10%刻み
            y = padding + (height - 2 * padding) * (10 - i) / 10
            # グリッド線
            self.canvas.create_line(padding, y,
                                  width-padding, y,
                                  fill='#333333',
                                  dash=(2, 4))
            # Y軸の数値
            self.canvas.create_text(padding - 5, y,
                                  text=f"{i * 10}%",
                                  fill='white',
                                  anchor='e')

        # X軸の目盛りと数値(60秒を6分割)
        for i in range(7):  # 0秒から60秒まで10秒刻み
            x = padding + (width - 2 * padding) * i / 6
            # グリッド線
            self.canvas.create_line(x, padding,
                                  x, height-padding,
                                  fill='#333333',
                                  dash=(2, 4))
            # X軸の数値
            self.canvas.create_text(x, height-padding+5,
                                  text=f"-{60-i*10}s",
                                  fill='white',
                                  anchor='n')

    def draw_line(self, data, color, width, height, padding):
        """データラインの描画"""
        if not data:
            return

        points = []
        chart_width = width - 2 * padding
        chart_height = height - 2 * padding

        x_step = chart_width / (len(data) - 1) if len(data) > 1 else 0

        for i, value in enumerate(data):
            x = padding + (i * x_step)
            y = height - padding - (value / 100 * chart_height)
            points.extend([x, y])

        if len(points) >= 4:
            self.canvas.create_line(points,
                                  fill=color,
                                  width=2,
                                  smooth=True)

    def change_interval(self, _):
        """更新間隔の変更"""
        if self.running:
            self.toggle_update()  # 一旦停止
            self.toggle_update()  # 新しい間隔で再開

    def toggle_update(self):
        """更新の開始/停止"""
        self.running = not self.running
        if self.running:
            self.toggle_button.configure(text="Stop")
            self.update_data()
        else:
            self.toggle_button.configure(text="Start")

def main():
    root = tk.Tk()
    app = SystemMonitor(root)
    root.mainloop()

if __name__ == "__main__":
    main()
発展的な使い方
このベースコードを元に、以下のような機能拡張が可能です:
-
ディスクI/O監視の追加
- psutilのdisk_io_counters()を使用
- 読み書き速度のリアルタイム表示
-
ネットワーク使用率の可視化
- net_io_counters()によるネットワークトラフィック監視
- 送受信速度のグラフ表示
-
プロセス別の使用率表示
- Process()クラスを使用した詳細情報の取得
- リソースを多く使用するプロセスのランキング表示
-
アラート機能の実装
- 閾値を超えた場合の通知
- ログファイルへの記録
まとめ
Pythonを使用することで、実用的かつ見た目の良いシステムモニターを比較的少ないコードで実装できました。tkinterは一見古く感じるかもしれませんが、適切なスタイリングと設計によって、モダンなアプリケーションを作ることが可能です。
このコードをベースに、自分の用途に合わせたカスタマイズを加えていくことで、より実用的なツールへと発展させることができます。
補足:実行時の注意点
- psutilのインストールが必要です:
pip install psutil - Windows/Mac/Linuxのすべてのプラットフォームで動作します
- Python 3.6以上を推奨します

