はじめに
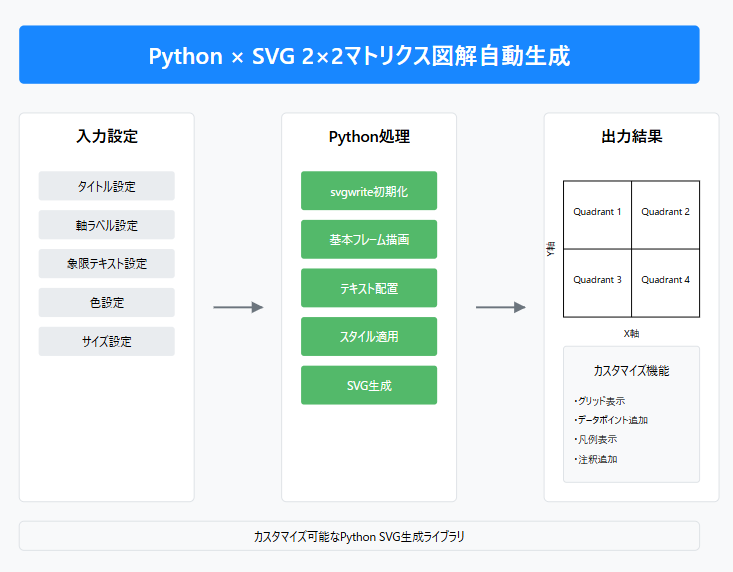
ビジネス戦略の議論で頻繁に使用される2×2マトリクスを、Pythonを使って自動生成する方法をご紹介します。
必要なライブラリのインストール
pip install svgwrite
基本的な実装
import svgwrite

def create_2x2_matrix(filename, title, x_label, y_label, quadrant_labels):
    # SVGの作成
    dwg = svgwrite.Drawing(filename, size=('800px', '600px'))

    # 背景色の設定
    dwg.add(dwg.rect((0, 0), ('800px', '600px'), fill='white'))

    # マトリクスの基本設定
    margin = 50
    width = 700
    height = 500

    # マトリクスの外枠を描画
    dwg.add(dwg.rect((margin, margin), (width, height),
                     fill='none', stroke='black', stroke_width=2))

    # 中央の十字線を描画
    mid_x = margin + width/2
    mid_y = margin + height/2
    dwg.add(dwg.line((mid_x, margin), (mid_x, margin + height),
                     stroke='black', stroke_width=1))
    dwg.add(dwg.line((margin, mid_y), (margin + width, mid_y),
                     stroke='black', stroke_width=1))

    # タイトルを追加
    dwg.add(dwg.text(title,
                     insert=(400, 30),
                     text_anchor="middle",
                     style="font-size:20px; font-weight:bold"))

    # 軸ラベルを追加
    dwg.add(dwg.text(x_label,
                     insert=(400, 580),
                     text_anchor="middle",
                     style="font-size:14px"))

    # Y軸ラベル(回転)
    y_label_group = dwg.g(transform="rotate(-90 20 300)")
    y_label_group.add(dwg.text(y_label,
                              insert=(20, 300),
                              text_anchor="middle",
                              style="font-size:14px"))
    dwg.add(y_label_group)

    # 象限のラベルを追加
    for position, label in quadrant_labels.items():
        x = margin + (width * 0.25 if 'left' in position else width * 0.75)
        y = margin + (height * 0.25 if 'bottom' in position else height * 0.75)
        dwg.add(dwg.text(label,
                        insert=(x, y),
                        text_anchor="middle",
                        style="font-size:16px"))

    # SVGを保存
    dwg.save()

# BCGマトリクスの生成
def create_bcg_matrix():
    quadrant_labels = {
        'top_right': '花形\n(Star)',
        'top_left': '問題児\n(Question Mark)',
        'bottom_right': '金のなる木\n(Cash Cow)',
        'bottom_left': '負け犬\n(Dog)'
    }

    create_2x2_matrix(
        'bcg_matrix.svg',
        'BCGマトリクス',
        '相対的市場シェア →',
        '市場成長率 →',
        quadrant_labels
    )

# SWOT分析の生成
def create_swot_matrix():
    quadrant_labels = {
        'top_right': 'Strengths\n(強み)',
        'top_left': 'Opportunities\n(機会)',
        'bottom_right': 'Weaknesses\n(弱み)',
        'bottom_left': 'Threats\n(脅威)'
    }

    create_2x2_matrix(
        'swot_matrix.svg',
        'SWOT分析',
        '内部要因 ← → 外部要因',
        'プラス要因 ← → マイナス要因',
        quadrant_labels
    )

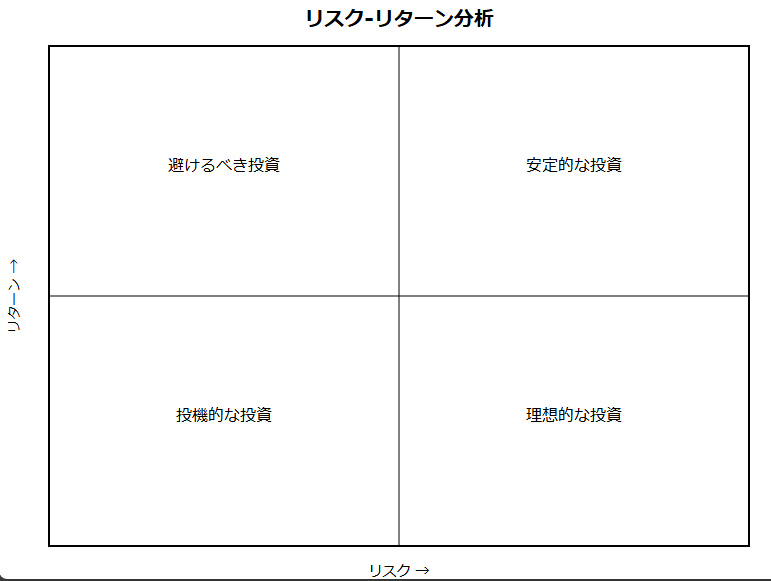
# リスク-リターン分析の生成
def create_risk_return_matrix():
    quadrant_labels = {
        'top_right': '理想的な投資',
        'top_left': '投機的な投資',
        'bottom_right': '安定的な投資',
        'bottom_left': '避けるべき投資'
    }

    create_2x2_matrix(
        'risk_return_matrix.svg',
        'リスク-リターン分析',
        'リスク →',
        'リターン →',
        quadrant_labels
    )

# 使用例
if __name__ == "__main__":
    # 各マトリクスを生成
    create_bcg_matrix()
    create_swot_matrix()
    create_risk_return_matrix()
実行結果の例
応用:カスタマイズ可能なバージョン
def create_custom_matrix(filename, config):
    """
    カスタマイズ可能な2×2マトリクス生成関数

    Parameters:
    -----------
    filename : str
        出力するSVGファイルの名前
    config : dict
        マトリクスの設定情報を含む辞書
        {
            'title': str,
            'x_label': str,
            'y_label': str,
            'quadrants': dict,
            'colors': dict (optional),
            'size': tuple (optional)
        }
    """
    # デフォルト値の設定
    default_config = {
        'size': ('800px', '600px'),
        'colors': {
            'background': 'white',
            'border': 'black',
            'text': 'black'
        }
    }

    # 設定をマージ
    config = {**default_config, **config}

    # SVGの作成
    dwg = svgwrite.Drawing(filename, size=config['size'])

    # 実装は基本バージョンと同様...(省略)

    return dwg

# 使用例
custom_config = {
    'title': 'カスタムマトリクス',
    'x_label': 'X軸 →',
    'y_label': 'Y軸 →',
    'quadrants': {
        'top_right': 'Quadrant 1',
        'top_left': 'Quadrant 2',
        'bottom_right': 'Quadrant 3',
        'bottom_left': 'Quadrant 4'
    },
    'colors': {
        'background': '#f0f0f0',
        'border': '#333333',
        'text': '#000000'
    },
    'size': ('1000px', '800px')
}

create_custom_matrix('custom_matrix.svg', custom_config)
実行結果の例
まとめ
このコードを使用することで、以下のようなことが可能です:
- 基本的な2×2マトリクスの自動生成
- タイトルや軸ラベルのカスタマイズ
- 象限内のテキスト配置
- サイズや色のカスタマイズ
発展的な使い方
- データの可視化との組み合わせ:
def add_data_points(dwg, points, margin, width, height):
    """
    マトリクス内にデータポイントを追加
    """
    for point in points:
        x = margin + (width * point['x'])
        y = margin + (height * (1 - point['y']))

        # ポイントを描画
        dwg.add(dwg.circle(center=(x, y), r=5,
                          fill=point.get('color', 'red')))

        # ラベルを追加
        if 'label' in point:
            dwg.add(dwg.text(point['label'],
                           insert=(x + 10, y),
                           style="font-size:12px"))
- アニメーションの追加:
def add_animation(dwg):
    """
    SVGにアニメーション効果を追加
    """
    style = """
        @keyframes fade {
            from { opacity: 0; }
            to { opacity: 1; }
        }
        .animated {
            animation: fade 2s;
        }
    """
    dwg.defs.add(dwg.style(style))
注意点
-
フォントの互換性:
- SVG内で使用するフォントは、表示環境によって異なる場合があります
- 重要な場合は、Web-safeフォントを使用するか、フォントを埋め込む必要があります
-
ファイルサイズ:
- 大量のデータポイントや複雑な図形を追加すると、ファイルサイズが大きくなる場合があります
- 必要に応じて最適化を検討してください
例: カレーの評価や分類のための2×2マトリクス
import svgwrite

def create_curry_matrix(filename):
    """カレーを評価するための2×2マトリクスを生成(改善版)"""

    # SVGの基本設定
    dwg = svgwrite.Drawing(filename, size=('800px', '600px'))
    dwg.add(dwg.rect((0, 0), ('800px', '600px'), fill='#FFF8E7'))

    # マトリクスの基本設定
    margin = 50
    width = 700
    height = 500

    # メインタイトル
    dwg.add(dwg.text('カレー分析マトリクス',
                     insert=(400, 40),
                     text_anchor="middle",
                     font_size=24,
                     font_weight="bold",
                     fill='#8B4513'))

    # サブタイトル
    dwg.add(dwg.text('価格帯と味の特徴による分類',
                     insert=(400, 70),
                     text_anchor="middle",
                     font_size=16,
                     fill='#A0522D'))

    # マトリクスの外枠
    dwg.add(dwg.rect((margin, margin + 50), (width, height),
                     fill='none',
                     stroke='#8B4513',
                     stroke_width=2))

    # 中央の十字線
    mid_x = margin + width/2
    mid_y = margin + height/2 + 50
    dwg.add(dwg.line((mid_x, margin + 50), (mid_x, margin + height + 50),
                     stroke='#8B4513',
                     stroke_width=1))
    dwg.add(dwg.line((margin, mid_y), (margin + width, mid_y),
                     stroke='#8B4513',
                     stroke_width=1))

    # 象限の特徴を定義
    quadrants = {
        'top_right': {
            'title': '贅沢スパイシー',
            'items': [
                'ハイエンドインド料理',
                '高級スパイス使用',
                '専門店の本格カレー',
                '¥1,500〜'
            ]
        },
        'top_left': {
            'title': '大衆派スパイシー',
            'items': [
                '大衆インド料理店',
                '普通のスパイスカレー',
                'エスニック系チェーン店',
                '¥800〜1,500'
            ]
        },
        'bottom_right': {
            'title': '贅沢まろやか',
            'items': [
                '高級欧風カレー',
                'ホテルカレー',
                'オリジナルブレンド',
                '¥1,500〜'
            ]
        },
        'bottom_left': {
            'title': '大衆派まろやか',
            'items': [
                'カレーチェーン店',
                'ファミレスカレー',
                '家庭的カレー',
                '〜¥800'
            ]
        }
    }

    def add_curry_icon(x, y, size=40):
        """改良版カレーアイコン"""
        # アイコンの背景(円)
        dwg.add(dwg.circle((x, y), size/2,
                          fill='#FFFFFF',
                          stroke='#8B4513',
                          stroke_width=1,
                          opacity=0.7))
        # お皿(楕円)
        dwg.add(dwg.ellipse((x, y), (size*0.8, size/3),
                           fill='#FFF',
                           stroke='#8B4513'))
        # カレー(楕円)
        dwg.add(dwg.ellipse((x, y-size/6), (size*0.7, size/4),
                           fill='#DAA520'))

    # 軸ラベル(外側に配置)
    dwg.add(dwg.text('価格帯 →',
                     insert=(400, margin + height + 90),
                     text_anchor="middle",
                     font_size=16,
                     fill='#8B4513'))

    # Y軸ラベル(回転、外側に配置)
    y_label_group = dwg.g(transform=f"rotate(-90 25 {300})")
    y_label_group.add(dwg.text('味の特徴(スパイシー度) →',
                              insert=(25, 300),
                              text_anchor="middle",
                              font_size=16,
                              fill='#8B4513'))
    dwg.add(y_label_group)

    # 象限の描画(レイアウト改善)
    positions = {
        'top_right': (3/4, 1/4),
        'top_left': (1/4, 1/4),
        'bottom_right': (3/4, 3/4),
        'bottom_left': (1/4, 3/4)
    }

    for position, content in quadrants.items():
        x_ratio, y_ratio = positions[position]
        x = margin + width * x_ratio
        y = margin + height * y_ratio + 50

        # アイコンを上部に配置
        add_curry_icon(x, y - 60)

        # タイトルをアイコンの下に配置
        dwg.add(dwg.text(content['title'],
                        insert=(x, y - 20),
                        text_anchor="middle",
                        font_size=16,
                        font_weight="bold",
                        fill='#8B4513'))

        # 特徴リストをさらに下に配置
        for i, item in enumerate(content['items']):
            dwg.add(dwg.text(item,
                           insert=(x, y + 10 + i * 20),
                           text_anchor="middle",
                           font_size=12,
                           fill='#A0522D'))

    # 凡例(下部に整理して配置)
    legend_items = [
        ('価格帯', [
            '〜¥800: リーズナブル',
            '¥800〜1,500: スタンダード',
            '¥1,500〜: プレミアム'
        ]),
        ('スパイシー度', [
            'まろやか: 日本人向け味付け',
            'スパイシー: 本格的スパイス使用'
        ])
    ]

    legend_y = margin + height + 120
    for i, (title, items) in enumerate(legend_items):
        x = margin + i * 350

        # 凡例タイトルの背景
        dwg.add(dwg.rect((x-5, legend_y-15), (120, 20),
                        fill='#FFFFFF',
                        stroke='#8B4513',
                        stroke_width=1,
                        opacity=0.7))

        # 凡例タイトル
        dwg.add(dwg.text(title,
                        insert=(x, legend_y),
                        font_size=14,
                        font_weight="bold",
                        fill='#8B4513'))

        # 凡例アイテム
        for j, item in enumerate(items):
            dwg.add(dwg.text(item,
                           insert=(x, legend_y + 20 + j * 20),
                           font_size=12,
                           fill='#A0522D'))

    # SVGを保存
    dwg.save()

# マトリクスを生成
create_curry_matrix('curry_matrix_improved.svg')


