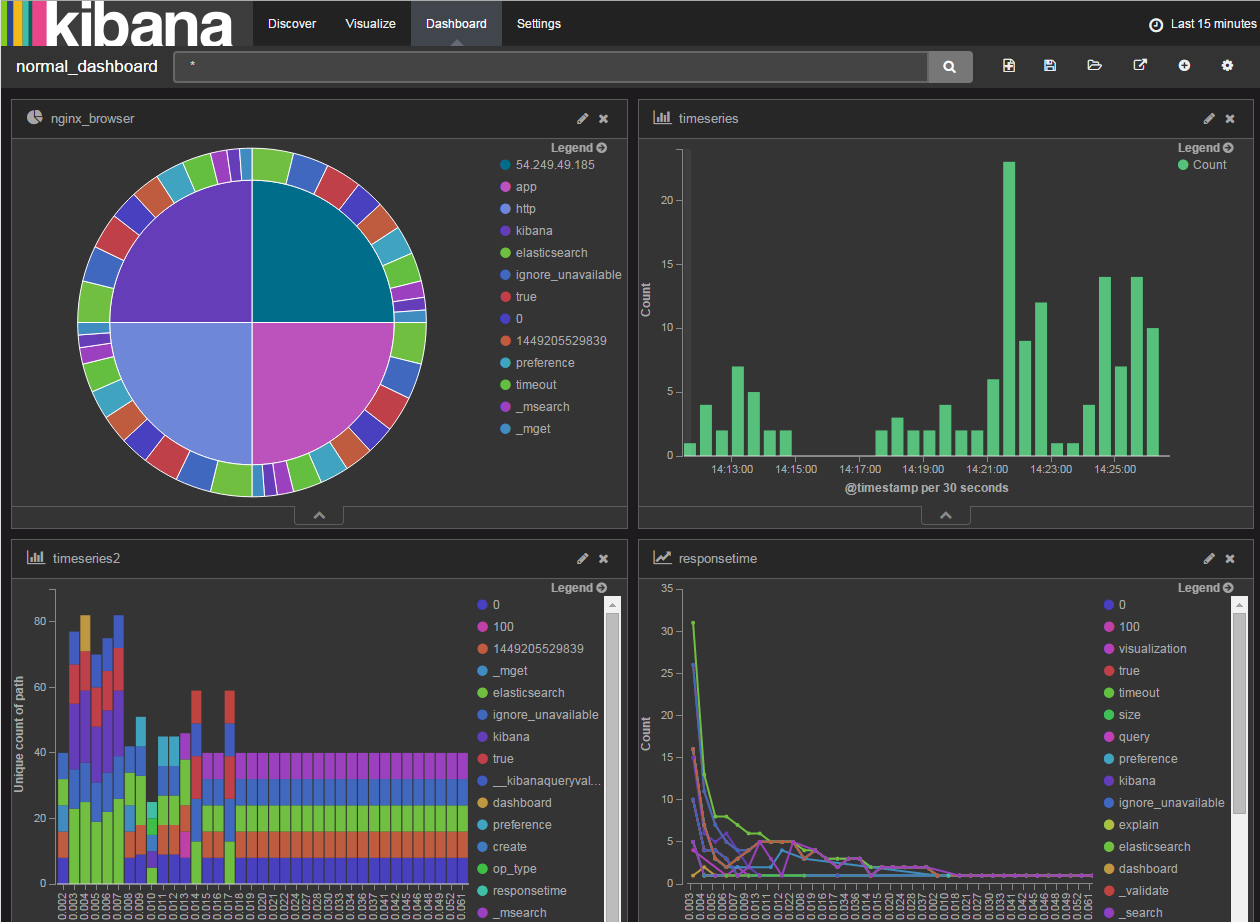
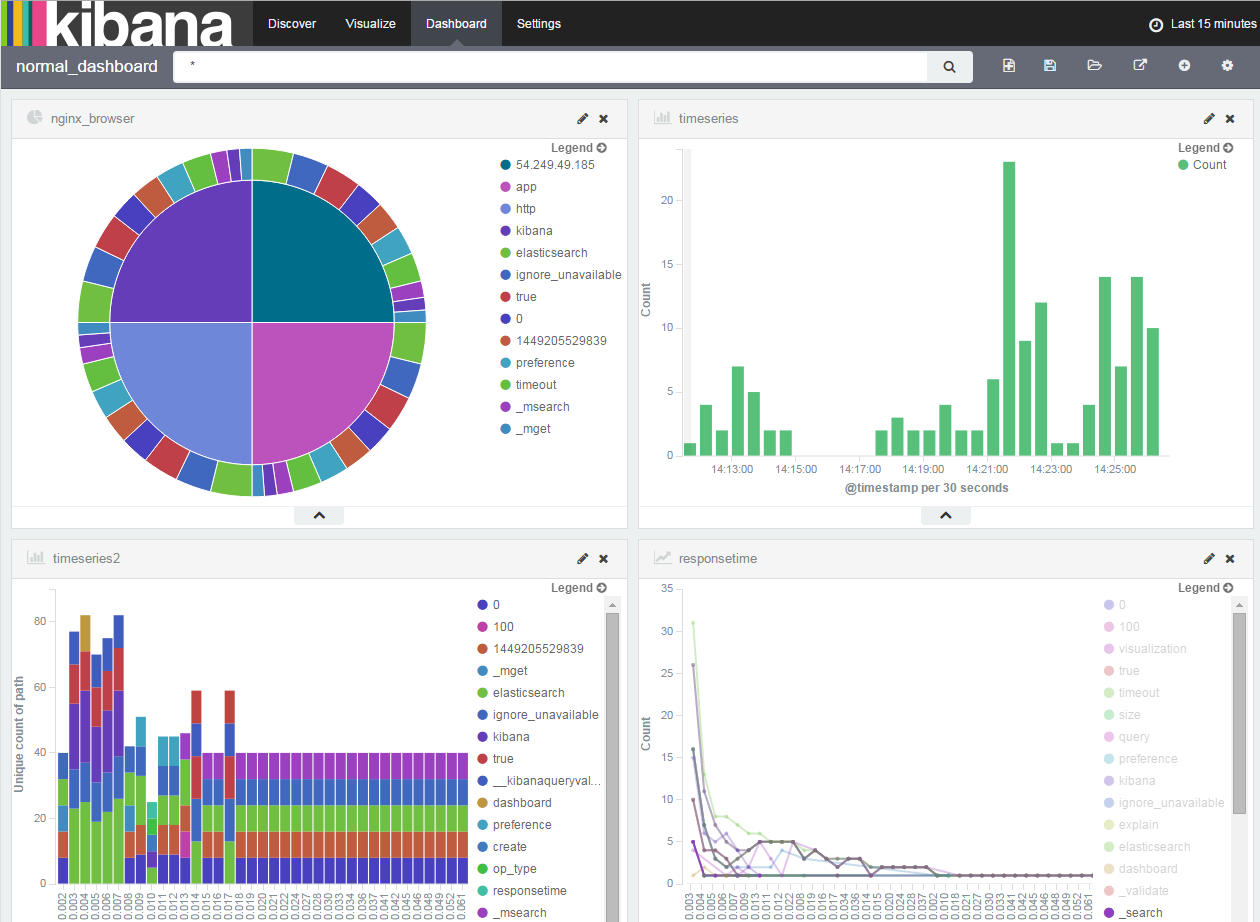
こんな感じの事ができるようになるためのツールについてご紹介。おお!なんかかっこいい!
具体的にどういうデータを見るの?
-
レスポンス要件が厳しい時に、要件を満たせていないPath(ロジック)を確認する事ができる。
黒画面の右下では、レスポンスタイムが遅い処理をURL別にグラフ化。本来は3秒以内に返さないといけない処理が10秒くらいかかっているので、対処することとなった。 -
外部からの攻撃・手法・時間・位置情報の確認。毎朝7時にめっちゃアクセスくる!!と思ったらクローラーが来ていた。
-
どのワードがどの地域でtwitterで呟かれているか確認し、マーケットに利用する。自社の味方になってくれている人を一覧化。バズったワードの発生タイミングや誰からスタートしたかとかも可視化。
何を可視化するか?
ログデータと言われているが、テキストにできるデータならなんでも可能。
OSS製品使っています。サポートを受けようと思えば受けれそうですが、経験はありません・・・
▼構成
twitter ---(streaming api)-> java batch --ログファイル---> fluentd ---> elasticsearch ---> kibana <--- nginx <---- browser(client)
ツイッターの情報を取得し、整形してログファイルに吐き出す。
fluentdではログファイルをtailし、elasticsearchに転送する。
クライアントからはKibanaを介してelasticsearchのデータを参照する。
▼インストール
sudo yum install nginx
#"$request_time" "$upstream_response_time"を追加することで、レスポンスタイムを正確に測定できます。
sudo vi /etc/nginx/nginx.conf
log_format  main  '$remote_addr - $remote_user [$time_local] "$request" '
                  '$status $body_bytes_sent "$http_referer" '
                  '"$http_user_agent" "$http_x_forwarded_for" "$request_time" "$upstream_response_time"';

    location / {
        proxy_pass http://localhost:5601/;
    }
編集が終わったら、sudo service nginx restartで再起動
そのほかインストールしていきます。
# elasticsearch
wget https://download.elasticsearch.org/elasticsearch/release/org/elasticsearch/distribution/rpm/elasticsearch/2.1.0/elasticsearch-2.1.0.rpm
sudo rpm -ivh elasticsearch-2.1.0.rpm
# kibana
wget https://download.elastic.co/kibana/kibana/kibana-4.3.0-linux-x64.tar.gz
tar zxf kibana-4.3.0-linux-x64.tar.gz
terminalを開いて次のcurlコマンドを実行
elasticsearchに勝手にサマリを作られないようにします。
curl -XDELETE localhost:9200/nginx*
curl -XDELETE localhost:9200/twitter*
curl -XPUT localhost:9200/_template/template_1 -d '
{
   "template" : "twitter.httpurl*",
   "mappings" : {
       "twitter.httpurl*": {
           "properties": {
                "url" : { "type" : "string", "index" : "not_analyzed" },
                "tag" : { "type" : "string", "index" : "not_analyzed" }
           }
       }
   }
}'

curl -XPUT localhost:9200/_template/template_2 -d '
{
   "template" : "twitter.kuromoji*",
   "mappings" : {
       "twitter.kuromoji*": {
           "properties": {
                "word" : { "type" : "string", "index" : "not_analyzed" }
           }
       }
   }
}'

curl -XPUT localhost:9200/_template/template_3 -d '
{
   "template" : "twitter.influence*",
   "mappings" : {
       "twitter.influence*": {
           "properties": {
                "user_id" : { "type" : "string", "index" : "not_analyzed" },
                "user_name" : { "type" : "string", "index" : "not_analyzed" },
                "user_location" : { "type" : "string", "index" : "not_analyzed" },
                "tweet_text" : { "type" : "string", "index" : "not_analyzed" }
           }
       }
   }
}'

curl -XPUT localhost:9200/_template/template_nginx -d '
{
   "template" : "nginx.access*",
   "mappings" : {
       "nginx.access*": {
           "properties": {
                "remote" : { "type" : "string", "index" : "not_analyzed" },
                "path" : { "type" : "string", "index" : "not_analyzed" },
                "referer" : { "type" : "string", "index" : "not_analyzed" },
                "method" : { "type" : "string", "index" : "not_analyzed" },
                "forwarder" : { "type" : "string", "index" : "not_analyzed" },
                "request_time" : { "type" : "long"},
                "size" : { "type" : "long"},
                "upstream_response_time" : { "type" : "long"},
                "agent" : { "type" : "string", "index" : "not_analyzed" }
           }
       }
   }
}'
elasticsearch自身が検索エンジンとなっているため、例えばURLが
http://hogehoge.com/aaa/bbb
となっていた場合、 "http://","hogehoge.com","aaa","bbb"に分割されて登録されてしまうので、それを解消するために上記を実施する。
# fluentd
curl -L https://toolbelt.treasuredata.com/sh/install-redhat-td-agent2.sh | sh
sudo /opt/td-agent/embedded/bin/fluent-gem install fluent-plugin-elasticsearch
sudo vi /etc/td-agent/td-agent.conf
<match nginx.access>
  type copy


  <store>
    type elasticsearch
    host localhost
    port 9200
    type_name @nginx_log
    include_tag_key true
    logstash_format true
    logstash_prefix nginx.access
    flush_interval 10s
  </store>
</match>


<match twitter.trend>
  type copy


  <store>
    type elasticsearch
    host localhost
    port 9200
    type_name @twitter.influence
    include_tag_key true
    logstash_format true
    logstash_prefix twitter.influence
    flush_interval 10s
  </store>
</match>


<match twitter.kuromoji>
  type copy


  <store>
    type elasticsearch
    host localhost
    port 9200
    type_name @twitter.kuromoji
    include_tag_key true
    logstash_format true
    logstash_prefix twitter.kuromoji
    flush_interval 10s
  </store>
</match>


<match twitter.httpurl>
  type copy


  <store>
    type elasticsearch
    host localhost
    port 9200
    type_name @twitter.httpurl
    include_tag_key true
    logstash_format true
    logstash_prefix twitter.httpurl
    flush_interval 10s
  </store>
</match>


<match debug.**>
  type stdout
</match>


<source>
  type forward
</source>


<source>
  type tail
  format /^(?<remote>[^ ]*) (?<host>[^ ]*) (?<user>[^ ]*) \[(?<time>[^\]]*)\] "(?<method>\S+)(?: +(?<path>[^ ]*) +\S*)?" (?<code>[^ ]*) (?<size>[^ ]*)(?: "(?<referer>[^\"]*)" "(?<agent>[^\"]*)" "(?<forwarder>[^\"]*)" "(?<request_time>[^\"]*)" "(?<upstream_response_time>[^\"]*)")?/
  time_format %d/%b/%Y:%H:%M:%S %z
  types request_time:long,upstream_response_time:long,size:long
  path /var/log/nginx/access.log
  pos_file /var/log/td-agent/nginx-access.pos
  tag nginx.access
</source>
<source>
  type tail
  format /^\[(?<time>[^\]]*)\](?<user_name>.*)(!?;\(userName=)(?<user_id>.*)(!?/userLocation=)(?<user_location>.*)\) : (?<tweet_text>.*)(!?; followersCount=)(?<follwers_count>.*)/
  types follwers_count:integer
  time_format %Y-%m-%d %H:%M:%S
  path /home/ec2-user/logs/influence.log
  pos_file /var/log/td-agent/twitter-trend.pos
  tag twitter.trend
</source>


<source>
  type tail
  format /(?<word>.*)/
  path /home/ec2-user/logs/kuromoji.log
  pos_file /var/log/td-agent/kuromoji.pos
  tag twitter.kuromoji
</source>


<source>
  type tail
  format /(?<url>.*)/
  path /home/ec2-user/logs/httpurl.log
  pos_file /var/log/td-agent/httpurl.pos
  tag twitter.httpurl
</source>
サービス起動: sudo service td-agent start
ソースコード(2015/12/07 時点):https://github.com/n01boy/twitter-trend-searcher
ビルドは "gradle fatJar"コマンドで行う。
生成されたJarファイル: twitter-trend.jar
生成されたtwitter-trend.jarを操作する。 twitter-trend.jarと同じディレクトリに配置:userdict.txt
※JDK1.8にしておく必要があります。ご注意ください。
java -Dtwitter.keywords="検索したいキーワードをカンマ区切りで列挙" -Dtwitter4j.oauth.consumerKey="kaiBWJcoFbfEIFNn7v3pqF***" -Dtwitter4j.oauth.consumerSecret="2d8v1Co2LXmDZOPbpih2NbmdaKJTnFcakhKwr3keBickg3***" -Dtwitter4j.oauth.accessToken="144549526-LLXKbSu1jHNlvc83TNHYMvNt8X8PfVJBRLU9***" -Dtwitter4j.oauth.accessTokenSecret="gAiHbwwJVf52sIsSCqbALSw3zUWGH3yo20wScY2p***" -jar twitter-trend.jar
正常動作を確認できたら、Ctrl+Cでストップ
./logs/influence.logにデータが書き込まれる。これをfluentdが吸い上げている。
▼デーモン化
twitter-trend.sh
# !/bin/sh
export LANG=ja_JP.UTF-8
java -Dtwitter.keywords="検索したいキーワードをカンマ区切りで列挙" -Dtwitter4j.oauth.consumerKey="kaiBWJcoFbfEIFNn********" -Dtwitter4j.oauth.consumerSecret="2d8v1Co2LXmDZOPbpih2NbmdaKJTnFcakhKwr3keB********" -Dtwitter4j.oauth.accessToken="144549526-LLXKbSu1jHNlvc83TNHYMvNt8X8PfVJ********" -Dtwitter4j.oauth.accessTokenSecret="gAiHbwwJVf52sIsSCqbALSw3zUWGH3yo20w********" -jar twitter-trend.jar
chmod +x twitter-trend.sh
sudo vi /etc/init/twitter-trend.conf
description "twitter-trend"
author  "Nakam <nakam@hogehoge.com>"
start on runlevel [2345]
stop on runlevel [016]
chdir /home/centos
exec /home/centos/twitter-trend.sh
respawn
sudo initctl start twitter-trend
sudo vi /etc/init/kibana.conf
description "kibana"
author  "Nakam <nakam@hogehoge.com>"
start on runlevel [2345]
stop on runlevel [016]
chdir /opt/kibana/bin/
exec /opt/kibana/bin/kibana
respawn
sudo initctl start kibana
sudo vi /etc/init/td-agent.conf
description "td-agent"
author  "Nakam <nakam@hogehoge.com>"
start on runlevel [2345]
stop on runlevel [016]
chdir /opt/td-agent/embedded/bin
exec /opt/td-agent/embedded/bin/ruby /usr/sbin/td-agent
respawn
sudo initctl start td-agent
-Dtwitter.keywords="ラブライブ,ラブライバ,μ's,ミューズ,音ノ木坂,高坂 穂乃果,絢瀬 絵里,南 ことり,園田 海未,星空 凛,西木野 真姫,東條 希,小泉 花陽,矢澤 にこ,にっこにっこにー"
とかにしておけば、
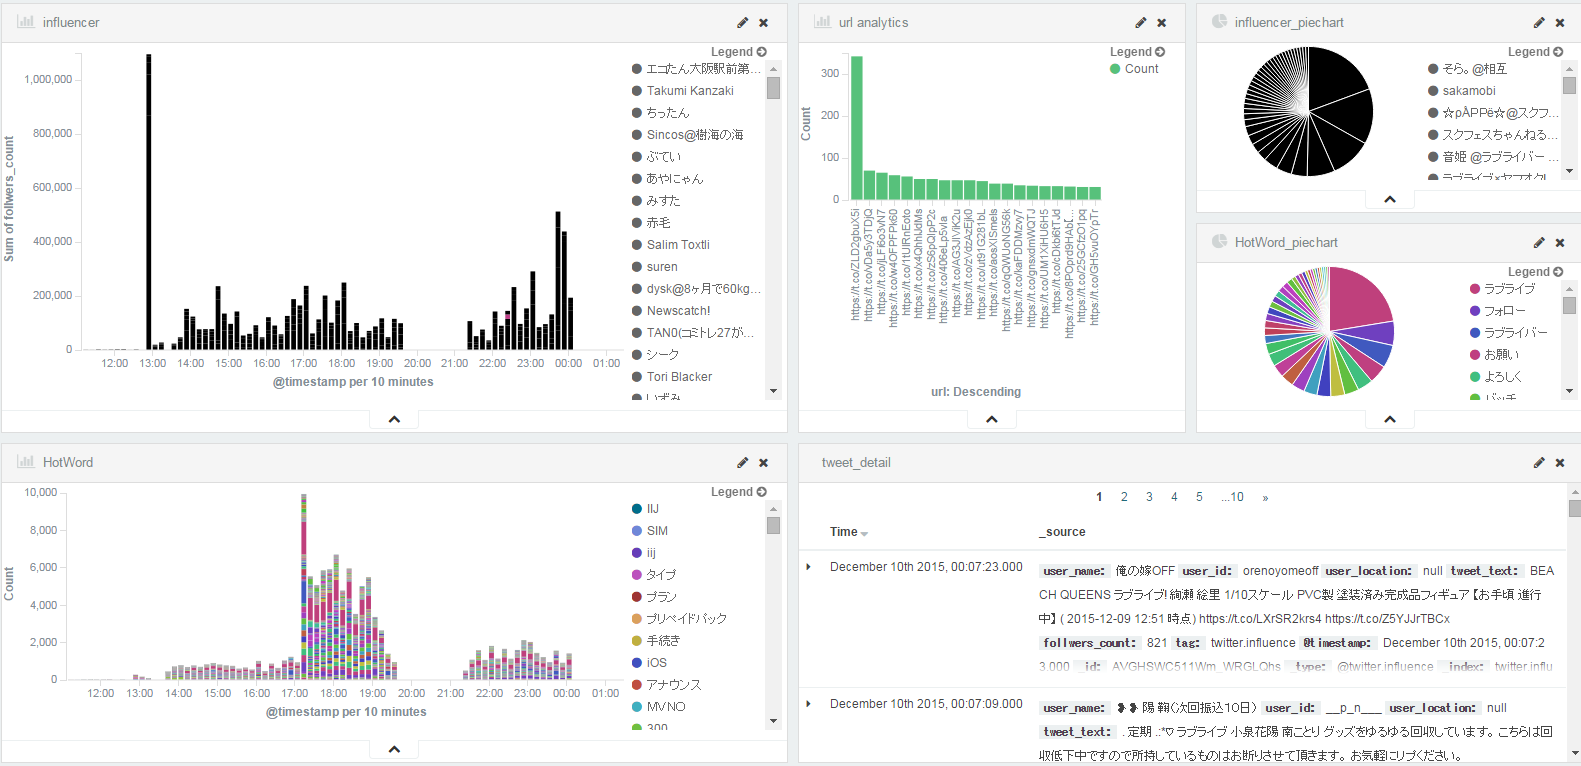
左上はフォロワーの数に比例して縦軸が伸びます。
左下はワードカウントで、何かがバズった時に一気に伸びます。
右の棒グラフは、呟きの中に入っているURLのランキングです。今話題になっているURLが集計できます。
一番右上の円グラフはインフルエンサーのランキング。
その下はホットワード。
上記のグラフで細分化して見たい時用に、右下に生データを表示しています。
自分の会社名をキーワードにしておいて、自社の評判とか、こうして欲しいという要望を集めるためのツールとして利用できると思います。
また、自分が気になるワードを登録しておけば、ニュース等を集めてこれると思います。
■クラスタリング
※また次回・・・