Introduction
I would like to demonstrate how we can create a webmap with MapLibre GL JS. The main target of this text is for the beginners.
This document will explain:
- How we create a simple 2D webmap with MapLibre GL JS from existing vector tile and style
- How we exmapnd 2D map to a terrain 3D map with existing RGB elevation tiles.
but it will not explain:
- How we create vector tiles
- Howe we develop RGB raster tiles
- How we develop map styles
- How we prepare text fonts (glyphs) or map symbols (sprite)
For the issues I do not explain here, I have another materials, so please feel free to visit my GitHub repository or my speaker deck.
Note added on 2022-09-22
We have YouTube movie for this hands-on.
Environment
My working environment is as follows:
- Windows 10 Enterprise
- Windows PowerShell
- Page hosting via GitHub page
Procedure
Step 1: Making a GitHub repository
Create a repository for this practice. I have created a repository here:
https://github.com/ubukawa/practice-bm
Then, let's create a "docs" directory to store the files for web hosting, and move there.
mkdir docs
cd docs
Step 2: Getting the latest MapLibre GL JS
Let's check the latest version of MapLibre GL JS here https://github.com/maplibre/maplibre-gl-js. As of the 13th September 2022, the latest version is 2.4.0. Then, get these files from unpkg.org with the following command in the PowerShell. Let's also get the license text from maplibre.
mkdir maplibre-gl@2.4.0
cd maplibre-gl@2.4.0
curl.exe -O https://unpkg.com/maplibre-gl@2.4.0/dist/maplibre-gl.js
curl.exe -O https://unpkg.com/maplibre-gl@2.4.0/dist/maplibre-gl.js.map
curl.exe -O https://unpkg.com/maplibre-gl@2.4.0/dist/maplibre-gl.css
curl.exe -O https://raw.githubusercontent.com/maplibre/maplibre-gl-js/main/LICENSE.txt
cd ..
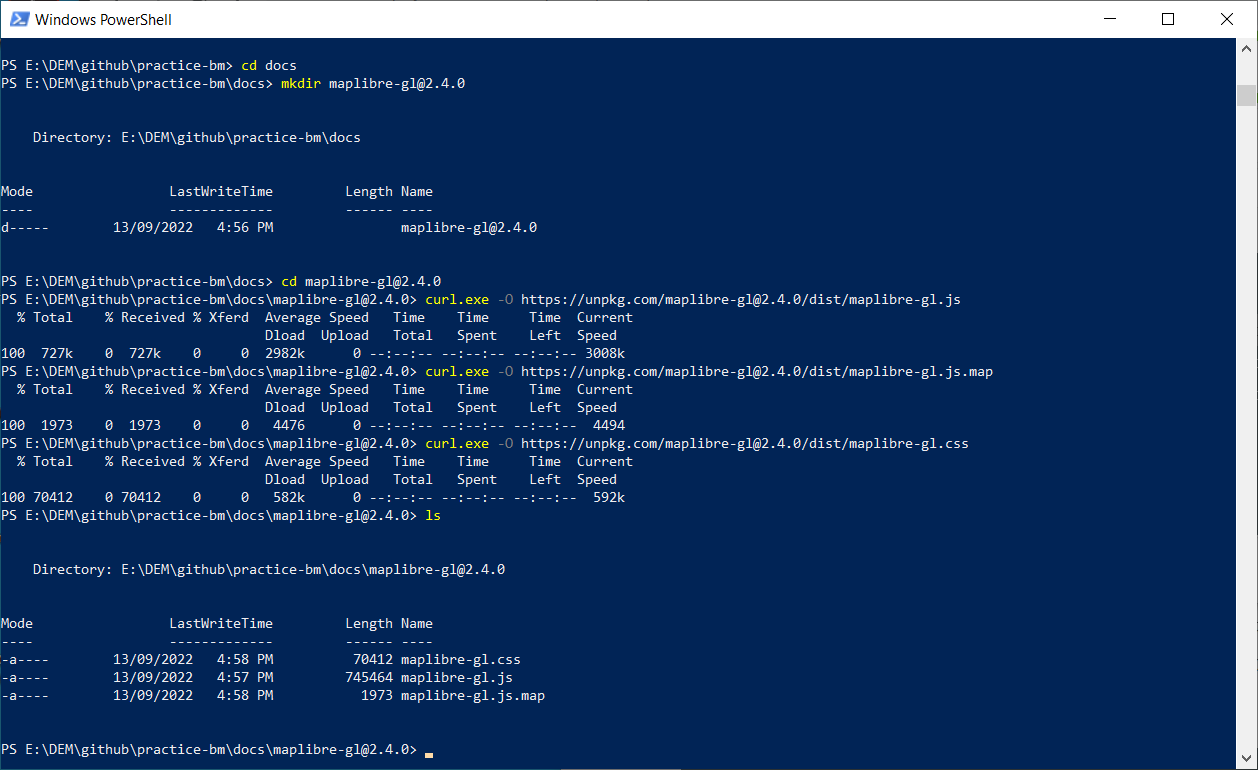
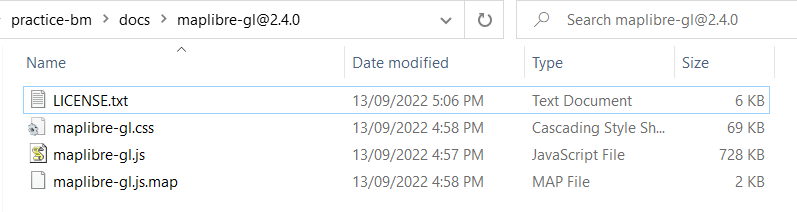
You will have files as below.
Step 2: Consider map styles
If you are getting familiar with the MapLibre/Mapbox webmaps, you can freely design map style by writing style.json (or json file with any other name) following the MapLibre/Mapbox style specification.
- https://maplibre.org/maplibre-gl-js-docs/style-spec/
- https://docs.mapbox.com/mapbox-gl-js/style-spec/
A style json generally has rich information on the map styling, I mean style layers information. In addition, I think it is important to understand that a tyle json has information on:
- data source (vector, raster, WMS, etc..),
- map symbol (sprite),
- text font (glyphs),
- and others
This time, let's use existing style file (json format) for easy understanding. From my past practice, I have three different styles as below.
- Small scale vector tile map from NaturalEarth
- Vector tile map from OSM with SRTM DEM at around New York City
- Vector tile map from OSM (without DEM)
Step 3: Preparing html file
Now, we have 1) a map library, that is MapLibre GL JS, and 2) style information that is confirmed at the previous step. So, let's make a html file to draw a webmap.
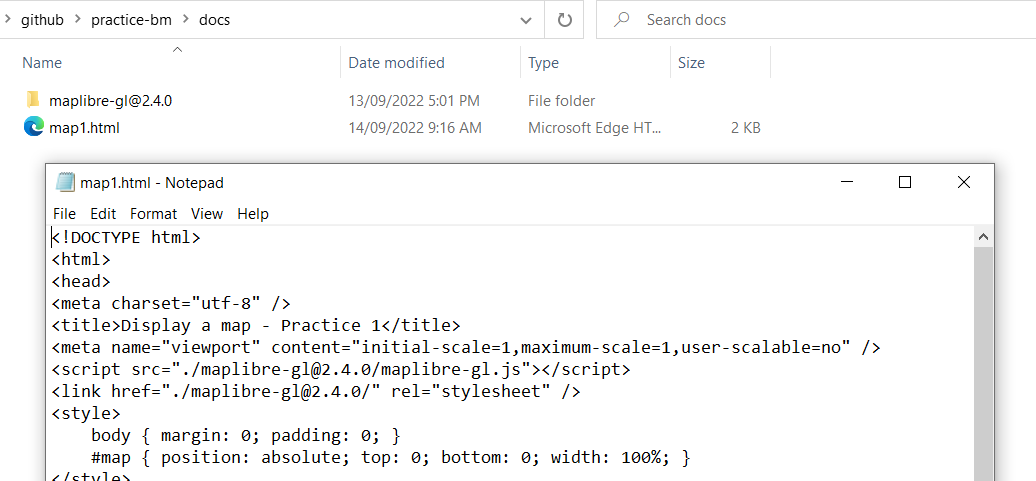
Under the "docs" directory, where is the root of the GitHub page, let's create a "map1.html" as below.
<!DOCTYPE html>
<html>
<head>
<meta charset="utf-8" />
<title>Display a map - Practice 1</title>
<meta name="viewport" content="initial-scale=1,maximum-scale=1,user-scalable=no" />
<script src="./maplibre-gl@2.4.0/maplibre-gl.js"></script>
<link href="./maplibre-gl@2.4.0/maplibre-gl.css" rel="stylesheet" />
<style>
    body { margin: 0; padding: 0; }
    #map { position: absolute; top: 0; bottom: 0; width: 100%; }
</style>
</head>
<body>
<div id="map"></div>
<script>
var map = new maplibregl.Map({
container: 'map', // container id
style: 'https://ubukawa.github.io/vt-test/maps/test-simple.json', // style URL
//center: [140.084556, 36.104611], // you can specify starting position if you want [lng, lat]
//zoom: 7, // starting zoom
//maxZoom: 4, // min zoom
maxZoom: 14 // max zoom of the map
});

//UI
map.addControl(new maplibregl.NavigationControl(), 'bottom-right');
map.addControl(new maplibregl.GeolocateControl({positionOptions: {enableHighAccuracy: true},trackUserLocation: true}), 'top-right');
map.addControl(new maplibregl.ScaleControl() );

//debug
//map.showTileBoundaries = true;
//map.showCollisionBoxes = true;
</script>
</body>
</html>
Once you make it, please push your edit to your GitHub repository.
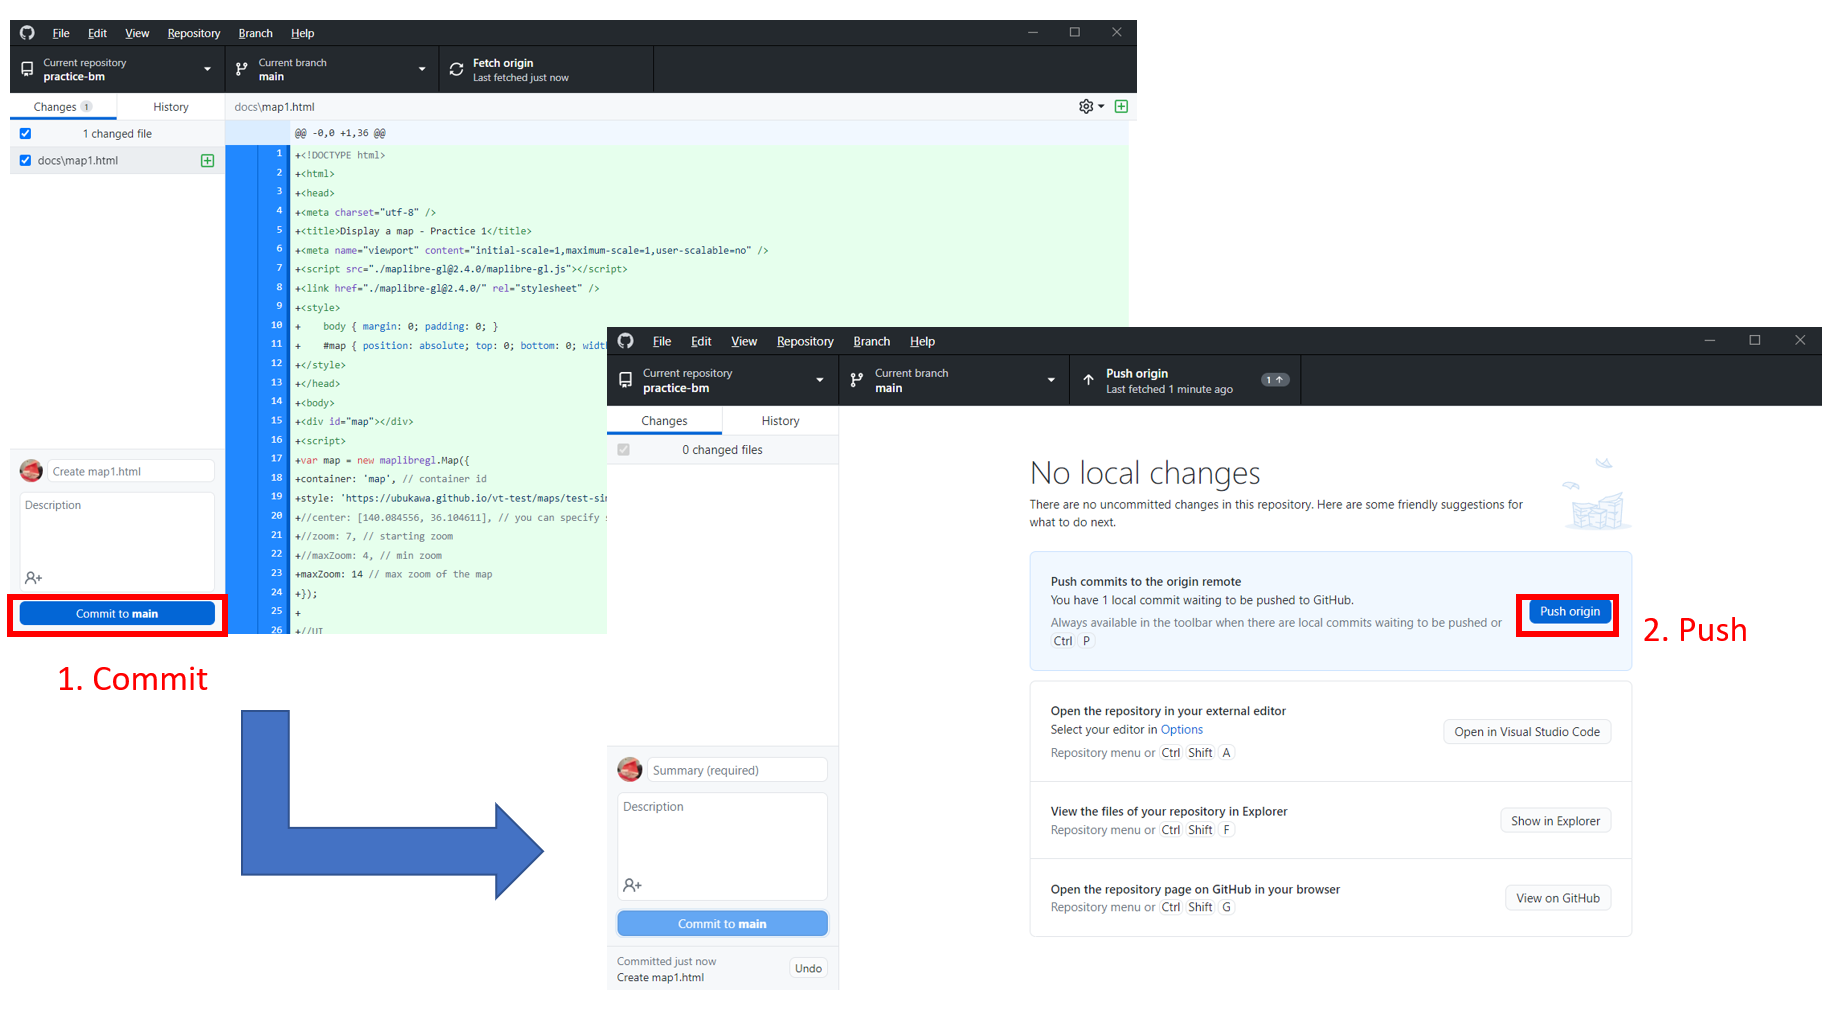
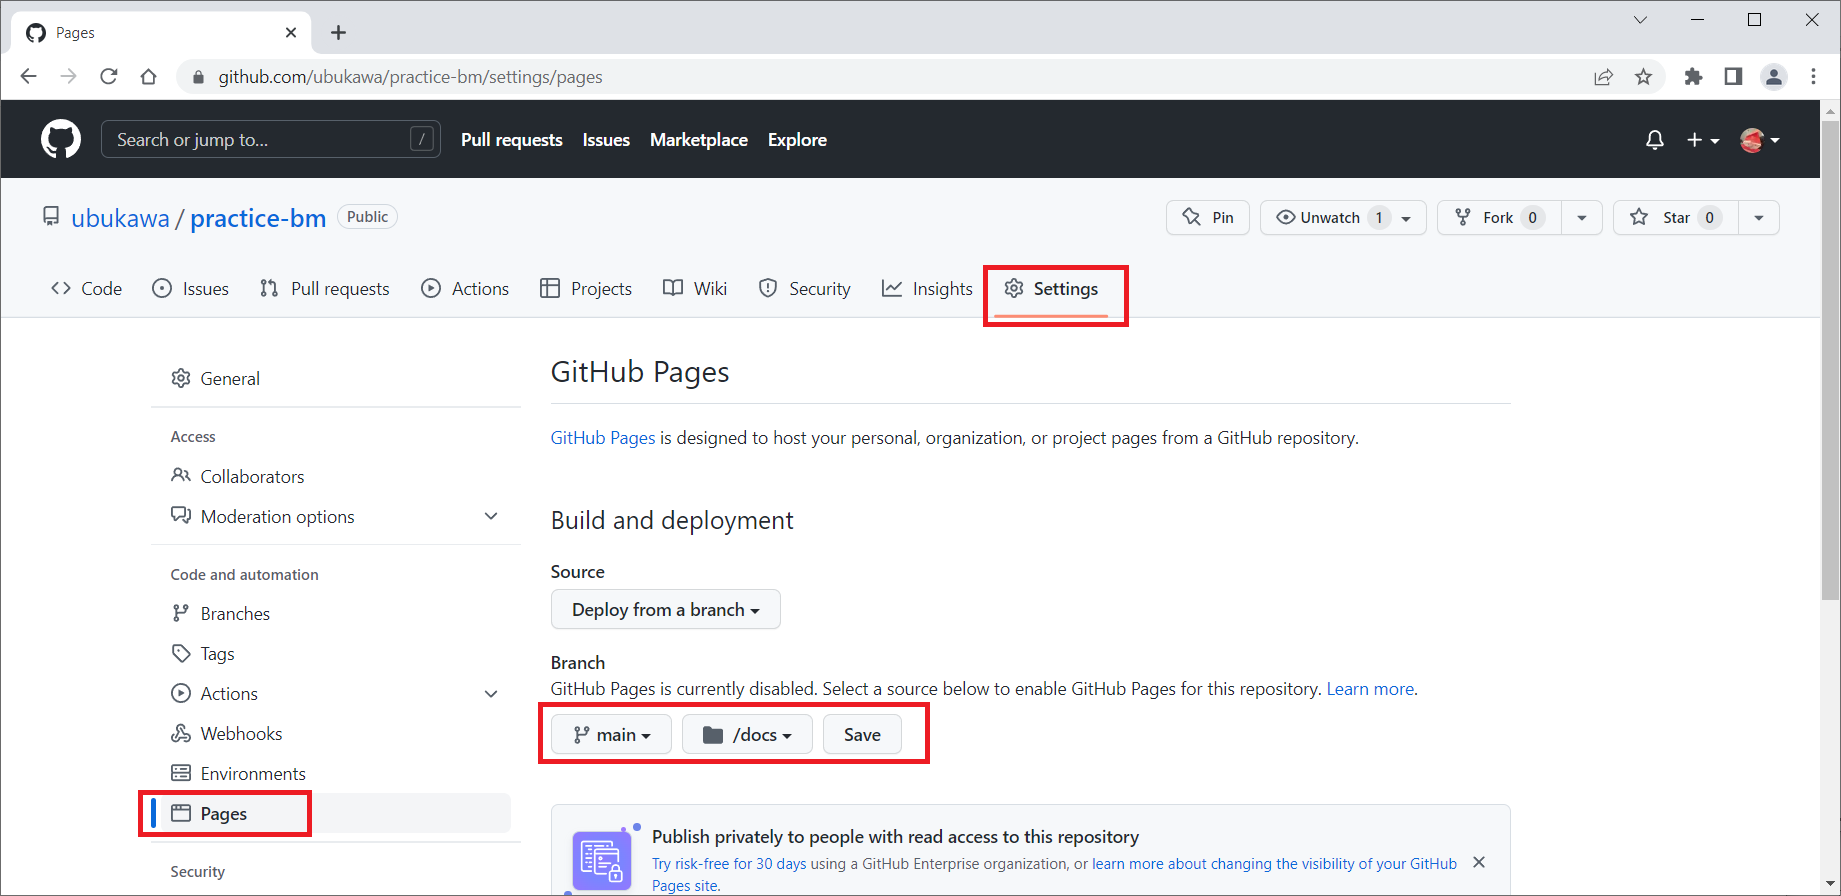
Don't forget to enable GitHub page at your repository.
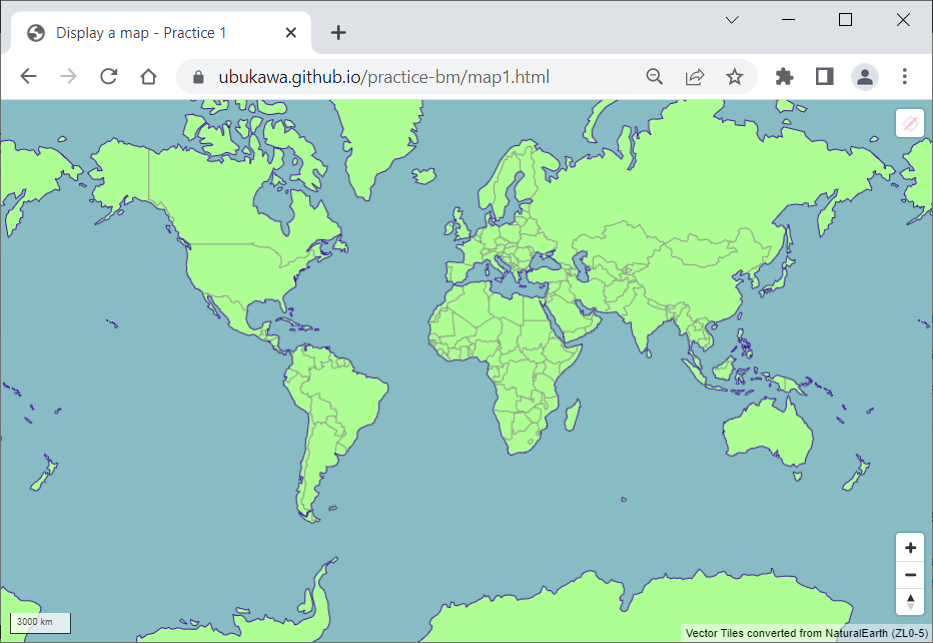
Now, you will see a map like this. Please note that the boundaries in the map are not authorized by any agencies. We are now refering to the style of a small scale map, but we can change the reference to any other style hosted in the Internet.
Let's try to change the referred style from the first one to the second one. You just need to slightly edit the style in the map. We can also change the maxZoom of the map because the second one is larger map than the first one. Edit it as below, and push it and wait for awhile. It might be a good idea to save the revised file as map2.html.
var map = new maplibregl.Map({
container: 'map', // container id
style: 'https://ubukawa.github.io/practice-bm/srtm.json', // style URL
maxZoom: 19 // max zoom of the map
});
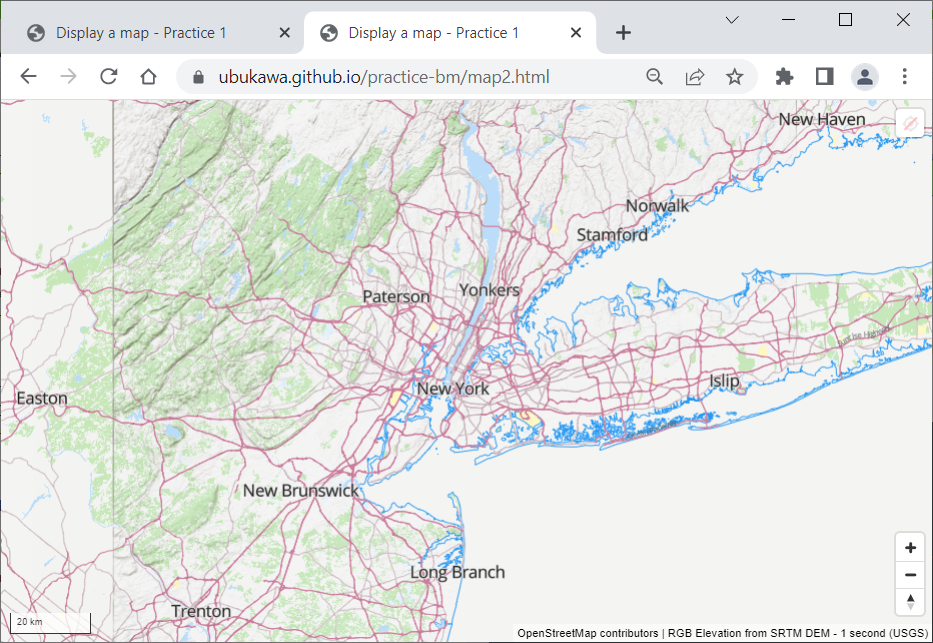
Then, you will see the map like this. This map is based on the vector tile converted from OSM data, and hillshade, derived from RGM elevation tile converted from SRTM 1 sec DEM, is added for certain area. I did not upload the RGB elevation tile for the whole area, so you will find the area with hillshade is limited.
These styles with raster-dem source are ready to go for terrain 3D expression by MapLibre.
Step 4: Create a webmap with terrain 3D expression
Before making a 3D terrain map, please make sure that you have proper raster-dem source. If you have any suitable RGB elevation source in the style file, it is perfect. It is also possible to separately add the RGB elevation source within a html's script.
Case 1: Adding the source and setting the terrain within html script
Let's copy map2.html as map3.html. Then, let's add map.addSource to add a terrain source and map.setTerrain to set the terrain 3D. Let's add the followings to the map3.html
//for 3D terrain
map.on('load', () => {
 map.addSource("terrain3D",{
   "type": "raster-dem",
   "tiles": ["https://ubukawa.github.io/srtm-rgb-nyc/zxy/{z}/{x}/{y}.png"],
   "attribution": "RGB Elevation from SRTM DEM - 1 second (USGS)",
   "tileSize": 256,
   "maxzoom": 12,
   "minzoom": 4
 });
 map.setTerrain({
   source: "terrain3D",
   exaggeration: 1
 });
});
Let's also add maxPitch (to 85) and hash setting to the map so that we can handle map easily. Please see below.
var map = new maplibregl.Map({
container: 'map', // container id
style: 'https://ubukawa.github.io/practice-bm/srtm.json', // style URL
maxZoom: 19, // max zoom of the map
maxPitch: 85,
hash: true
});
You can see the actual html and demo site from:
html: https://github.com/ubukawa/practice-bm/blob/main/docs/map3.html
demo: https://ubukawa.github.io/practice-bm/map3.html
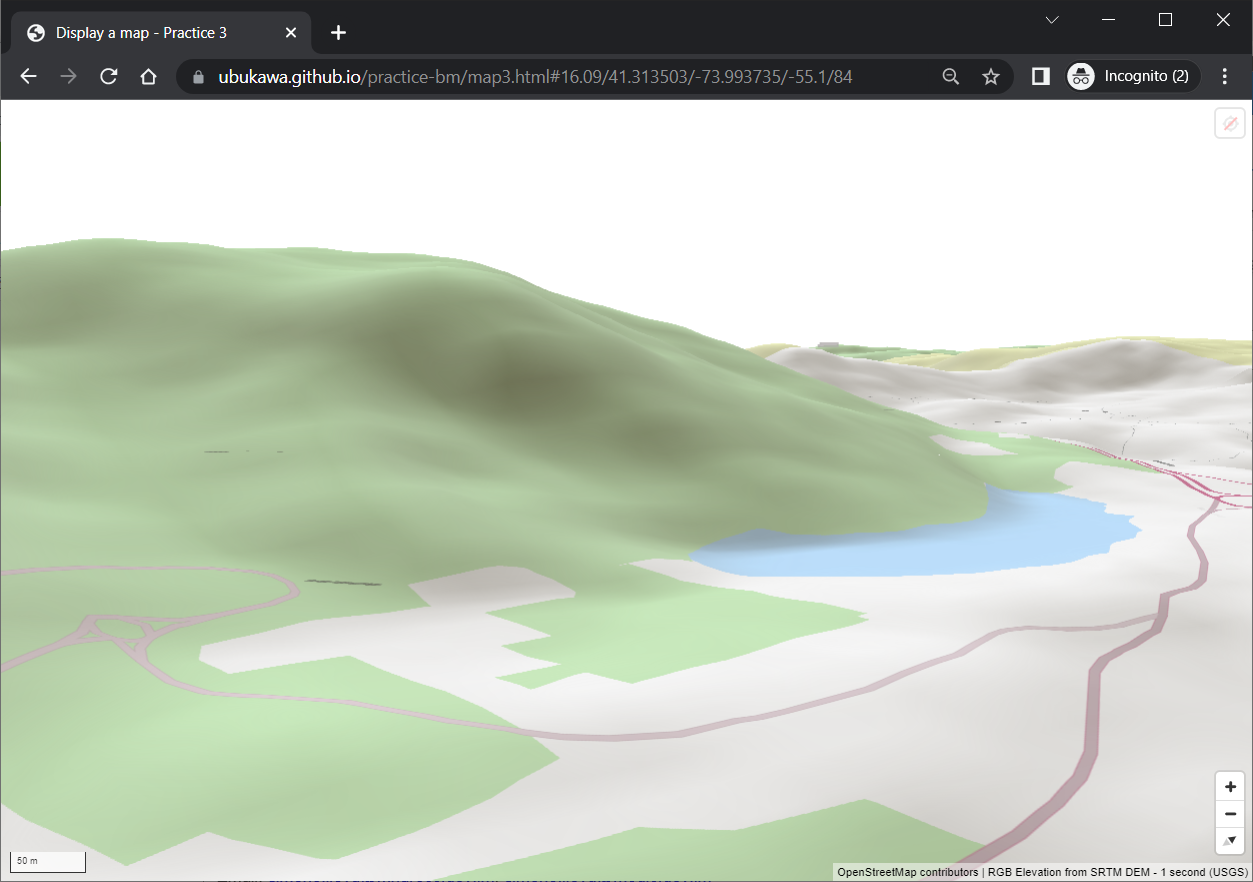
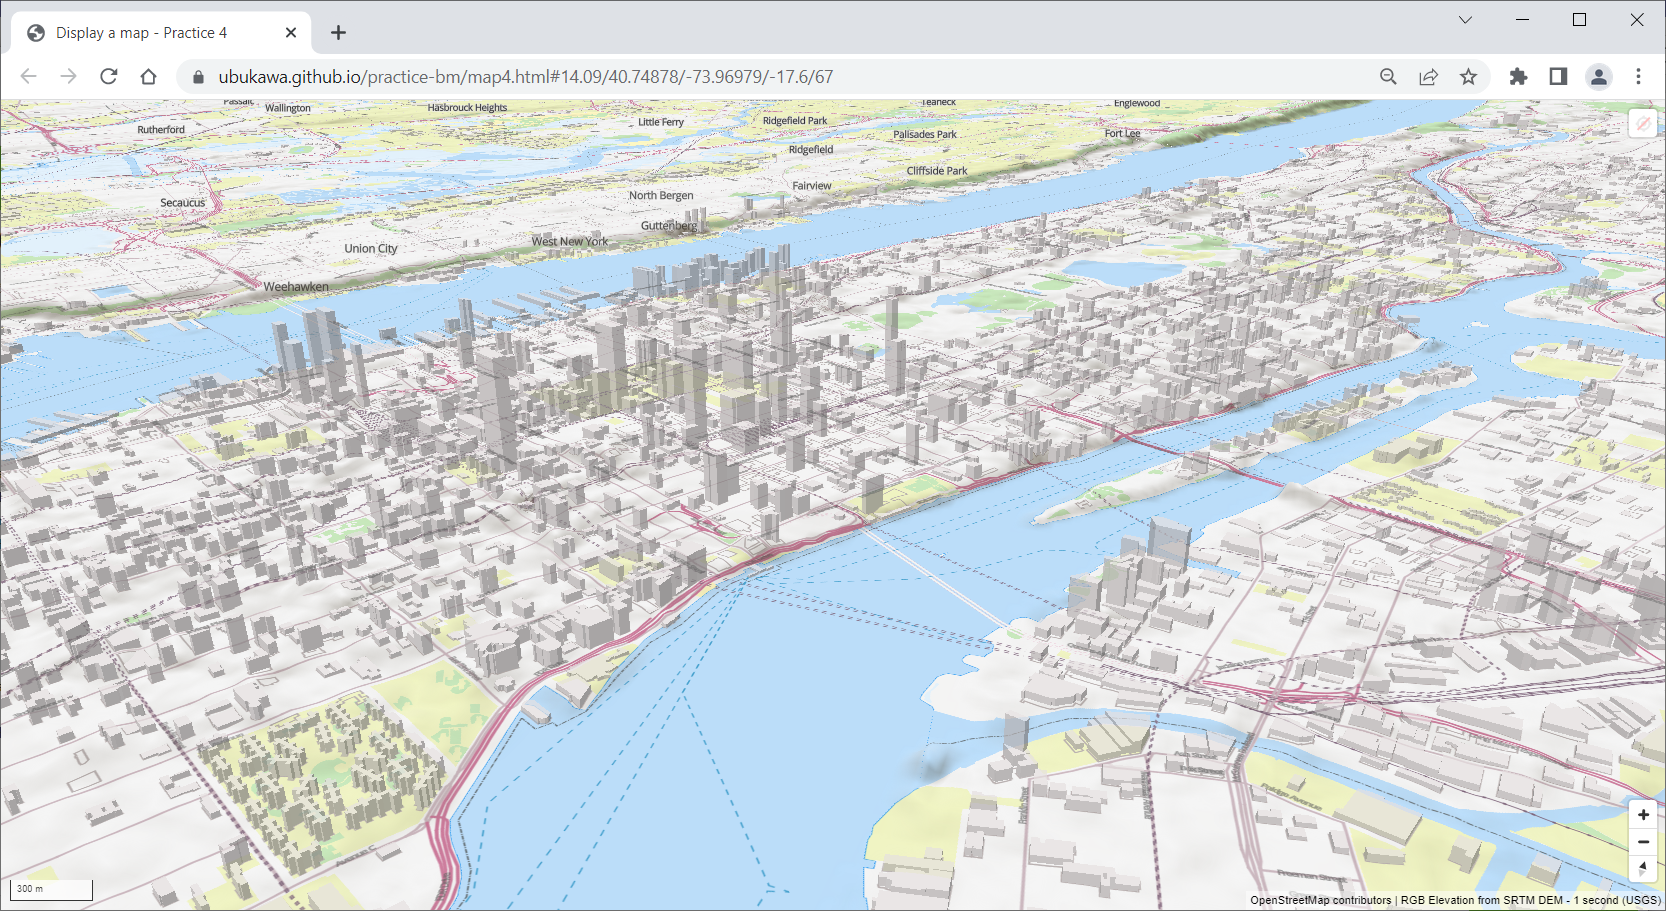
Now, because we enable hash, you can see the zoom level, lat, long, nearing, and pitch as the URL path.
For example, you can see the Bear Mountain and Hessian Lake in New York States here: https://ubukawa.github.io/practice-bm/map3.html#16.18/41.31329/-73.993859/-60.1/74
Case 2: Adding the source and setting the terrain in style file
Instead of adding the source and setting the terrain in html script, we can also define them in the style file. Let's copy the original style file to edit and save in your repository.
- original: https://ubukawa.github.io/practice-bm/srtm.json
- edited style: https://ubukawa.github.io/practice-bm/srtm-3d.json
The edited style only have an additional source for terrain, and terrain setting. And, by simply referring to this style, we can create a 3D map. (You do not have to add map.on function here.)
html: https://github.com/ubukawa/practice-bm/blob/main/docs/map4.html
demo: https://ubukawa.github.io/practice-bm/map4.html
You may see the same map with the previous case.
some note on 3D terrain:
Because the MapLibre GL JS is derived from Mapbox GL JS version 1.X, regarding the basic map creation, you can do the almost same things with Mapbox GL JS and Mapbox GL JS. However, the terrain 3D expression is somehow different between MapLibre and Mapbox due to the change of the license of the Mapbox's license after its version 2.0.
One more practice: Plug-in
I got a request of using a comparing tool, so let's quickly go through "maplibre-gl-compare" plug-in.
Preparation of the maps to compare
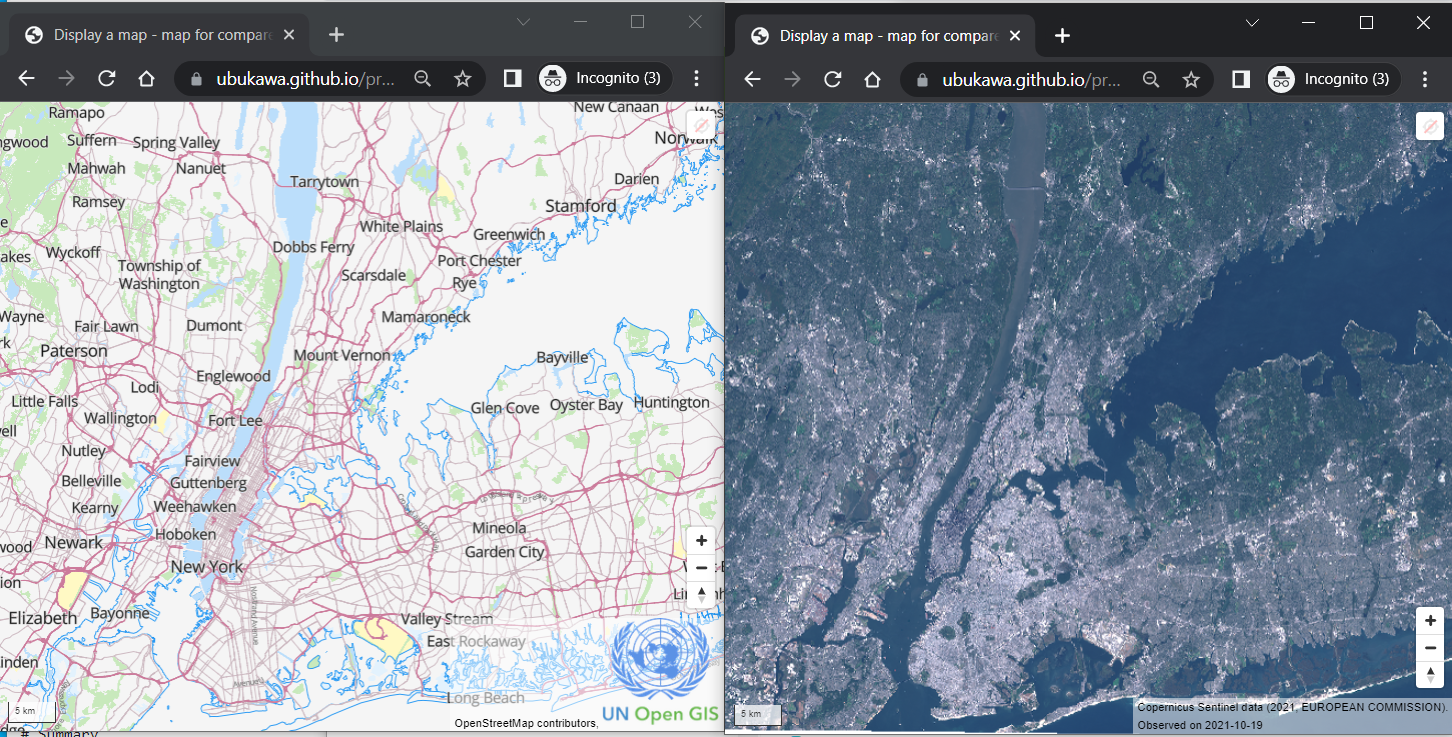
Here, I have prepared two maps for the comparison.
- Map 1 style: Vector tile map from OSM (without DEM)
- Map 2 style: Raster tile from Sentinel 2 imagery
We have the following two maps with the above two styles.
https://ubukawa.github.io/practice-bm/comp-map1.html
https://ubukawa.github.io/practice-bm/comp-map2.html
If you want to know how to develop Sentinel 2 raster tile with FOSS4G tool, I have another article here (in Japanese. Use translator): https://qiita.com/T-ubu/items/de0d30e0f2bdcd72ee8a
Downloading "maplibre-gl-compare"
Let's get the plug-in files from https://github.com/maplibre/maplibre-gl-compare. We will use maplibre-gl-compare.js, maplibre-gl-compare.css, and license.txt, but cloning whole repository woudl be easier. Let's run "git clone" at your docs directory.
git clone https://github.com/maplibre-maplibre-gl-compare
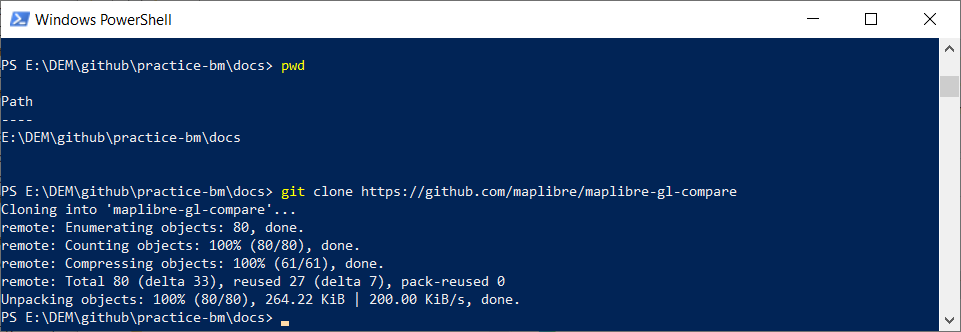
Then, you will have JS and CSS files under "maplibre-gl-compare/dist" directory.
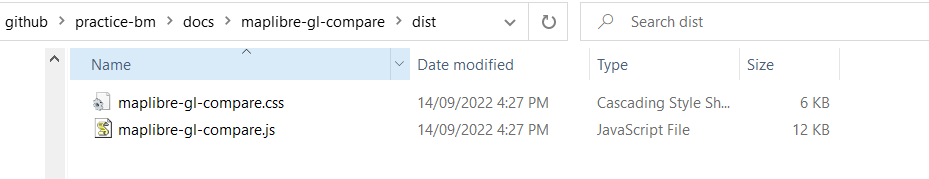
Then, keep the "dist" directory and the license.txt, and delete other files.
Preparing a html file to compare
Referring to some example, we can create a simple comparison map as below:
<!DOCTYPE html>
<html>
<head>
<meta charset="utf-8" />
<title>Display a map - map for compare</title>
<meta name="viewport" content="initial-scale=1,maximum-scale=1,user-scalable=no" />
<script src="./maplibre-gl@2.4.0/maplibre-gl.js"></script>
<link href="./maplibre-gl@2.4.0/maplibre-gl.css" rel="stylesheet" />
<script src="./maplibre-gl-compare/dist/maplibre-gl-compare.js"></script>
<link href="./maplibre-gl-compare/dist/maplibre-gl-compare.css" rel="stylesheet" />
<style>
    body { margin: 0; padding: 0; overflow: hidden; }
    body * {webkit-touch-callout: none; -webkit-user-select: none; -moz-user-select: none; -ms-user-select: none; user-select: none; }
    .map { position: absolute; top: 0; bottom: 0; width: 100%; }
    .controls { position: absolute; top: 0; right: 0; }
</style>
</head>
<body>
 <div id="wrapper">
   <div id="map1" class="map"></div>
   <div id="map2" class="map"></div>
 </div>
<script>
var map1 = new maplibregl.Map({
  container: "map1",
  style: "https://ubukawa.github.io/osm-neighbor/style.json",
  zoom: 9,
  center: [-73.8128, 40.8513], // center [lng, lat]
  maxZoom: 0, // min zoom
  maxZoom: 16, // max zoom
  hash: true
});

var map2 = new maplibregl.Map({
  container: "map2",
  style: "https://ubukawa.github.io/practice-bm/style-sentinel-ny.json",
  zoom: 9,
  center: [-73.8128, 40.8513], // center [lng, lat]
  maxZoom: 0, // min zoom
  maxZoom: 16, // max zoom
  hash: true
});

var wrapperSelector = "#wrapper";
var wrapperElement = document.body.querySelectorAll("#wrapper")[0];

var options = {
  mousemove: false,
  orientation: "vertical", //horizontal
};

var map = new maplibregl.Compare(
  map1,
  map2,
  wrapperSelector,
  options
);

map1.addControl(new maplibregl.ScaleControl(), 'bottom-left' );
map1.addControl(new maplibregl.NavigationControl(), 'bottom-left');

</script>
</body>
</html>
I noticed the followings things when I worked on the above file.
- Reference to the maplibre-gl-compare.js and maplibre-gl-compare.css are added.
- style for body *, .map are added. (I omitted the controls, but keep .control in the style.)
- Instead of "map", "wrapper" div is used and it includes the map1 and map2, which are the maplibre.Map.
- Elements of the map1 and map2 are difined. It would be good to use a common set of parameters to avoid confusion.
- There are some options for maplibregl.Compare. We could explore them in the future.
- control elements are added to the map1, not wrapper. I have not yet tested to add controls to the wrapper though.
You will see a map like this.
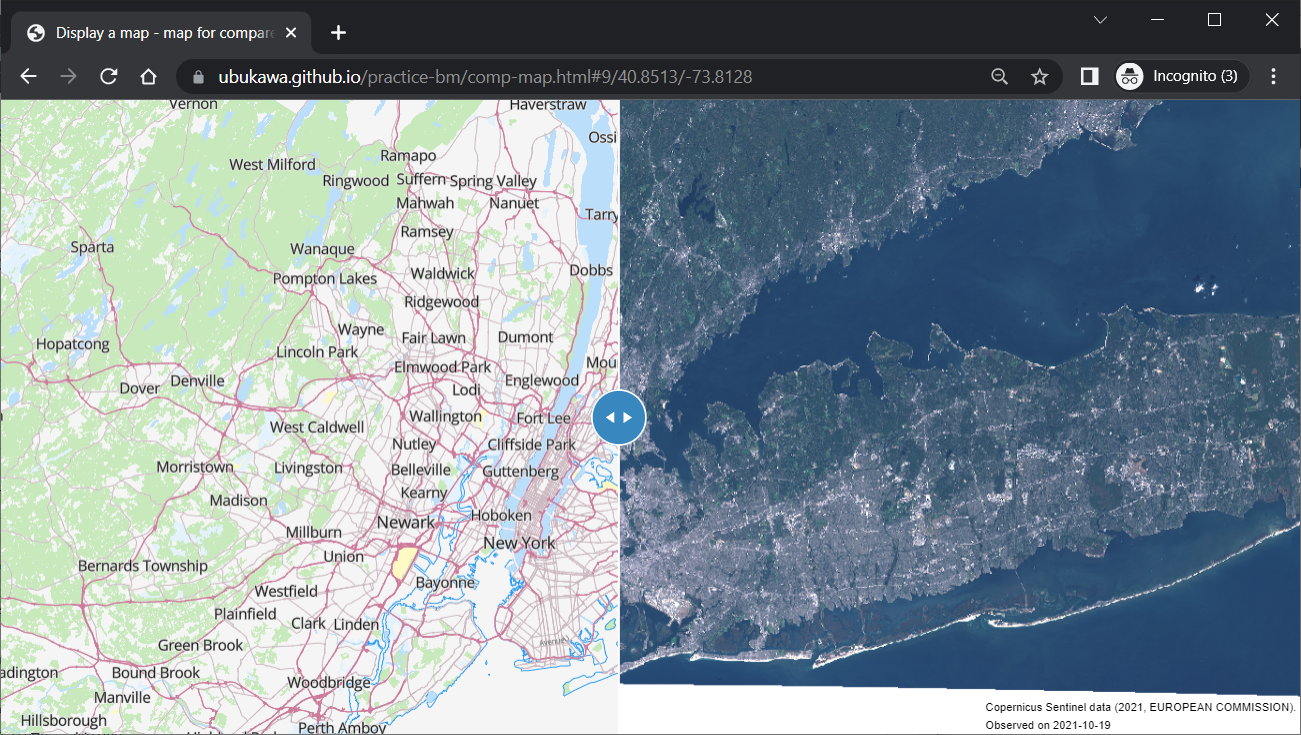
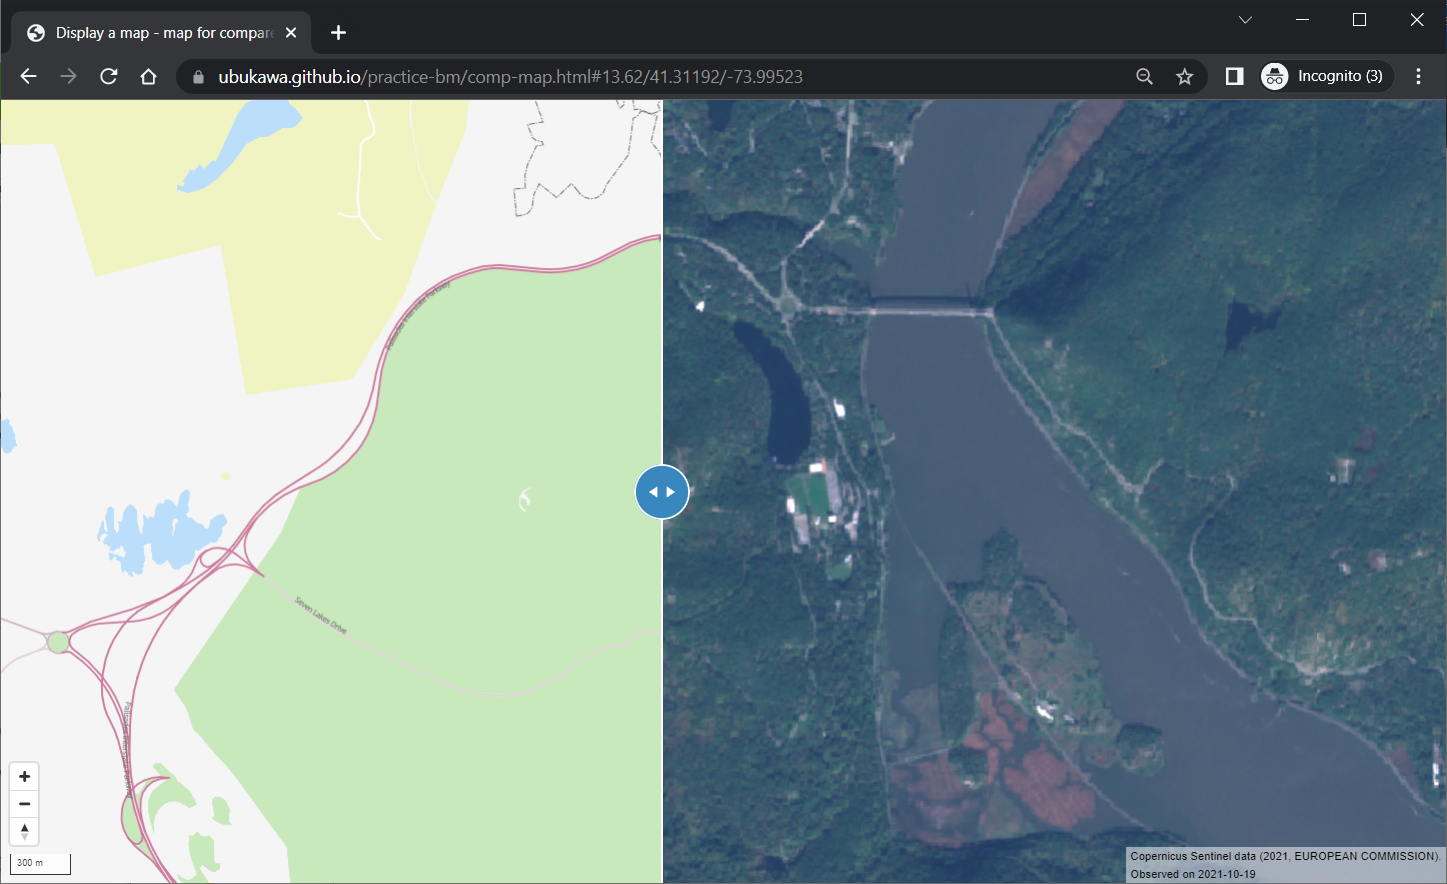
You can see the area around the Bear Mountain at: https://ubukawa.github.io/practice-bm/comp-map.html#13.62/41.31192/-73.99523
Congratulation. This is the end of our practice.
Summary
Thus, we can create a webmap with 3D terrains powered by MapLibre. We also can try a simple comparison plugin.
References