Introduction
In the web mapping field, I think vector tile technique is getting its popularity year by year. I joined FOSS4G in 2022 and 2021, and strongly felt it. There are a lot of wonderful tools such as OpenMapTiles, tilemaker and onthegomap/planetiler to create your own vector tile data from OpenStreetMap.
Our initiative, UN Vector Tile Toolkit (UNVT), also supports converting vector tile from OpenStreetMap data, so I will introduce how we can create vector tile from OpenStreetMap using UNVT (in particular unvt/naru unvt/nanban).
Because unvt/naru was developed more than two years ago, it worked on nodejs ver. 12, and its docker image cannot be build right now at my local environment. I have created a repository ubukawa/mini-naru containing a subset of files from unvt/naru for vector tile creation, which will run on the docker based unvt/nanban environment.
My Environment
My working environment is as follows:
- Windows 10 (Enterprise)
- Docker version 20.10.8
- PowerShell version 5.1.19041.1237
- git version 2.25.0.windows.1
Procedure
Step 1: Download the file
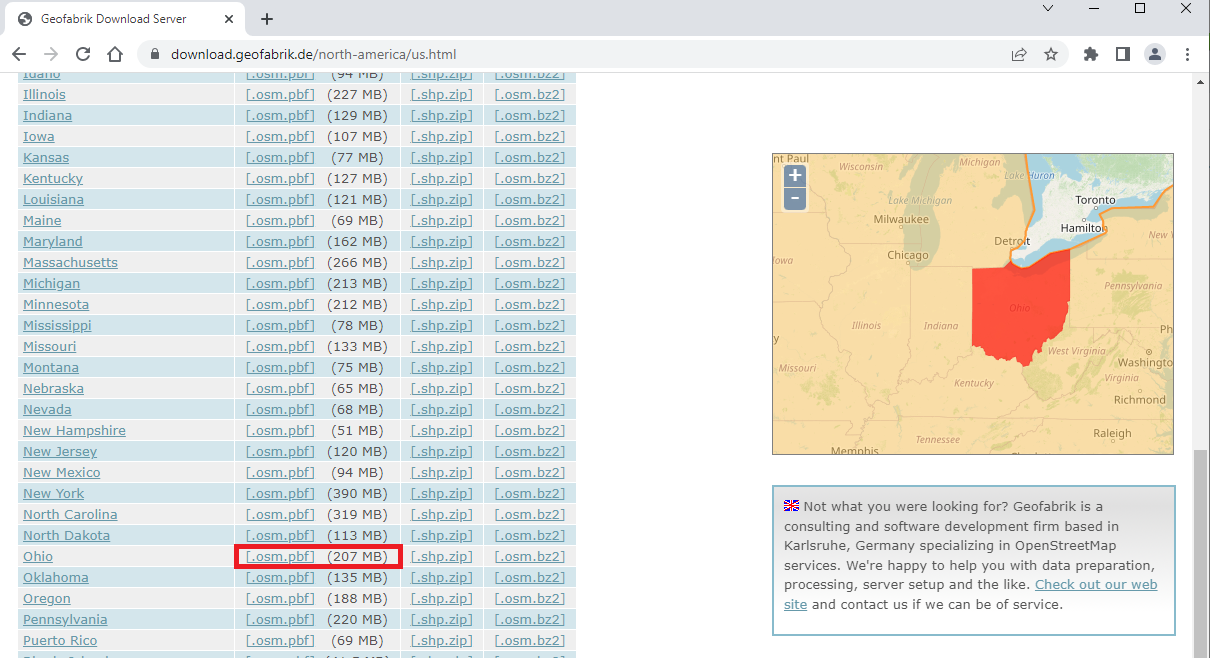
There is a good web page named "GEOFABRIK" that provides OpenStreetMap data extracts. You can choose the data by region, contry and so forth.
I chose the data for the Ohaio State, USA for this trial as below. I got "ohio-latest.osm.pbf."
Step 2: Cloning the scripts from mini-naru
git clone https://github.com/ubukawa/mini-naru
cd mini-naru
Step 3: Starting Docker container
I saved the downloaded file in the src directory at my working directory, and started a docker container there. The unvt/nanban is a docker image that includes all the necessary tool for this vector tile practice.
docker run -it --rm -v ${PWD}:/data unvt/nanban
cd /data
unvt/naru originally used its own Dockerfile to establish its docker image. However, because it does not work at my environment now, I am using another unvt tool to establish my working environment.
Step 4: Making a config file for data export and testing export
We use osmium for reading the data from the source (src/ohio-latest.osm.pbf). I referred to a config file for it, osmium-export-config.json, and ran the command as below.
osmium export --config osmium-export-config.json --index-type=sparse_file_array --output-format=geojsonseq --output=- src/ohio-latest.osm.pbf

Then, I saw the features are exported as geojson sequence. We can adjust config file whenever needed.
I do not write the copy of the osmium-export-config.json here, but it is important to confirm its content for your better understanding.
Step 5: Applying a filter to modify the exported GeoJSON sequence
We will edit the GeoJSON sequence with filter.js and modify.js. First, I installed two npm packages as below.
npm install --save json-text-sequence @mapbox/geojson-area
Then, let's check filter.js and modify.js. Although I do not explain about the modify.js, but this is the core of the data conversion, and this defines the vector tile structure. We can learn a lot from this file. You can also edit this file to change the vector tile structure.
Then, I ran command as below. I just added a filter to the previous step using pipe and node (| node filter.js).
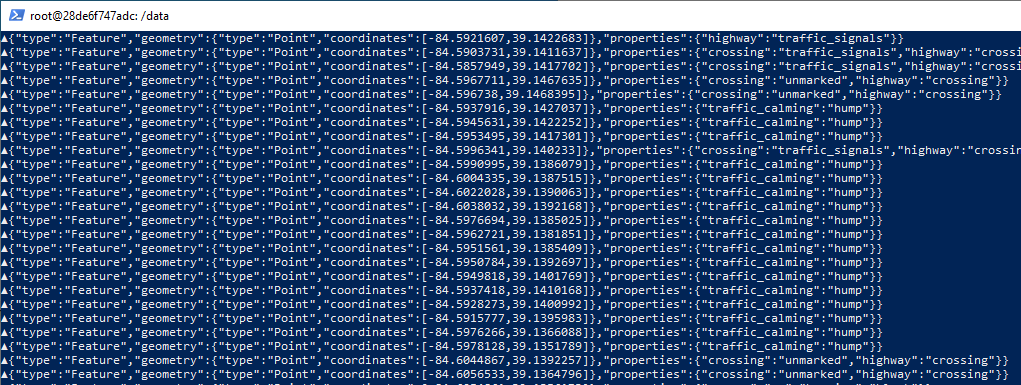
osmium export --config osmium-export-config.json --index-type=sparse_file_array --output-format=geojsonseq --output=- src/ohio-latest.osm.pbf | node filter.js
Now, we can see that each exported feature has the propeties for tippicanoe, which is for the vector tile conversion.

Step 6: Vector tile conversion (export as mbtiles)
So far, I confirmed that I obtained a GeoJSON sequence with proper conversion information. It is ready to be piped into tippecanoe, a vector tile conversion tool. I added one more pipe to the previous command.
osmium export --config osmium-export-config.json --index-type=sparse_file_array --output-format=geojsonseq --output=- src/ohio-latest.osm.pbf | node filter.js | tippecanoe --no-feature-limit --no-tile-size-limit --force --simplification=2 --maximum-zoom=15 --base-zoom=15 --hilbert --output=src/output.mbtiles

Depend on the source data and PC power, it would take a long time.
Step 7: converting from mbtiles format to pbf tile format.
For static hosting via GitHub page, let's convert mbitles to pbf files in zxy structure using tile-join, a sub-tool of the Tippecanoe. However, because the total size of pbf tiles can be 3 or 4 times larger than the mbtiles size, it would be not a good idea to convert a large mbtiles data into pbf. (If so, you may think about delivering the tiles from mbtiles using nodejs server, etc..)
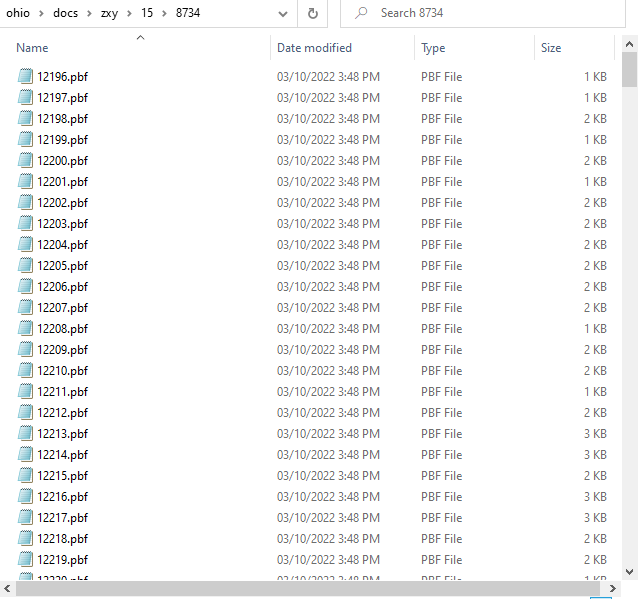
tile-join --force --no-tile-compression --no-tile-size-limit --output-to-directory=docs/zxy src/output.mbtiles
Result: Vector tile in PBF format
Thus, I obtained vector tiles in zxy directory.
It would be a good idea to confirm the center of data in the metadata.json.

Additional note: Vector tile map hosting
styling
Because the vector tile structure is designed by the filter.js and modify.js as explained above, we can use a common style from unvt/naru here by adjusting the center, location of source tile, glyphs, etc. It is from unvt/naru repository.
Hosting
It would be easy to host the tile in GitHub page with necessary library and files.
unvt/naru has a function to create sprites (map symbols), and glyphs (text fonts), etc., so I copied them into mini-naru (https://github.com/ubukawa/mini-naru/tree/main/docs) as well as the latest MapLibre GL JS. You can create your map environment using these resources.

https://ubukawa.github.io/ohio/index.html#14.28/41.50216/-81.66211/-92/60

Acknowledgement
This trial is based on the previous efforts summerized in the unvt/naru by @hfu and his colleagues.
Reference
- unvt/naru https://github.com/unvt/naru
- unvt/nanban https://github.com/unvt/nanban
- ubukawa/mini-naru https://github.com/ubukawa/mini-naru
- GEOFABRIK https://download.geofabrik.de/