Introduction
unvt/charites is an easy, intuitive, and efficient command-line tool for writing vector map styles compatible with the Mapbox and MapLibre Style Specification in YAML.
YAML files are easy to read, and charites' live preview will help our style editing.
With this article, I will introduce how to install charites in windows PC and how to use it. There are some practice/exercise so that you have better understanding of unvt/charites. Some of them would be easy, but please follow them if you are interested in using unvt/charites for your styling work!
The most part of this work was done as my activities of the DWG 7 working group in the UN Open GIS Initiatve.
This text was originally written for my dear colleagues, M.T., O.M.S., and P.F.
My testing Environment
- Windows 10
- git
- nodejs version 18.12.1
- npm version 8.19.2
- Windows PowerShell
Exercise 1. Installing unvt/charites
1-1. confirm versions of nodejs and npm
Check if nodejs is installed in you PC. If not, visit nodejs to install them. Version 14 or later version is recommended. Installation will fail with the older version of nodejs than 12.20.0.
Open Windows PowerShell and check their version.
node --version
npm --version
1-2. Installation of npm package
Then, run the following command to install unvt/charites as npm package. If you successfully install it, you will see the version of charites with the following command.
npm install -g @unvt/charites
charites --version
charites --help
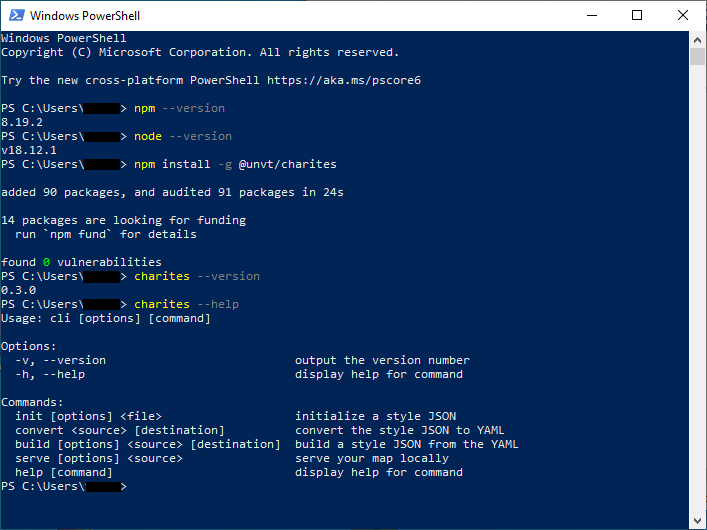
Then, you are ready to use unvt/charites. Congratulations!!
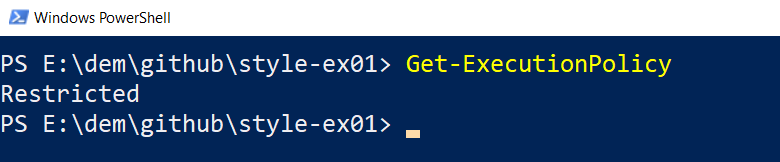
If you see some error that says "charites.ps1 cannot be loaded because running scripts is disabled on this system," try using charites with Command Prompt.
If the execution policy of your PowerShell is "Restricted", the charites' scripts will not run on the PowerShell. They will run with "RemoteSigned" policy, etc.
Exercise 2. Style editing
2-1. Initiating a new style
If you have a style json, it is easy for you to import that json into yaml files. However, if you start from scratch, you can use my template to initialize a style. I will show how you can do that. First, please copy the template from my repository with the following command.
git clone https://github.com/ubukawa/charites-init
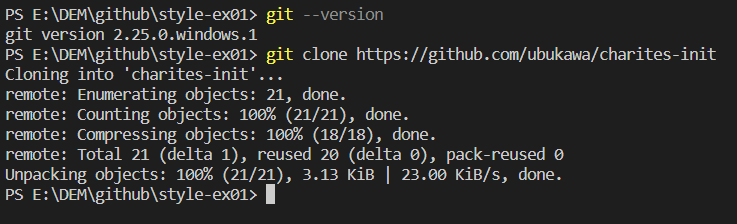
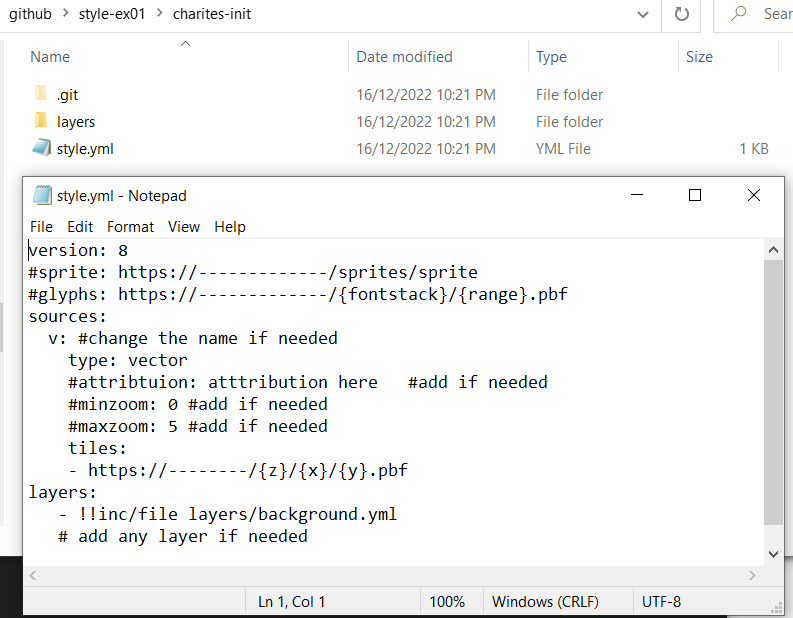
Then, you will get style.yml under the "charites-init" directory.
2-2. Editing style.yml to define sources, sprites, and glyphs
At first, the style.yml is as follows. We will edit it from now on.
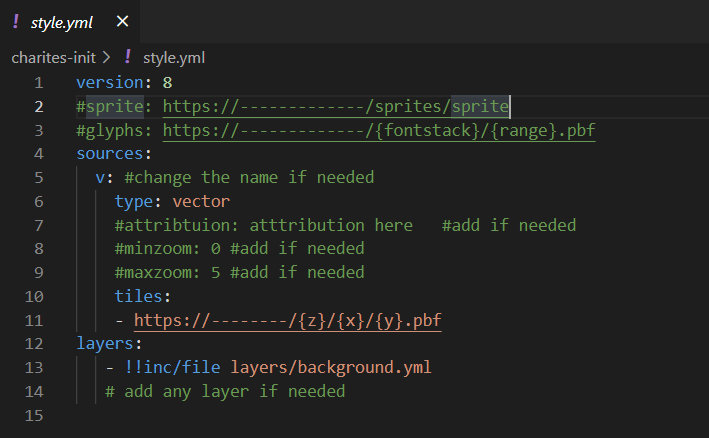
Let's open style.yml with notepad or any text editor. MicroSoft Visual Studio Code is also a good editor because it helps us writing codes. Remove the comment tag (#), and add the value as follow:
- sprite
- sprite is a image file with a json file that provide map symbols or fill pattern, etc.
- for this exercise, we will use "https://ubukawa.github.io/clearmap-style2/sprite_un/sprite_S"
- glyphs
- glyphs is a location of text-font. Text fonts are provided in pbf format.
- for this exercise, we will use "https://ubukawa.github.io/clearmap-style2/font/{fontstack}/{range}.pbf"
- sources
- we can add sources here. This time, I will add three vector tile sources here. Please check them in the following yml.
version: 8
sprite: https://ubukawa.github.io/clearmap-style2/sprite_un/sprite_S
glyphs: https://ubukawa.github.io/clearmap-style2/font/{fontstack}/{range}.pbf
sources:
  ne: #change the name if needed
    type: vector
    attribution: NaturalEarth   #add if needed
    minzoom: 0 #add if needed
    maxzoom: 5 #add if needed
    tiles:
    - https://ubukawa.github.io/graticules-vt/zxy/{z}/{x}/{y}.pbf
  carto: #change the name if needed
    type: vector
    attribution: Cartotile - Test data   #add if needed
    minzoom: 0 #add if needed
    maxzoom: 2 #add if needed
    tiles:
    - https://ubukawa.github.io/cartotile/tile/{z}/{x}/{y}.pbf
  cme: #change the name if needed
    type: vector
    attribution: UN_CLEARMAP_VT(powered by esri)
    minzoom: 0 #add if needed
    maxzoom: 5 #add if needed
    tiles:
    - https://pro-ags2.dfs.un.org/arcgis/rest/services/Hosted/Clearmap_Webplain/VectorTileServer/tile/{z}/{y}/{x}.pbf
layers:
   - !!inc/file layers/background.yml
   # add any layer if needed
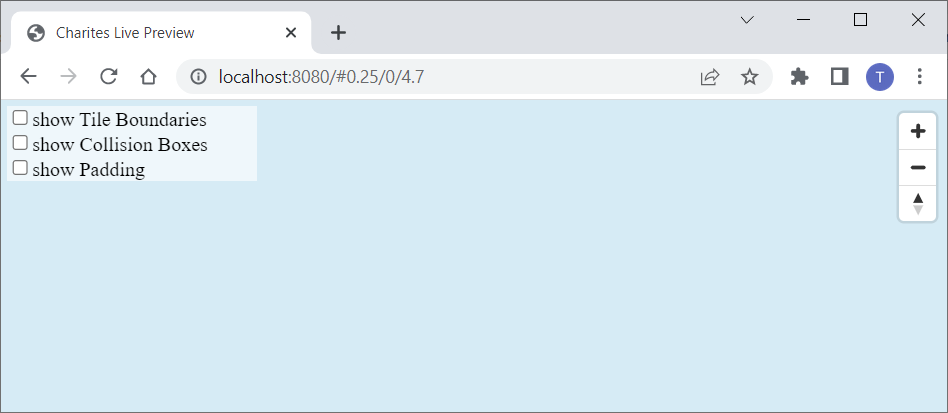
2-3. Start charites live preview
If you have done the preparation so far, we can start chartes' live preview in the local host. Please note that you have not defined any layer other than background. The background is included in the initial package.
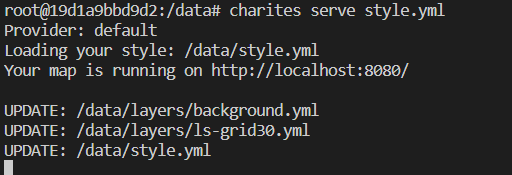
cd charites-init
charites serve style.yml  #(Ctrl + c to stop)
You will see the live preview at http://localhost:8080 .
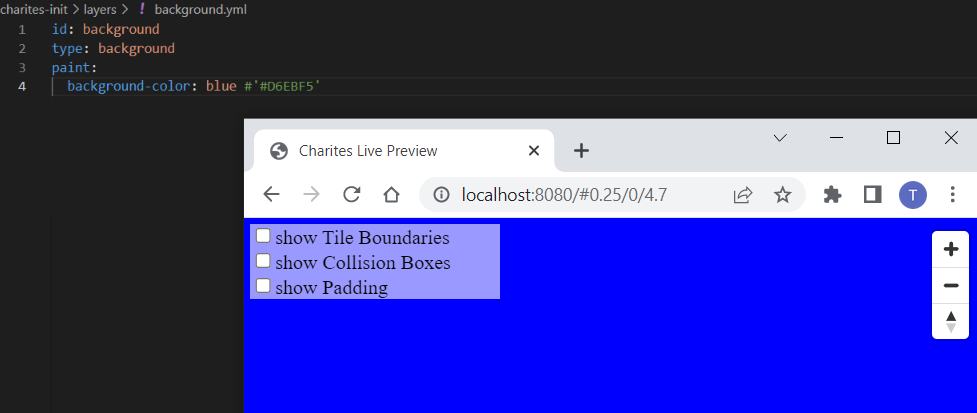
2-4. Change the background color (you will be familiar with the color expression)
Try to edit layers/background.yml and change backgound-color with notepad or any other text editor. You can specify the color with index color (e.g. '#D6EBF5'), rgb color (e.g. rgb(0,0,100)), rgba color (e.g. rgba(10,0,100,0.7)), etc. You can also use color expression like "red", "green", "blue". (see https://maplibre.org/maplibre-gl-js-docs/style-spec/types/#color ). Please also be noted that QGIS plugin or Esrc's ArcGIS API for Javascript may have some preference of color expression.
2-5. Add a layer: Grid line
Please keep charites live preview running.
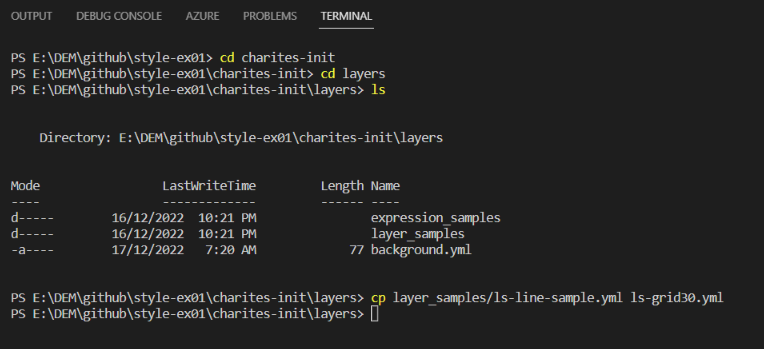
First, let's add a line layer, 30 degree grid line from NaturalEarth ("ne" source). I stored sample yml files in charites-init/layers/layer_samples for general purpose. Copy "ls-line-sample.yml" as "ls-grid30.yml" and edit it. Because you keep charites live preview running, you may need to open another PowerShell window (terminal in MS Visual Studio Code).
cd charites-init/layers
cp layer_samples/ls-line-sample.yml ls-grid30.yml
Then, edit "ls-grid30.yml" as below.
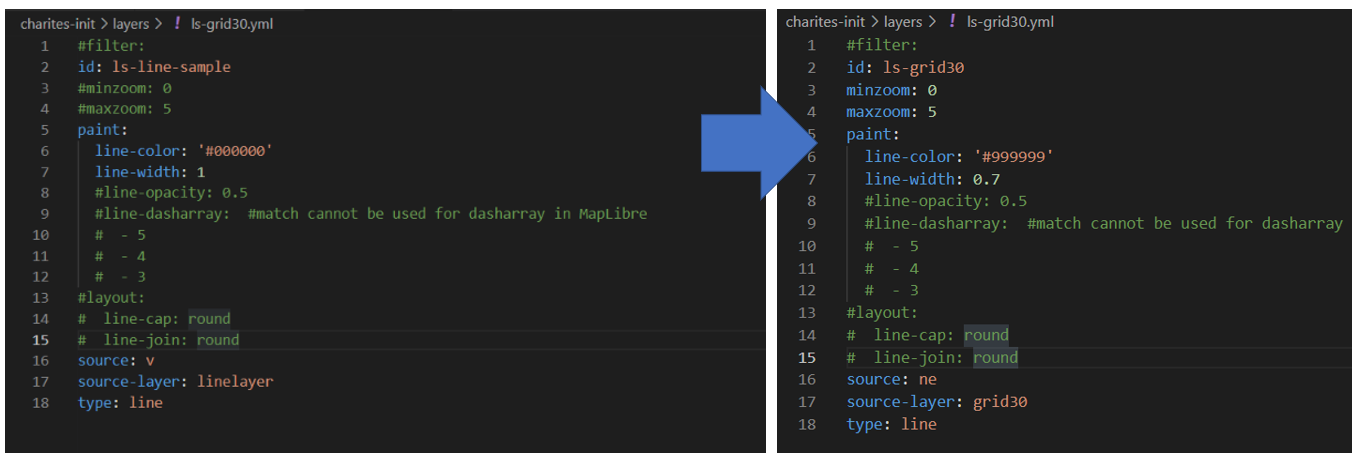
There are some comment tag for the template, but it is simple as below.
id: ls-grid30
minzoom: 0
maxzoom: 5
paint:
  line-color: '#999999'
  line-width: 0.7
source: ne
source-layer: grid30
type: line
However, you will not see any change in the live-preview. We need to add a layer in "style.yml." Please add one line in the list of layers in the style.yml as below. It is important to note that lower line layer comes upper in the webmap.
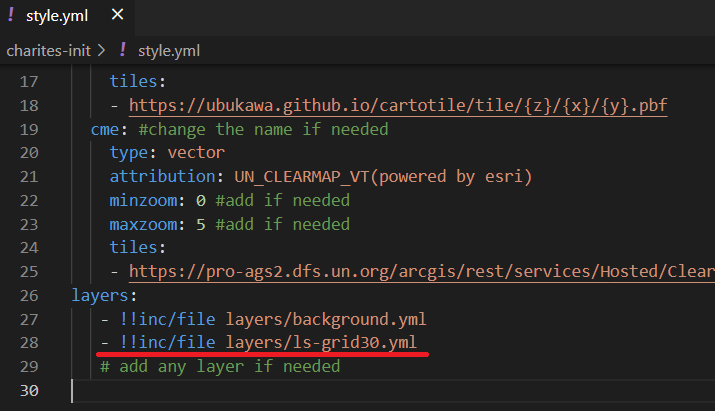
Charites may find update of the files and reflect them to the live preview.
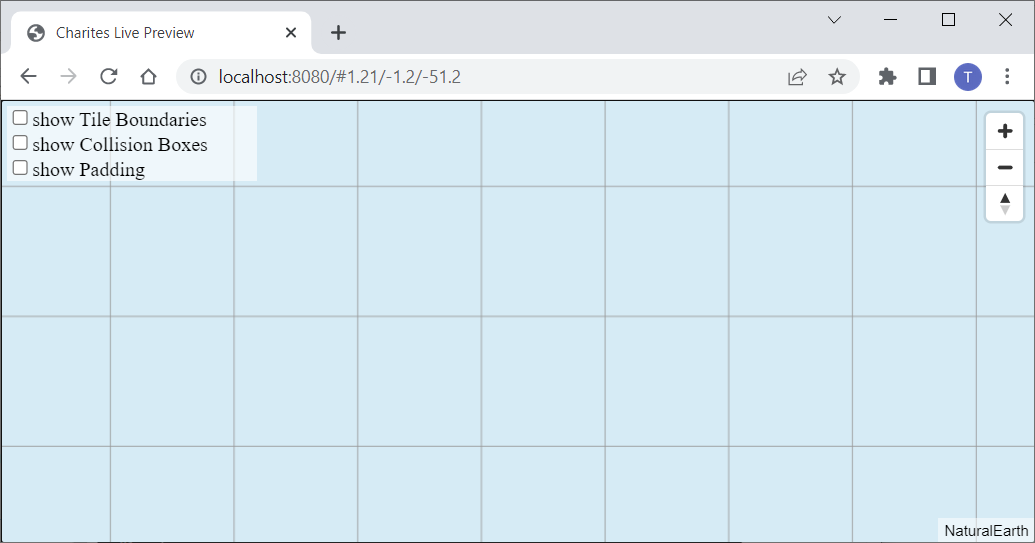
You will see the following screen. Oops, it seems that I created the grid from zoom level 1 to 5, so you will not see any line at zoom level 0 until it gets 1 although you edit the style setting from ZL 0. (But, we can learn that it is important to properly understand the structure of the source vector tile. In addition, we can learn here that we may not need to define max/min Z in style if we control it in the source, while it is also important to understand how we use "overzooming" of the tile. I will not go into the details here.)
2-6. Add a layer: Addling Polygon (Fill)
Next, let's add polygon for landmass. We will use some polygon from Esri's Feature Service here: https://geoservices.un.org/arcgis/rest/services/Hosted/UN_Geodata_Stylized/FeatureServer/3?f=pjson .
I have accessed this early December 2022 and convert the layer into vector tile (Method is written here in Japanese).
Copy "pg-fill-sample.yml" as "pg-landmass.yml" and edit it as below:
cp layer_samples/pg-fill-sample.yml pg-landmass.yml
id: pg-landmass
minzoom: 0
maxzoom: 5
paint:
  fill-color: rgb(237,237,237)
source: carto
source-layer: bnda
type: fill
And, do not forget to add the layer in the style.yml. It should be upper the background, but under the grid line.
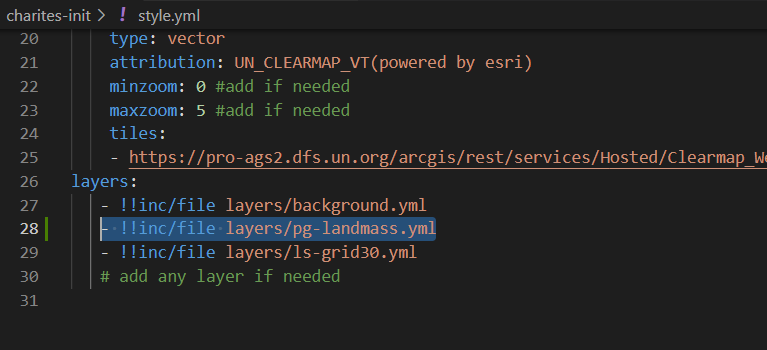
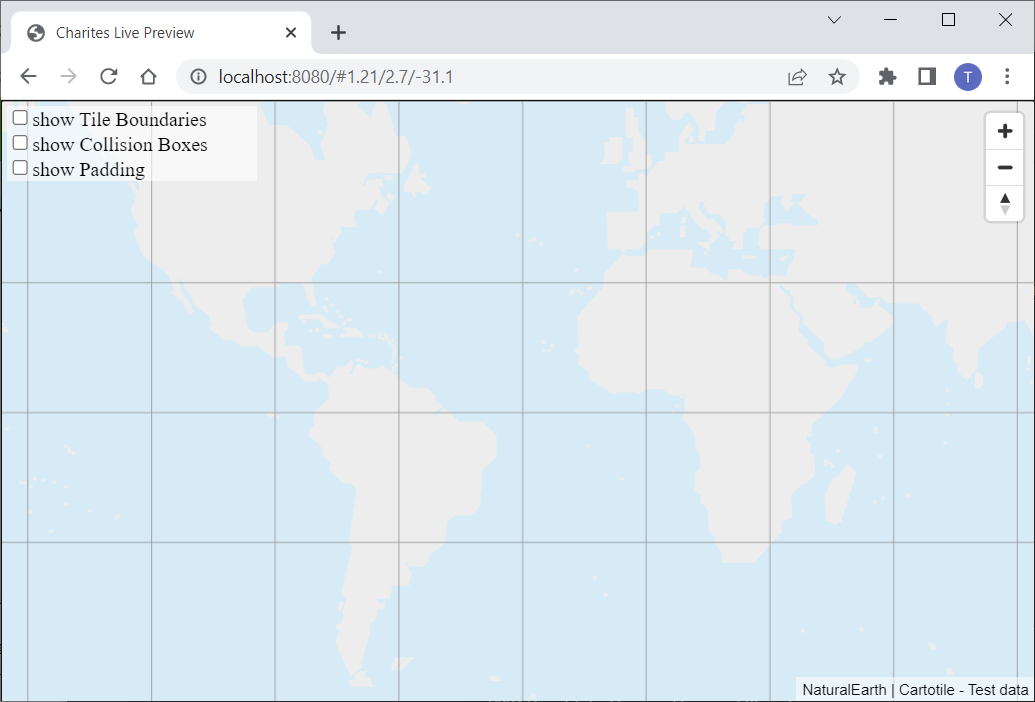
Then, you will see the map like this. My charites's version is a little older, but if your charites version is 0.3.0, you will see legend control in the lower left as well. The added polygon is for drawing purpose, and its geometry is not so accurate.
2-7. Add a layer: Addling another line, using "filter"
Next, we will add another line, and will use "filter" for the layer. Copy the line template as "ls-coastline.yml" and edit it as below. And, please also edit style.yml to add this layer between the grid30 layer and the landmass.
filter:
- '=='
- - get
  - bdytyp
- 0
id: ls-coastline
minzoom: 0
maxzoom: 5
paint:
  line-color: '#0000FF'
  line-width: 1
source: carto
source-layer: bndl
type: line
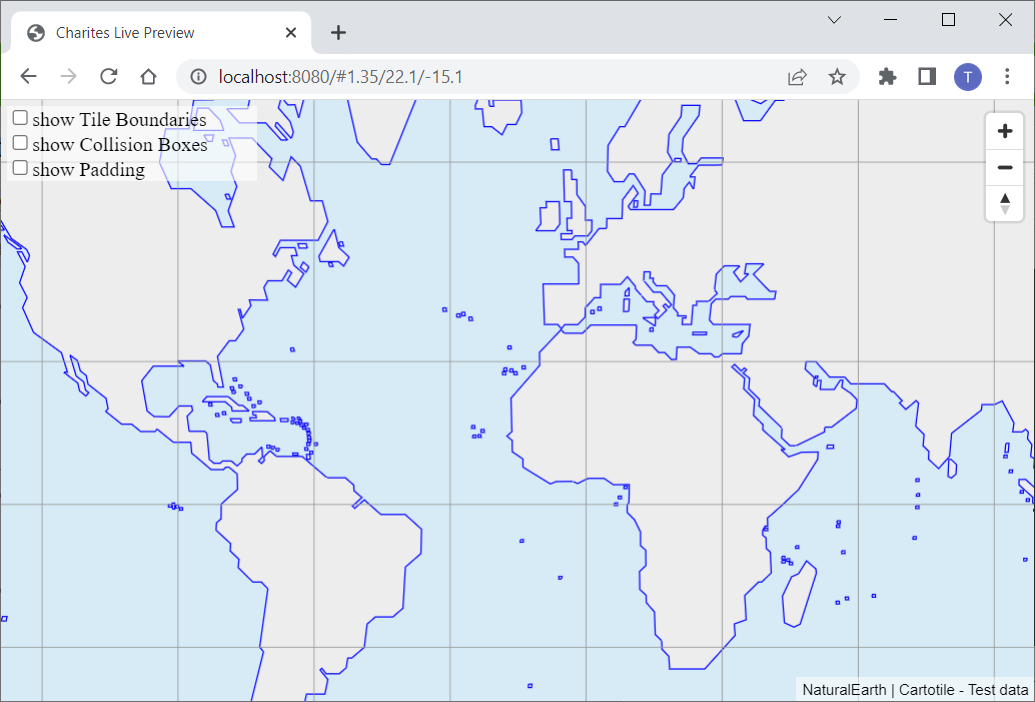
We used filter to filter the features with bdytyp=0. Try to change 0 to 1. There are many ways of using filter. If you are interested in the expressions, please read my another article (in Japanese) here with some tranlator.
And, you may also need to choose a good filter based on your map library.
- Our expression this time (recommended in MapLibre/MapBox): ["==",["get","bdytyp"],0]
- Expression used for ArcGIS Online (an example): ["==","bdytyp",0]
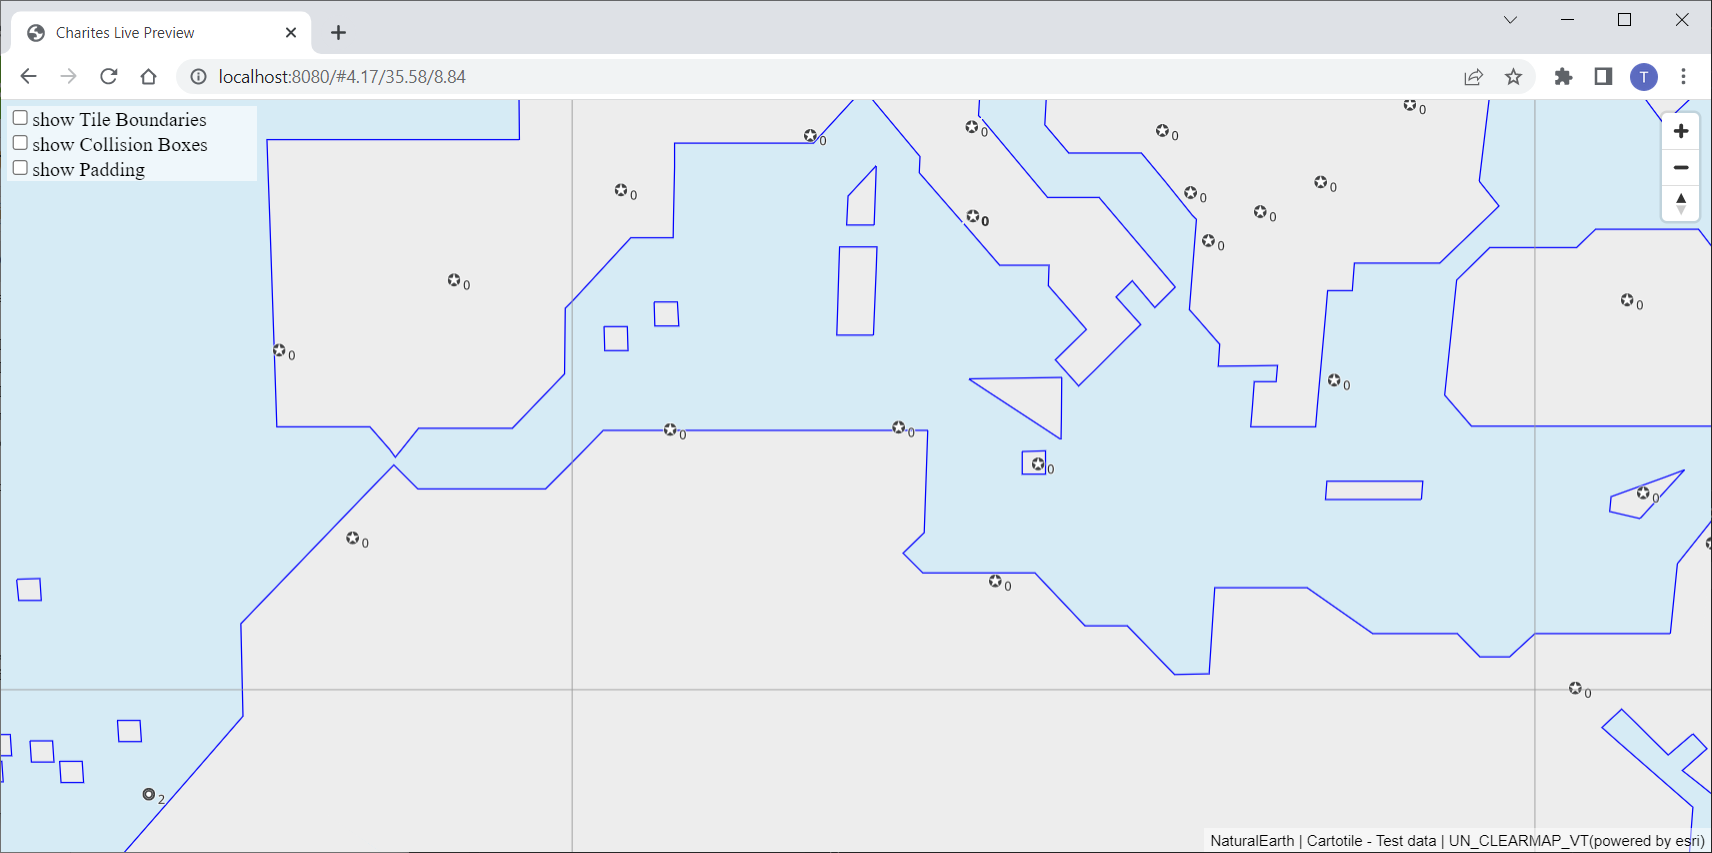
Now, you see the map like this.
2-8. Add a layer: Adding a symbol (with filter and match)
Lastly, let's try adding a symbol. We will use "filter" again, and will use "match" expression to use the icon based on the attribution.
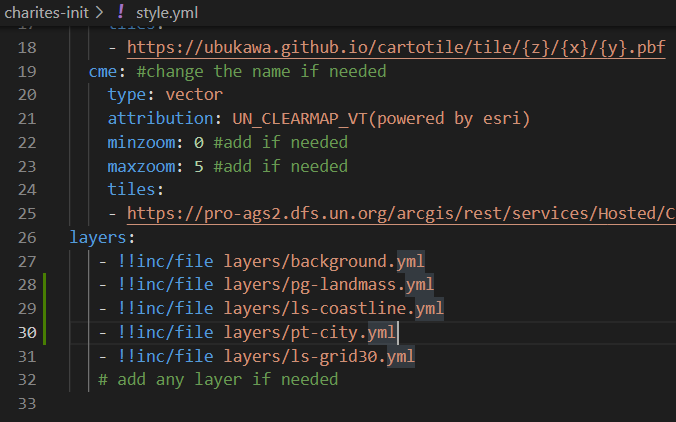
Please copy the symbol template (pt-symbol-sample.yml) as "pt-city.yml" and edit it as below, and add this layer in the style.yml between the grid and the coastline.
filter:
- match
- - get
  - _symbol
- - 0
  - 1 #Alternative
  - 2 #Territorial
- true
- false
id: pt-city
minzoom: 4
maxzoom: 5
layout:
  icon-allow-overlap: true
  icon-image:
  - match
  - - get
    - _symbol
  - 1
  - PPL_Alternative
  - 2
  - PPL_Territorial
  - PPL_National # for _symbol==0
  icon-size: 1
  text-allow-overlap: true
  text-optional: true
  text-field: '{_symbol}' #or [get, text_field] would be good.
  text-font:
  - Open Sans Regular #text font should be from glyphs
  text-size: 10
  text-anchor: bottom
  text-offset:
   - 1
   - 1
  #text-letter-spacing: 0.1
  #text-max-width: 50
paint:
  text-color: '#000000'
  text-halo-color: '#FFFFFF'
  text-halo-width: 0.8
source: cme
source-layer: Populated Places_SYMBOLS #polygon or line can be also used for labelling
type: symbol
I woudl like to explain a little about the above yaml (pt-city.yml):
- A filter is used to select the features with "_symbol" in [0, 1, 2]. You could also use a logical operatoer "in", but I simply used "match" expression here.
- For icon-image, "match" expression is used for allocating the icon-image based on "_symbol" attribution of the source. This "match" expression work for MapLibre GL JS and Mapbox GJ JS, but it may not work for ArcGIS API for JavaScript and QGIS plugin (I am not 100% sure especially for the latest versions.).
- For text-field, I just chose "_symbol" because it seems that the source vector tile layer does not have the city name. You can use two layers to display icon and label respectively, but you can also do it with a single layer if you have the name in it.
About the symbol layer, this time, we used "point" features as the source, but you can use other class such as line if you want.
Thus, we have seen how we can add line, polygon, point layer to the style.
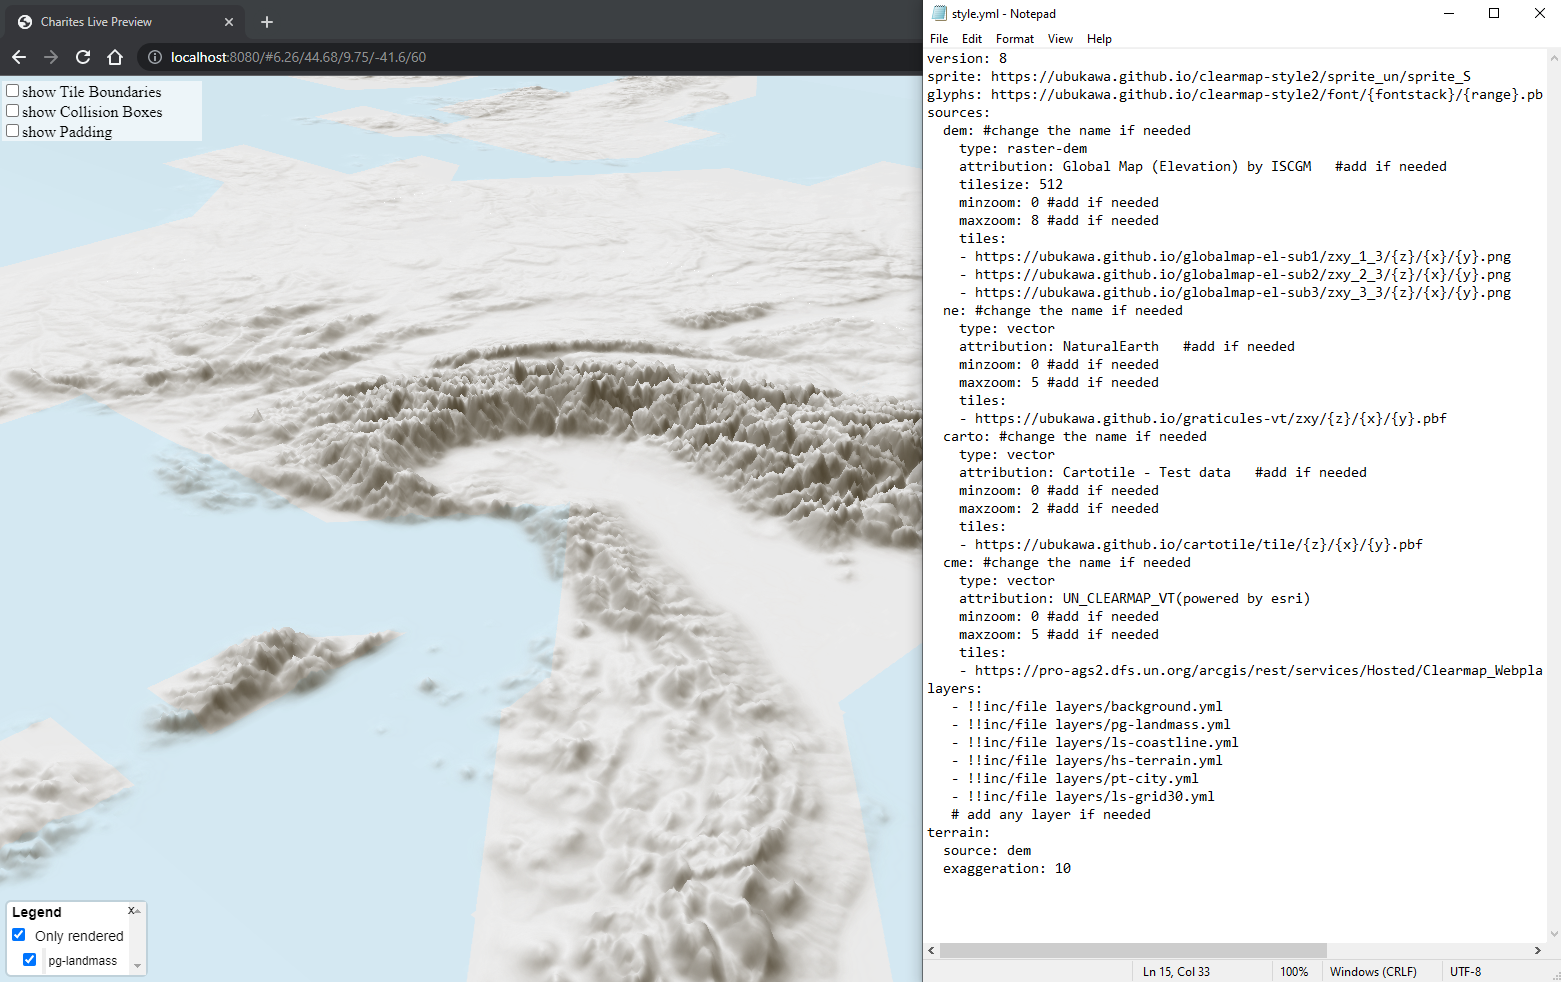
2-9. Additional Exercise (Added on 19 December 2022)
Now, we are updating unvt/charites so that it uses MapLibre GL JS ver. 2.4.0. With that you can see 3D terrain by adding raster-dem source and terrain to the style.yml. Please try if the charites is updated to the newer version in near future.
Exercise 3. Exporting JSON style from yaml files
Please stop your live preview, and go back to the command line. You can export your style from YAML to JSON.
charites build charites-init/style.yml out-style.json
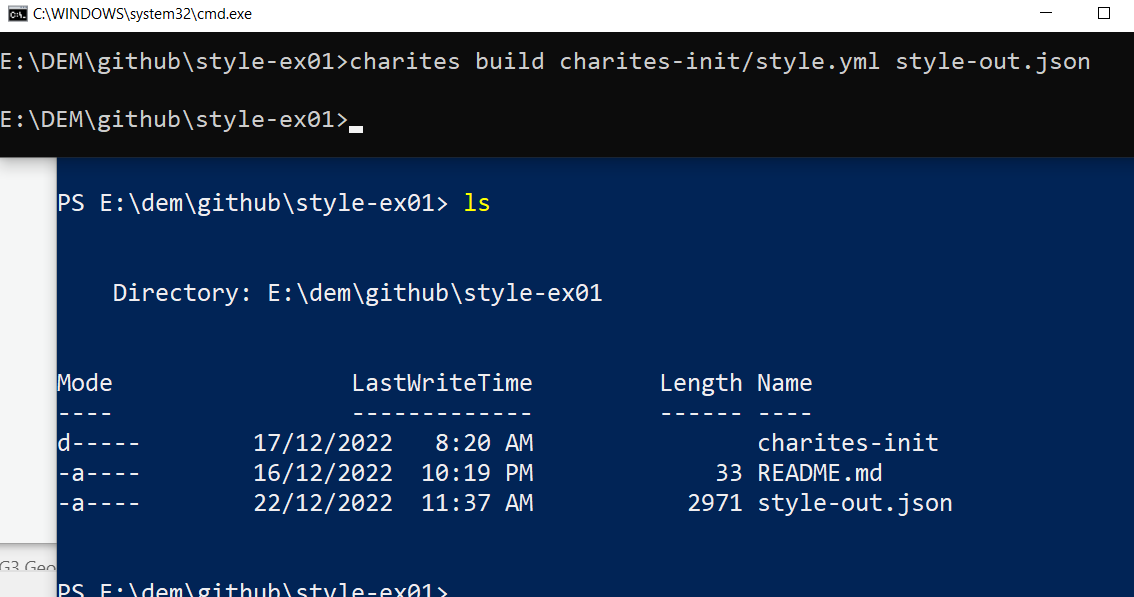
Then, you now have the edited style in JSON. Congratulations!!
(charites build may not work if there is some error in your style expression...)
Summary
This article explanined how we can edit a style (for Mapbox/MapLibre) with the UNVT tool named charites.
Refernces
- Tools
- unvt/charites: https://github.com/unvt/charites
- Repository
- the files used in this practice: https://github.com/ubukawa/style-ex01
- Others
- UN Open GIS Initiative: http://unopengis.org/unopengis/main/main.php
- UN Open GIS Initaitive - DWG7 (smart maps): https://github.com/UNopenGIS/7
- Mapbox style specification: https://docs.mapbox.com/mapbox-gl-js/style-spec/
- MapLibre style specification: https://maplibre.org/maplibre-gl-js-docs/style-spec/
- nodejs: https://nodejs.org/en/