はじめに
ここではオープンソースのマップライブラリであるMapLibreを使って、ベクトルタイルを表示してみます。簡単のために、例として地理院地図Vector(仮称)を扱いますので、スタイルも既存の地理院地図Vector(仮称)スタイルを使えます。おまけとしてゼロからスタイルを作成する場合も少しだけ書いておきます。
ベクトルタイルを使って日が浅い方や、ウェブ地図のライブラリを編集したことがあまりないような方も読めるようなメモです。
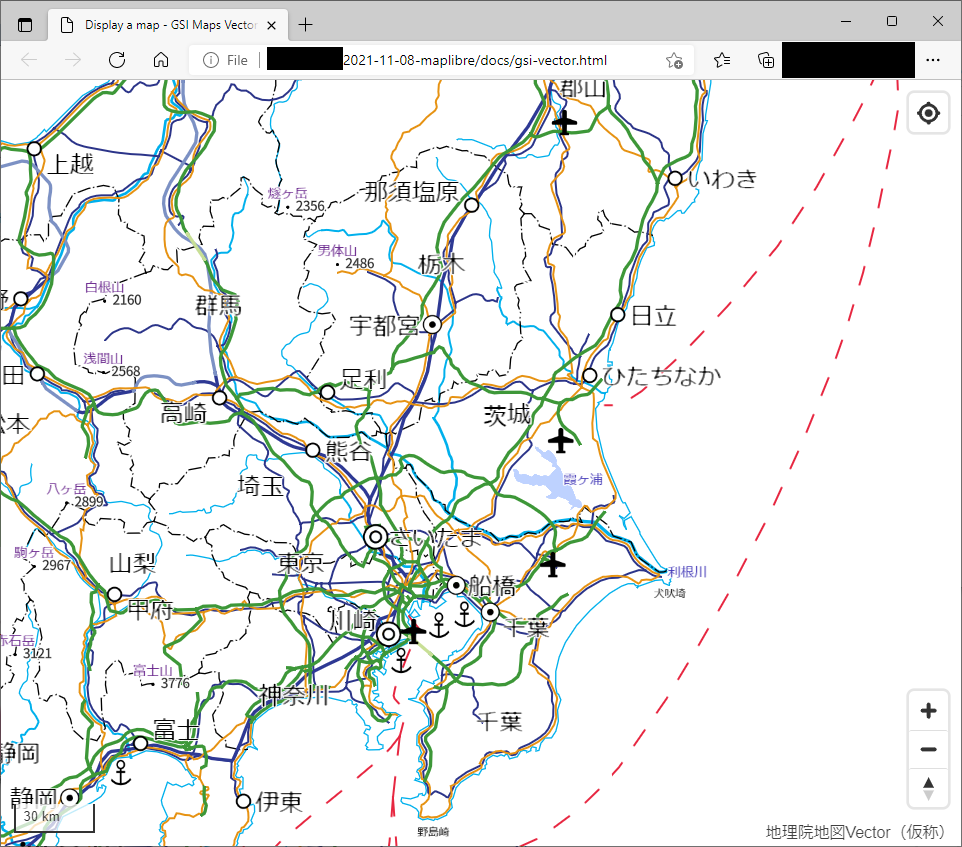
(こんな感じの地図が見られる)
MapLibreについて
MapLibreはオープンソースのマップライブラリで、ベクトルタイルの描画に利用できます。
2020年12月にmapbox gl jsライブラリのライセンスが変更となりましたが、このことを受けて生まれたオープンソースのライブラリとのことです(Pridal, 2021(at FOSS4G))。
MapLibre GL はオープンソースでなくなる前の(ライセンス変更前の)mapbox-gl-jsのライブラリをベースにしているので、mapbox gl js ver. 1.X を使っていた人は違和感なく利用できると思います。
地理院地図Vector(仮称)について
地理院地図Vector(仮称)で提供しているベクトルタイルは、出典を明示すれば、自分のサイトやアプリ等でも利用できるそうです。今回は、Mapbox GL JSで地理院地図Vector風の地図を表示するサンプルにあるmapboxスタイル仕様に準拠したスタイルファイルを使います。
作業環境
今回は以下のような環境で試しました。
- テキストエディタ(メモ帳)
- Google Chrome バージョン 95.0.4638.69(Official Build)
- PowerShell version 5.1.19041.1237 (curl.exeでダウンロードするのに使っただけ)
手順
Step 1. 利用するものの確認
-
ベクトルタイルのスタイル:
国土地理院情報普及課のGitHubレポジトリMapbox GL JSで地理院地図Vector風の地図を表示するサンプルから提供されているスタイル(地理院地図Vector風の地図)を使います。
https://gsi-cyberjapan.github.io/gsivectortile-mapbox-gl-js/std.json
淡色地図を使い対場合は、std.jsonをpale.jsonにします。 -
ライブラリ:
MapLibreを参照して使いますが、更新ログをみて、必要なバージョンを決めましょう。今は1.15.2で良さそうです。今回はmaplibreのライブラリを(maplibre-gl.js, maplibre-gl.css)をunpkgから参照することにします。(注:unpkgはnpmにあるものを配信してくれるfast, global content delivery networkです。) -
https://unpkg.com/maplibre-gl@1.15.2/dist/maplibre-gl.js
利用に際しては、ライセンスを読んでおきましょう。
Step 2. MapLibreのダウンロード(必須ではありません)
unpkgにあるライブラリのURLを直接参照する場合は不要ですが、もしもMapLibreのファイルをダウンロードして自分のサーバーに置いておきたい人はダウンロードをしてみます(curl)。私はwindows環境でWindows Powershellを使ったので、curl.exeとして実行してファイルをダウンロードしました。
curl.exe -O https://unpkg.com/maplibre-gl@1.15.2/dist/maplibre-gl.css
curl.exe -O https://unpkg.com/maplibre-gl@1.15.2/dist/maplibre-gl.js
Step 3. HTMLファイルの作成
MapLibreのサンプルなども参考に、以下のようにhtmlファイルを準備します。gsi-vector.htmlという名前をつけて、テキストエディタで編集しました。ここにアップロードしてあります。
初めて試してみる場合はあまり深く考えないで、styleの指定で見たい地図を指定すると理解しておくといいと思います。参照するスタイルは MapLibreのスタイル仕様(ほぼイコールmapbox のスタイル仕様)に基づいたものである必要があります。
<!DOCTYPE html>
<html>
<head>
<meta charset="utf-8" />
<title>Display a map - GSI Maps Vector (std)</title>
<meta name="viewport" content="initial-scale=1,maximum-scale=1,user-scalable=no" />
<script src="https://unpkg.com/maplibre-gl@1.15.2/dist/maplibre-gl.js"></script>
<link href="https://unpkg.com/maplibre-gl@1.15.2/dist/maplibre-gl.css" rel="stylesheet" />
<style>
	body { margin: 0; padding: 0; }
	#map { position: absolute; top: 0; bottom: 0; width: 100%; }
</style>
</head>
<body>
<div id="map"></div>
<script>
var map = new maplibregl.Map({
container: 'map', // container id
style: 'https://gsi-cyberjapan.github.io/gsivectortile-mapbox-gl-js/std.json', // style URL
center: [140.084556, 36.104611], // starting position [lng, lat]
zoom: 7, // starting zoom
maxZoom: 4, // min zoom
maxZoom: 17 // max zoom
});

//UI
map.addControl(new maplibregl.NavigationControl(), 'bottom-right');
map.addControl(new maplibregl.GeolocateControl({positionOptions: {enableHighAccuracy: true},trackUserLocation: true}), 'top-right');
map.addControl(new maplibregl.ScaleControl() );
//map.addControl(new maplibregl.AttributionControl({customAttribution: "custom attribution" })); // you can add

//debug
//map.showTileBoundaries = true;
//map.showCollisionBoxes = true;


</script>

</body>
</html>
(参考)上のhtmlファイルの中の小ネタ
mapのなかの要素を少し説明します。(詳細はこちら: MapLibre 又は mapbox)
- style: 参照する地図のスタイル
- center: (読み込んだときの)地図の中心の経度、緯度
- zoom: (読み込んだときの)地図のズームレベル
- minZoom: 地図の最小ズーム
- maxZoom: 地図の最大ズーム
そのほか、hash: true(ページのURLに位置情報を表示)や、RenderWorldCopies: false(地図の繰り返しをしない(経度-180~180度だけ))等をたまに使います。
あと、htmlファイルの下の方で、ユーザーインターフェースをいくつか追加しています。
縮尺や位置を移動するScaleControlやNavigationControlが追加されていますし、GeolocationControl(→自分の位置の表示)も追加されています。
また、地図のデザインの確認作業やタイルの位置やサイズを知りたいときは、今はコメントアウトしてありますが、showTileBoundariesやshowCollisionBoxes をつけておくと便利です。
Step 4. 地図(htmlファイル)のアップロード
作成したhtmlファイルをウェブサーバー等にアップロードすると地図が見られます。
GitHubページを使うと簡単にみられるのではないかと思います。
つくった地図はこちら https://ubukawa.github.io/plib-mlb01/gsi-vector.html
スタイルをいじってみたい方へ(おまけ)
上の説明では、既存のスタイルを使っていますが、せっかくなので地理院地図Vector(仮称)のデータを自分でスタイリングしたいという人もいると思います。
そんな人は、MapLibreやMapboxのstyle仕様と、地理院地図Vector(仮称)のベクトルタイル構成(地理院地図Vectorのベクトルタイル仕様のうち、特に地物コード)を参照しながら自分でスタイルを書いてたり、加工してみましょう。
下の例では、ベクトルタイルのソース、地図記号(sprite)、フォント(glyphs)を指定したあと、地図に読むレイヤとして背景を含めて5つのレイヤ(背景、海岸線、水部(面)、県境、国境)を書いています。下にあるレイヤの方が地図上では上に出てきます。データの利用における注意を守り、ベクトルタイルのソースの指定の際にきちんとattributionを書いて出展の明記が必要です。
簡単な例 https://ubukawa.github.io/plib-mlb01/test-style.json
{
  "version": 8,
  "name": "GSI test",
  "sources": {
    "v": {
      "type": "vector",
      "tiles": [
        "https://cyberjapandata.gsi.go.jp/xyz/experimental_bvmap/{z}/{x}/{y}.pbf"
      ],
      "minzoom": 4,
      "maxzoom": 16,
      "attribution":"<a href=\"https://maps.gsi.go.jp/vector/\" target=\"_blank\">地理院地図Vector(仮称)</a>"
    }
  },
  "sprite": "https://gsi-cyberjapan.github.io/gsivectortile-mapbox-gl-js/sprite/std",
  "glyphs": "https://maps.gsi.go.jp/xyz/noto-jp/{fontstack}/{range}.pbf",
  "layers": [
    {
      "id": "background",
      "type": "background",
      "paint": {"background-color": "#D6EBF5"}
    },
    {
      "id": "ls-coastline",
      "type": "line",
      "source": "v",
      "source-layer": "coastline",
      "minzoom": 4,
      "maxzoom": 9,
      "layout": {"visibility": "visible"},
      "paint": {"line-color": "#636566"}
    },
    {
      "id": "pg-watera",
      "type": "fill",
      "source": "v",
      "source-layer": "waterarea",
      "minzoom": 4,
      "maxzoom": 7,
      "paint": {"fill-color": "rgba(46, 0, 255, 1)"}
    },
    {
      "id": "ls-boundary-pref",
      "type": "line",
      "source": "v",
      "source-layer": "boundary",
      "minzoom": 6,
      "maxzoom": 8,
      "filter": ["all", ["==", "ftCode", 51212]],
      "layout": {"line-cap": "square"},
      "paint": {"line-color": "#000000", "line-dasharray": [10, 2, 1, 2]}
    },
    {
      "id": "ls-boundary-cty",
      "type": "line",
      "source": "v",
      "source-layer": "boundary",
      "minzoom": 4,
      "maxzoom": 8,
      "filter": ["all", ["==", "ftCode", 51221]],
      "layout": {"line-cap": "square"},
      "paint": {"line-color": "rgba(34, 24, 21, 1)"}
    }
  ]
}
作成したstyleファイル(json)はウェブサーバーでホストして参照しないといけません。ファイルシステム中で見ようとしても見られないと思いますので気をつけましょう。
そんなようにして自分なりのスタイルで作った地図の例がこちらです。
https://ubukawa.github.io/plib-mlb01/gsi-vector-test.html
スタイルについてはテキストエディタで書いていてもいいですし、maputnikで少し相場観をつかんだ後に、UNVTのcharitesなどを使ってみてもいいと思います。