はじめに
動機
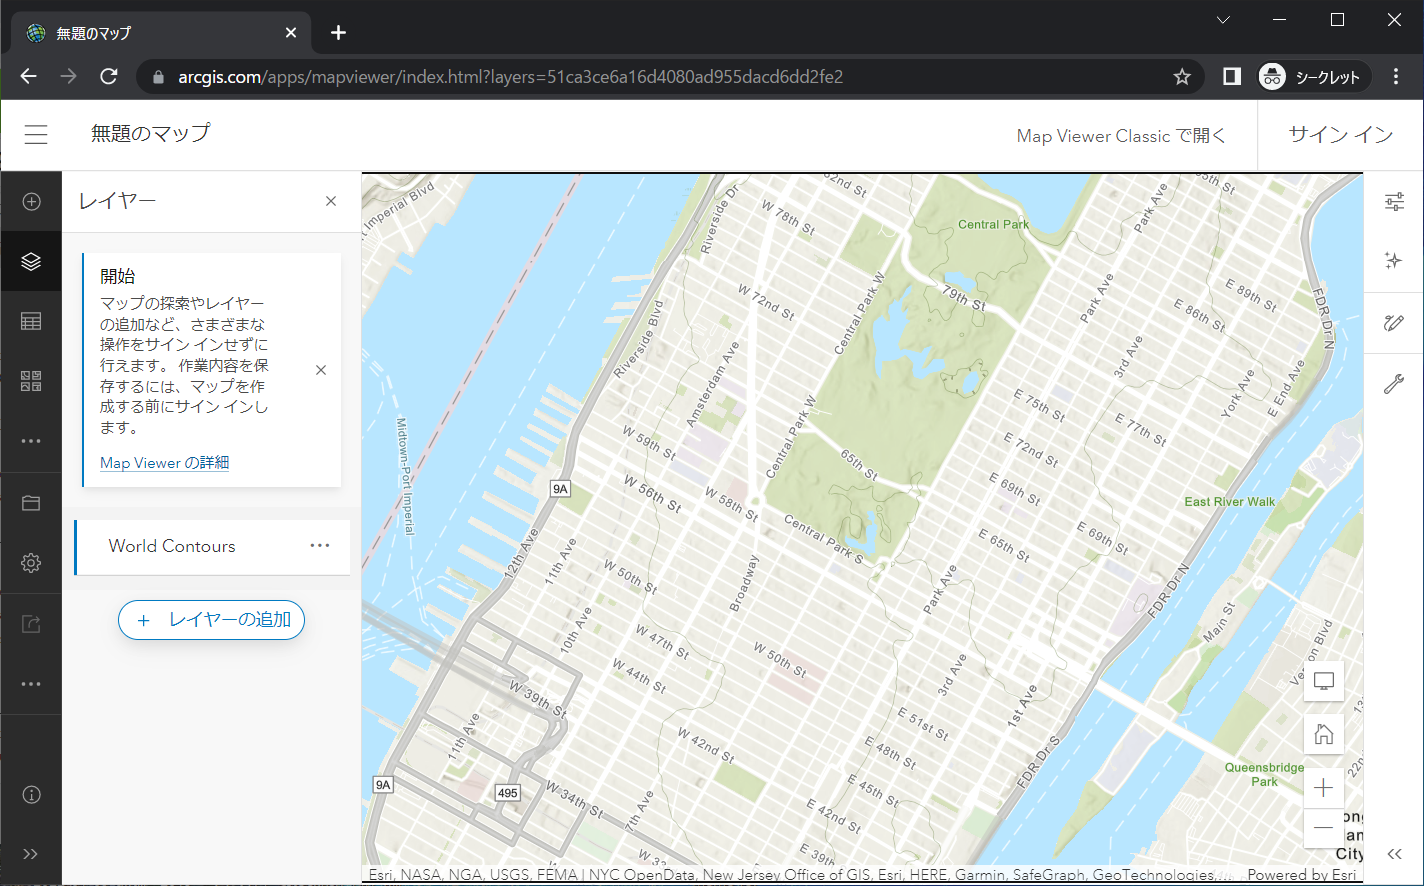
派遣先の同僚がArcGIS OnlineでEsriさんのWorld Contour v2をつかっているのですが、中身がどんな感じか少し見てみたいと思います。
データについて
Esriさんは等高線(Contour)のデータをベクトルタイルとして提供しています。ウェブサイトから誰でも見られるようです。
https://www.arcgis.com/home/item.html?id=51ca3ce6a16d4080ad955dacd6dd2fe2
概要
ESRIさんによると、以下の通りです。
This vector tile layer provides a detailed global contour set with labels. Contours are in meters (for most of the world) and feet (for the 48 contiguous US states plus Hawaii). They are visible from LOD11 (~1:144K) to the largest scale. The source of the vector tiles in this layer is World_Contours_v2. This vector tile layer contains the same content and style used in the World Topographic Map (with Contours) tile layer, which is delivered as a multisource map style designed for the new Map Viewer.
ポイントをまとめます
- 等高線とラベルが含まれている。
- 世界の大半でメートル単位だが、フィート単位の所もある。
- LOD(Level of Detail → ズームレベル)11より大縮尺で見られる。14.4万分の1以上の縮尺。
Use this map
こちらについては以下の記述です。
You can add this layer to a web map and save as your own map. You can also combine this layer's json with the json of another vector tile layer as part of a multisource tile layer that can be viewed with the new Map Viewer (Beta), or the latest versions of Pro or Runtime.
ウェブマップに加えて作ることができると書いてあります。後ほど言及しますが、利用規約があるのでEsriさんのプロダクトの範囲内という制限がつくと思います。
Customize this Map
こちらについては以下の記述です。こちらもEsriさんのプロダクトの範囲内という制限がつくと思います。
Because this map is delivered as a vector tile layer, users can customize the map to change its content and symbology, including fonts. Users are able to turn on and off layers and change symbols for layers. See the Vector Basemap group for other vector tile layers. For details on how to customize this map, please refer to these articles on the ArcGIS Online Blog and view the Esri Vector Basemaps Reference Document.
注意点
Important Note: This item is in beta and is not intended for use in production applications. とのことで、ベータ版ということでまだ本番のアプリ用ではないようです。
利用規約
上記の注意に加えて、利用にあたっては、This work is licensed under the Esri Master License Agreement. とありまして、ESRIさんの利用規約によるので、このデータはおそらくArcGISプロダクト以外には利用できないポリシーだと思います。(以下の3章あたりに要注意)
(参考) 日本語版
https://www.esri.com/content/dam/esrisites/en-us/media/legal/ma-translations/japanese.pdf
スタイルのチェック
以下のURLに、スタイル情報があるので見てみます。
https://www.arcgis.com/sharing/rest/content/items/51ca3ce6a16d4080ad955dacd6dd2fe2/resources/styles/root.json?f=pjson
Source
ベクトルタイルで提供されていますが、urlが
https://basemaps.arcgis.com/arcgis/rest/services/World_Contours_v2/VectorTileServer
となっています。tilesで指定するとパスは
https://basemaps.arcgis.com/arcgis/rest/services/World_Contours_v2/VectorTileServer/tile/{z}/{y}/{x}.pbf
ですね。
Layer
スタイルレイヤは16レイヤありました。簡単にいうと、4つのズームレベル範囲に、主曲線、計曲線、凹地表現、ラベル、の4つのレイヤがあるようです。
各レイヤの情報は以下の通りです。(おもなものだけ。レイヤ名の「/0」は省略。並び順は下から)
| 並び順 | レイヤ名 | ズームレベル | タイプ | フィルター |
|---|---|---|---|---|
| 1 | Contour_11_main | 11-12 | Line | index3==1 かつ index5==1 |
| 2 | Contour_11 | 11-12 | Line | index3==1 かつ index5==0 |
| 3 | Depression_11 | 11-12 | Symbol | index3==1 かつ index5 in [1,0] かつ depression==1 |
| 4 | Contour_12_main | 12-14 | Line | index2==1 かつ index4==1 |
| 5 | Contour_12 | 12-14 | Line | index2==1 かつ index4==0 |
| 6 | Depression_12 | 12-14 | Symbol | index2==1 かつ index4 in [1,0] かつ depression==1 |
| 7 | Contour_13_main | 14-16 | Line | index1==1 かつ index3==1 |
| 8 | Contour_13 | 14-16 | Line | index1==1 かつ index3==0 |
| 9 | Depression_13 | 14-16 | Symbol | index1==1 かつ index3 in [1,0] かつ depression==1 |
| 10 | Contour_14_main | 16- | Line | index2==1 |
| 11 | Contour_14 | 16- | Line | index2==0 |
| 12 | Depression_14 | 16- | Symbol | index2 in [1,0] かつ depression==1 |
| 13 | Contour_11_main_text | 11-12 | Symbol | index3==1 かつ index5==1 |
| 14 | Contour_12_main_text | 12-14 | Symbol | index2==1 かつ index4==1 |
| 15 | Contour_13_main_text | 14-16 | Symbol | index1==1 かつ index3==1 |
| 16 | Contour_14_main_text | 16- | Symbol | index2==1 |
観察
- 面白いことに、レイヤ名にある数字と実際表示されるズームレベルがずれている。
- index1~index5までを使っています。細かくみると、それぞれのインデックスが特定のズームレベルに対応しているかどうかを示しているのだろうなぁと思います。
- index5が1のものが一番小縮尺で使われるもののようです。(index5はズームレベル11~12あたりで、メインの等高線にするか普通の等高線にするかの区分けになるようです。)
- index4が1のものが次の小縮尺で使われるもののようです。(index4はズームレベル12~14あたりで、メインの等高線にするか普通の等高線にするかの区分けになるようです。)
- 凹地に使われているシンボルは1種類だけでした。(depressiopn/0)
- 日本語の計曲線と主曲線のイメージと少し違う。mainと書いてある線の方が太いもので、日本語でいうところの計曲線になると思う。
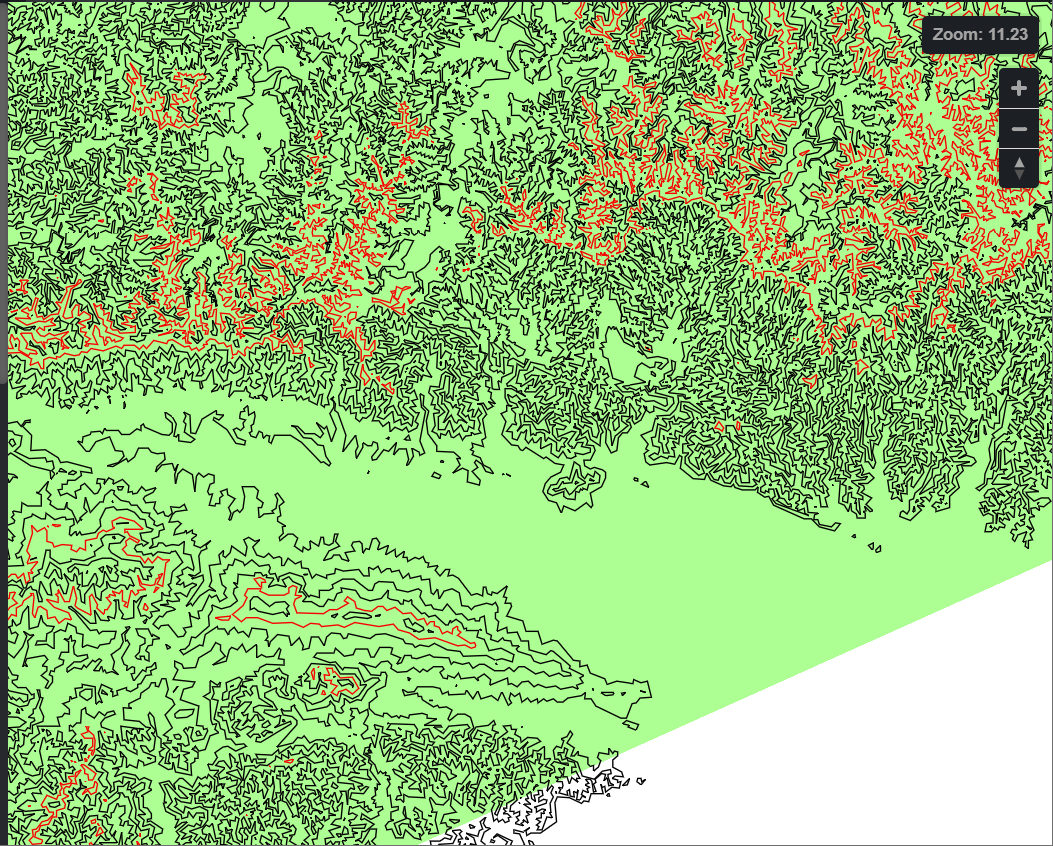
Index5が1のもの(赤)とそれ以外(黒)
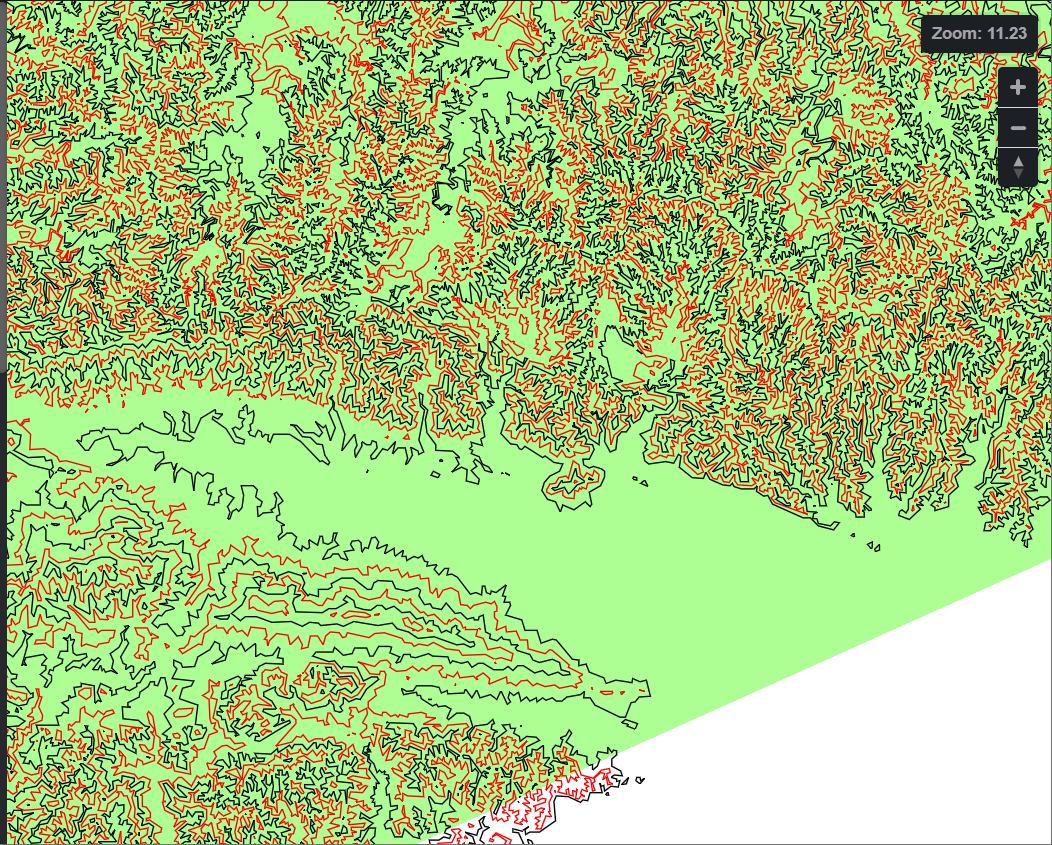
Index4が1のもの(赤)とそれ以外(黒)
少しズームレベルを上げますが、Index3が1のもの(赤)とそれ以外(黒)
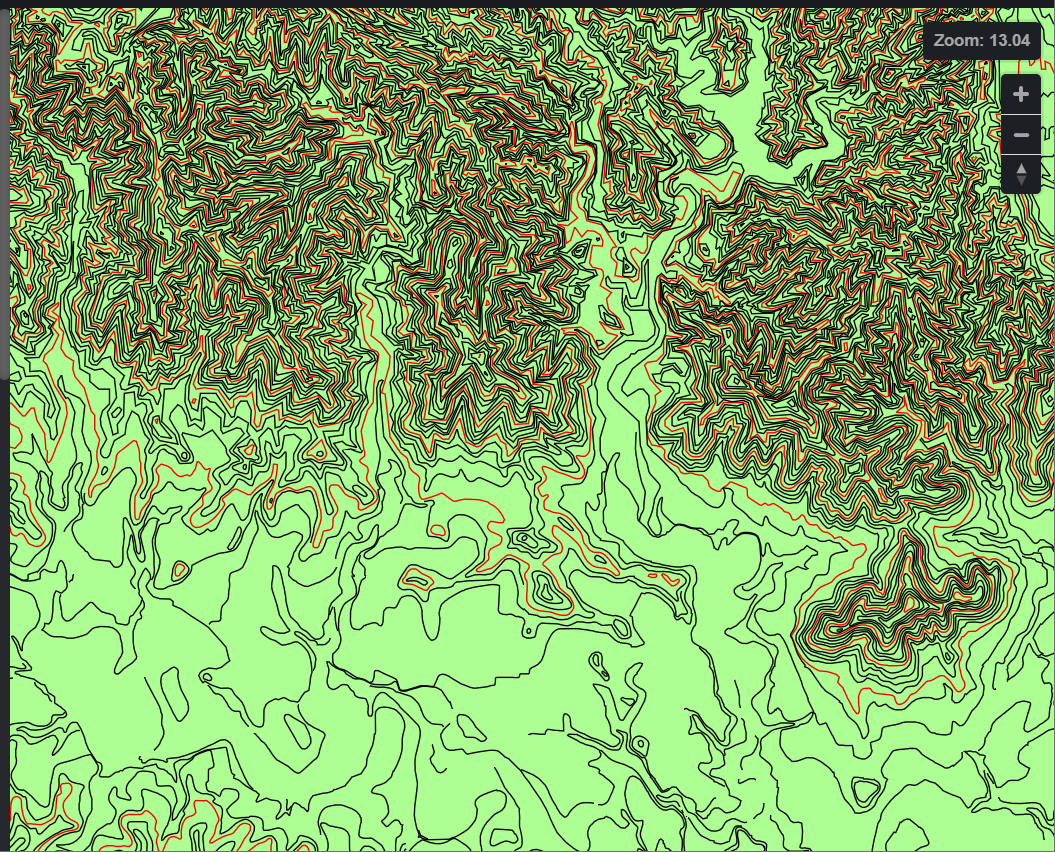
上と同じ範囲で、Index2が1のもの(赤)とそれ以外(黒)
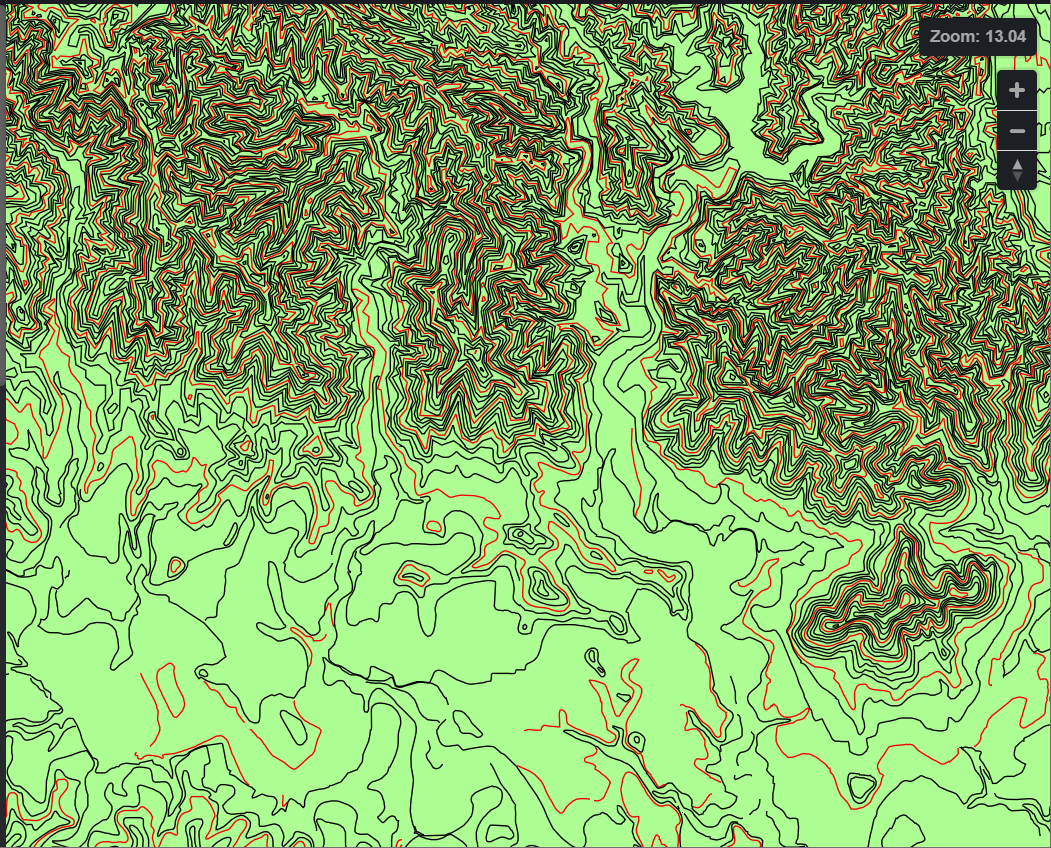
という感じでした。イメージがつかめました。
Sprites
以下のURLを参照しています。
https://cdn.arcgis.com/sharing/rest/content/items/18d32a699af64bfba4e78eba5a4dd705/resources/sprites/sprite
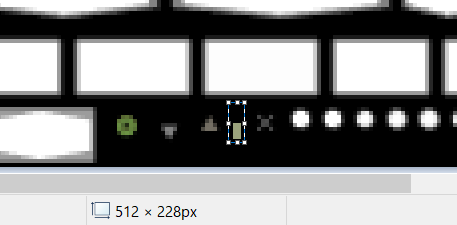
jsonファイル(https://cdn.arcgis.com/sharing/rest/content/items/18d32a699af64bfba4e78eba5a4dd705/resources/sprites/sprite.json )をみるとたくさん地図記号がありますが、等高線で使っているのは "Depression/0":{"x":220,"y":212,"width":4,"height":10,"pixelRatio":1,"sdf":false}, だけです。
pngファイルの所定の座標のところの画像を使っているという訳です。
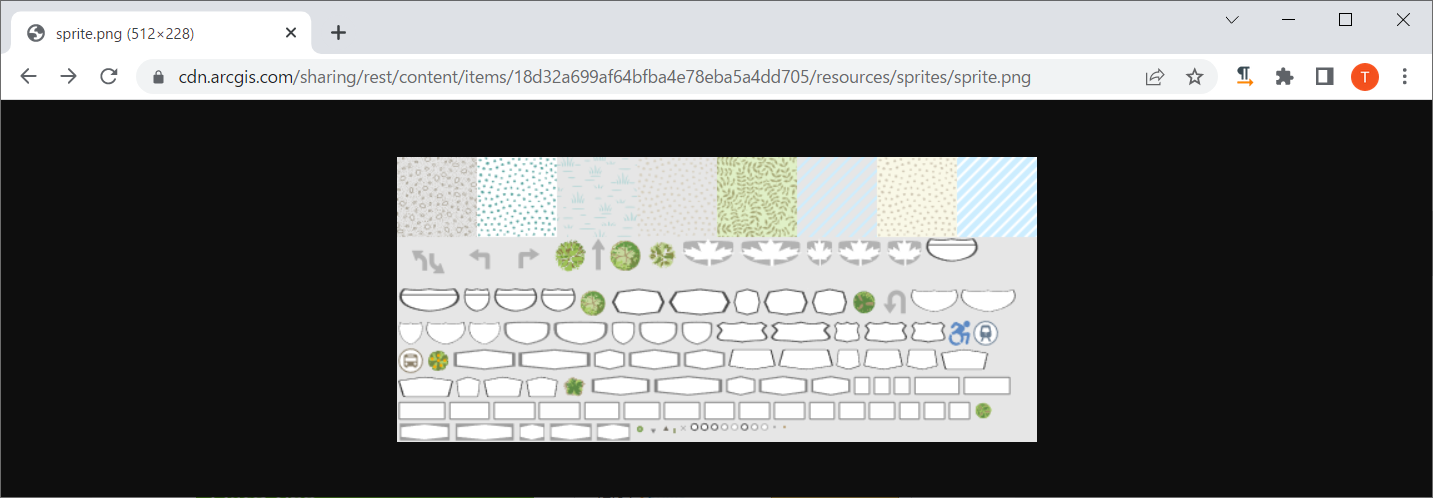
の下の方の あそこ↓ ですね。
まとめ
どんな感じで等高線のベクトルタイルが提供されているのか見てみました。
謝辞
グローバルな等高線のベクトルタイルデータをArcGIS環境で使えるようにしてくれているEsriさんに感謝します。
参考
World Contours (Esri) https://www.arcgis.com/home/item.html?id=51ca3ce6a16d4080ad955dacd6dd2fe2