Introduction
In this document, I would like to introduce how we can read the geospatial data from PostgreSQL/PostGIS data base and convert it to vector tile format.
The most part of this work was done as my activities of the DWG 7 working group in the UN Open GIS Initiatve. This text was originally written for my dear colleagues, M.T., O.M.S., and P.F.
Environment
- nodejs ver 16 or 18
- npm
- felt/tippecanoe or mapbox/tippecanoe
My working repository for this work is here: https://github.com/unvt/produce-cmv
Basic strategy
We often use the approach consisted of three steps.
They are 1) reading the data from PostgreSQL/PostGIS to export them as GeoJSON, 2) edit the exported GeoJSON sequence to adjust them for vector tile conversion, and 3) actual vector tile conversion with tippecanoe.
You can skip reading them all, but the followings are our basic strategy for each step:
-
1) Data reading: Data reading from PostgreSQL/PostGIS server
- we use nodejs, specifically a npm module named "pg", to read the data from PostgreSQL/PostGIS server.
- We read the PostGIS data view by view (or table by table).
- If needed, we may use bounding boxes to control the max size of the output files (in particular, for large global data set, we divide the whole globe into 931 regions). From our experience, creating "a few GB * several hundred files" is faster than "several hundred GB * single file."
- Both propeties and geometory (ST_AsGeoJSON) are just listed as columns in the data from PostGIS. With ST_AsGeoJSON, geometory (geom) is exported in GeoJSON geometry.
- To save the processing time, exported sequence will not be save as an intermediate file. They are piped into the next step.
-
2) Re-structure: Data modification with nodejs
- As said above, both propeties and geometory (ST_AsGeoJSON) from a view/table are just listed as columns in the data from PostGIS. We will re-strucutred them.
- The geometory (ST_asGeoJSON) should be under the geometry object, and other information would be under the properties object.
- In addition, we need to add tippecanoe related information such as layer name and max/min zoom.
- During this process, we can also flexiliby edit these properties using simple javasciript. For example, even from a single view/table, based on its certain properties, we can classify the records into more than 2 vector tile layers.
- To save the processing time, exported sequence will not be save as an intermediate file. They are piped into the next step.
- As said above, both propeties and geometory (ST_AsGeoJSON) from a view/table are just listed as columns in the data from PostGIS. We will re-strucutred them.
-
3) Conversion: We will create vector tile using a tool named tippecanoe.
- tippecanoe was originally developed by mapbox (mapbox/tippecanoe), but recently it is mainly maintained and updated by felt (felt/tippecanoe)
- tippecanoe works on linux environment (and maybe on Mac OS). In order to run tipeecanoe in the Windows environment, we may use Docker or windows subsystem for Linux. You can use it on Raspberry Pi OS if you have it (recommended for a small data).
- The source data should be in GeoJSON sequence (or GeoJSON) format befor piped into tippecanoe. In addition, each feature record (given it is "f") should have information for tippecanoe such as layer name (f.tippecanoe.layer), max and min zoom (f.tippecanoe.maxzoom, f.tippecanoe.minzoom). We can add those arribution when we run the tippecanoe command, but we can flexibly design the vector tile structure by modifying GeoJSON sequences before they are forwarded into tippecanoe. This is why we use nodejs to read the data from PostgreSQL/PostGIS.
Note: We may use ST_AsMVT to generate vector tile in MVT (mapbox vector tiles) format. But we want to edit the structure of vector tile. So, we export the data as GeoJSON sequence and edit them.
Practice
Preparation
If you run nodejs on WindowsPowershell without the access to the tippecanoe, you can follow until the practice 5.
In a case you want to use a Docker in the windows environment to try with tippecanoe, use unvt/nanban package with the following command.
docker run -it --rm -v ${PWD}:/data unvt/nanban
cd /data
Practice 1: Reading data from PostgreSQL/PostGIS data using nodejs
git clone https://github.com/unvt/produce-cmv
cd produce-cmv
npm install
cp config/default-sample.hjson default.hjson
Then, edit your config/default.hjson. For the first test, we use only "releations" and "connections." Please fill them based on your database.
In the relations, please list database::schema::view(table) that you want to access. If you do not know the schema, it could be "public."
In the connection, please make object for each database and describe host, port, dbUser, and dbPassword.
(Please pay enough attention because you store your password, etc in the hjson file. Please do not upload it in the Internet.)
{
    relations: [
        un_base::vectortile::custom_planet_land_08_a
        un_base::vectortile::custom_planet_ocean_08_a
        un_base::vectortile::un_glc30_global_lc_ss_a
    ]
    connection:{
        un_base:{
            host: localhost
            port: 5432
            dbUser: user
            dbPassword: password
        }
        osm_planet:{
            host: localhost
            port: 5432
            dbUser: user
            dbPassword: password
        }
    }
}
Then, run the test001.js.
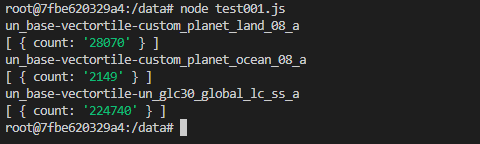
node test001.js
You will see the name of data source and the number of records acuired by sql in test001.js.
Explanation of test001.js:
This is a simple code to test the access to the data base. We use sql query to ask the number of record in each view.
- Constants are from config/default.hjson using a npm module named "config."
- It also uses pg module to access PostgreSQL/PostGIS database.
- For each database, there is pool[database] to store the necessary information for accessing database.
- pool[database].connect is a function to connect PostgreSQL/PostGIS database. Within it, we use client.query to received a result of a query.
Try changing the sql and check the result. And also try to see "res" instead of res.rows so that you can understand the structure of res (result from clinent.query()).
const config = require('config')
const { Pool, Query } = require('pg')

// config constants
const relations = config.get('relations')

let pools = {}

for (relation of relations){
    const [database, schema, view] = relation.split('::')
    if(!pools[database]){
        pools[database] = new Pool({
            host: config.get(`connection.${database}.host`),
            user: config.get(`connection.${database}.dbUser`),
            port: config.get(`connection.${database}.port`),
            password: config.get(`connection.${database}.dbPassword`),
            database: database
        })
    }
    pools[database].connect(async (err, client, release) => {
        if (err) throw err
        let sql = `SELECT count(*) FROM ${schema}.${view} `
        //let sql = `SELECT * FROM ${schema}.${view} limit 1`
        let res = await client.query(sql)
        console.log(`${database}-${schema}-${view}`)
        console.log(res.rows) //rows contains sql response
        await client.end()
        release()
    })
}
Practice 2: Reading data from PostgreSQL/PostGIS data using nodejs, using sql twice
Next, let's run the another script.
node test002.js
You will see one record with its columns from each view you specified.

Explanation of test002.js:
This is a simple code to ask a list of columns, and SELECT them. To ease the test, the SELECT sql uses "LIMIT 1".
- After connecting to the database, we first send a query to get the list of cloumn name, that is "SELECT column_name FROM information_schema.columns WHERE ... ". Then, obtained columns are mapped as a list, while geom is replaced with ST_AsGeoJSON.
- Then, with the obtained list, the second sql is prepared to select the columns from the records.
Try chaning sql, deleting "LIMIT 1" in the line 31 for exmaple, to see the result. You will find that you have to wait for a while if you have a lot of record in a view.
const config = require('config')
const { Pool, Query } = require('pg')

// config constants
const relations = config.get('relations')

let pools = {}

for (relation of relations){
    const [database, schema, view] = relation.split('::')
    if(!pools[database]){
        pools[database] = new Pool({
            host: config.get(`connection.${database}.host`),
            user: config.get(`connection.${database}.dbUser`),
            port: config.get(`connection.${database}.port`),
            password: config.get(`connection.${database}.dbPassword`),
            database: database
        })
    }
    pools[database].connect(async (err, client) => {
        if (err) throw err
        //Getting the list of columns, then adjust it
        let sql = `SELECT column_name FROM information_schema.columns WHERE table_schema = '${schema}' AND table_name = '${view}' ORDER BY ordinal_position`
        let cols = await client.query(sql)
        cols = cols.rows.map(r => r.column_name).filter(r => r !== 'geom') //choose "rows", then its colum_names are listed, and geom is removed.
        //we will add filter if needed
        cols.push(`ST_AsGeoJSON(${schema}.${view}.geom)`)
        //console.log(`columns used: ${cols}`)
        // Then, we will get feature record.
        await client.query('BEGIN')
        sql = `SELECT ${cols.toString()} FROM ${schema}.${view} LIMIT 1`
        cols = await client.query(sql)
        console.log(`${database}-${schema}-${view}`)
        console.log(cols.rows)
        await client.query('COMMIT')
        await client.end()
    })
}
Practice 3: Reading data from PostgreSQL/PostGIS data using nodejs, using cursor
In the previous practice, you noticed that you have to wait for a while. So, it is important to use cursor when we ask a query for large view/table.
Please add "fetchSize: 30000" in config/default.hjson, and run the following command.
node test003.js
Then, you see countinuous output running in the terminal.

Explanation of test003.js:
- With this scirpt, we added a cursor (cur) for sql query and read the data using cursor.
- Thre is a "fetch" function that is for reading certain amount of data from the cursor using "FETCH ${fetchSize} FROM cur".
- There is a countor in fetch function. When it gets empty, the fetch counter stays 0 and fetch ends.
- And for the obtained row, we make f, with necessary information (f.type, f.properties, f.geometry)
- At the end of each fetch, we just export record or "f" to the display using console.log(f), but you may also add a stream to write them to the file or pipe to other function.
- If we careate modify.js module and add a line "f = modify(f)", we can further edit the exported record. Thus, we can add necessary information for tippecanoe conversion.
const config = require('config')
const { Pool, Query } = require('pg')

// config constants
const relations = config.get('relations')
const fetchSize = config.get('fetchSize')

let pools = {}

const fetch = (client, database, view) =>{
    return new Promise((resolve, reject) => {
        let count = 0
        let features = []
        client.query(new Query(`FETCH ${fetchSize} FROM cur`))
        .on('row', row => {
            let f = {
                type: 'Feature',
                properties: row,
                geometry: JSON.parse(row.st_asgeojson)
            }
            delete f.properties.st_asgeojson
            f.properties._database = database
            f.properties._view = view
            count++
            //f = modify(f)
            if (f) features.push(f)
        })
        .on('error', err => {
            console.error(err.stack)
            reject()
        })
        .on('end', async () => {
            for (f of features) {
                try {
                    console.log(f)
                } catch (e) {
                    throw e
                }
            }
            resolve(count)
        })
    })
}

for (relation of relations){
    var startTime = new Date()
    const [database, schema, view] = relation.split('::')
    if(!pools[database]){
        pools[database] = new Pool({
            host: config.get(`connection.${database}.host`),
            user: config.get(`connection.${database}.dbUser`),
            port: config.get(`connection.${database}.port`),
            password: config.get(`connection.${database}.dbPassword`),
            database: database
        })
    }
    pools[database].connect(async (err, client,release) => {
        if (err) throw err
        //Getting the list of columns, then adjust it
        let sql = `SELECT column_name FROM information_schema.columns WHERE table_schema = '${schema}' AND table_name = '${view}' ORDER BY ordinal_position`
        let cols = await client.query(sql)
        cols = cols.rows.map(r => r.column_name).filter(r => r !== 'geom') //choose "rows", then its colum_names are listed, and geom is removed.
        //we will add filter if needed
        cols.push(`ST_AsGeoJSON(${schema}.${view}.geom)`)
        //console.log(`columns used: ${cols}`)
        // Then, we will get feature record.
        await client.query('BEGIN')
        sql = `
        DECLARE cur CURSOR FOR
        SELECT ${cols.toString()} FROM ${schema}.${view}`
        cols = await client.query(sql)
        //console.log(cols.rows)
        try {
            while (await fetch(client, database, view) !== 0) {}
        } catch (e) { throw e }
        await client.query(`COMMIT`)
        //await client.end()
        const endTime = new Date()
        var diff = endTime.getTime() - startTime.getTime();
        var workTime = diff / 1000
        console.log(`workingTime for ${schema}.${view} in ${database} is ${workTime} (sec). End`)
        release()
    })
}
Practice 4: Reading data from PostgreSQL/PostGIS data using nodejs, using cursor, modify the result
After editing modify.js, try running test004.js. It is almost same with the test003.js, but the module modify.js is added.
modify.js might be the following. Edit it based on your inputs and your desired vector tile structure.
const preProcess = (f) => {
  f.tippecanoe = {
    layer: 'other',
    minzoom: 5,
    maxzoom: 5
  }

const postProcess = (f) => {
if(f!==null){
  delete f.properties['_database']
  delete f.properties['_table']
}
  return f
}

const lut = {
  view_name: f => {
    f.tippecanoe = {
      layer: 'layer1',
      minzoom: 0,
      maxzoom: 5
    }
    delete f.properties['objectid']
    delete f.properties['fid_1']
    //or any edit you like
    return f
  }
//add filter for every layer
}
module.exports = (f) => {
  return postProcess(lut[f.properties._table](preProcess(f)))
}
Output sequence may have a good structure for vector tile creation.

Practice 5: Reading data from PostgreSQL/PostGIS data using nodejs, using cursor, modify the result, and export as text file
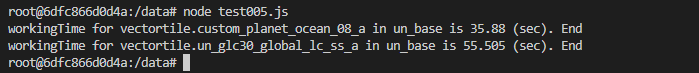
After adding a line "outputDir: outputDir" in config/default.hjson, make "ouputDir", and run test005.js. You will get GeoJSON sequence in separate text files.

In test005.js, I used the "fs" modules to make a stream.write to a text file. A stream is created by the fs.createWriteStream function for each view. "noPressureWrite" is a function to write stream.
const config = require('config')
const { Pool, Query } = require('pg')
const modify = require('./modify.js')
const fs = require('fs')

// config constants
const relations = config.get('relations')
const fetchSize = config.get('fetchSize')
const outTextDir = config.get('outputDir')

let pools = {}

const noPressureWrite = (stream, f) => {
    return new Promise((res) => {
        if (stream.write(`\x1e${JSON.stringify(f)}\n`)){
            res()
        } else {
            stream.once('drain', () => {
                res()
            })
        }
    })
}

const fetch = (client, database, view, stream) =>{
    return new Promise((resolve, reject) => {
        let count = 0
        let features = []
        client.query(new Query(`FETCH ${fetchSize} FROM cur`))
        .on('row', row => {
            let f = {
                type: 'Feature',
                properties: row,
                geometry: JSON.parse(row.st_asgeojson)
            }
            delete f.properties.st_asgeojson
            f.properties._database = database
            f.properties._view = view
            f.properties._table = view
            count++
            f = modify(f)
            if (f) features.push(f)
        })
        .on('error', err => {
            console.error(err.stack)
            reject()
        })
        .on('end', async () => {
            for (f of features) {
                try {
                    //console.log(f)
                    await noPressureWrite(stream, f)
                } catch (e) {
                    throw e
                }
            }
            resolve(count)
        })
    })
}


for (relation of relations){
    var startTime = new Date()
    const [database, schema, view] = relation.split('::')
    const stream = fs.createWriteStream(`${outTextDir}/${database}-${schema}-${view}.txt`)
    if(!pools[database]){
        pools[database] = new Pool({
            host: config.get(`connection.${database}.host`),
            user: config.get(`connection.${database}.dbUser`),
            port: config.get(`connection.${database}.port`),
            password: config.get(`connection.${database}.dbPassword`),
            database: database
        })
    }
    pools[database].connect(async (err, client,release) => {
        if (err) throw err
        //Getting the list of columns, then adjust it
        let sql = `SELECT column_name FROM information_schema.columns WHERE table_schema = '${schema}' AND table_name = '${view}' ORDER BY ordinal_position`
        let cols = await client.query(sql)
        cols = cols.rows.map(r => r.column_name).filter(r => r !== 'geom') //choose "rows", then its colum_names are listed, and geom is removed.
        //we will add filter if needed
        cols.push(`ST_AsGeoJSON(${schema}.${view}.geom)`)
        //console.log(`columns used: ${cols}`)
        // Then, we will get feature record.
        await client.query('BEGIN')
        sql = `
        DECLARE cur CURSOR FOR
        SELECT ${cols.toString()} FROM ${schema}.${view}`
        cols = await client.query(sql)
        //console.log(cols.rows)
        try {
            while (await fetch(client, database, view, stream) !== 0) {}
        } catch (e) { throw e }
        await client.query(`COMMIT`)
        //await client.end()
        stream.end()
        const endTime = new Date()
        var diff = endTime.getTime() - startTime.getTime();
        var workTime = diff / 1000
        console.log(`workingTime for ${schema}.${view} in ${database} is ${workTime} (sec). End`)
        release()
    })
}
Practice 6: Reading data from PostgreSQL/PostGIS data using nodejs, using cursor, modify the result, and export as vector tile (PMTiles)
From test006.js, we replace stream from text output (fs.createWriteStream) to a standard output piped into tippecanoe input (tippecanoe.stdin). It is just a simple replacement, so we will have vector tile for each view as we did with textout put in the previous practice.


The actual code is as below. If your tippiecanoe version is older than 2.17, change ".pmtiles" to ".mbtiles" as the former version does not support PMTiles.
const config = require('config')
const { Pool, Query } = require('pg')
const modify = require('./modify.js')
const { spawn } = require('child_process')

// config constants
const relations = config.get('relations')
const fetchSize = config.get('fetchSize')
const outTextDir = config.get('outputDir')
const tippecanoePath = config.get('tippecanoePath')

let pools = {}

const noPressureWrite = (stream, f) => {
    return new Promise((res) => {
        if (stream.write(`\x1e${JSON.stringify(f)}\n`)){
            res()
        } else {
            stream.once('drain', () => {
                res()
            })
        }
    })
}

const fetch = (client, database, view, stream) =>{
    return new Promise((resolve, reject) => {
        let count = 0
        let features = []
        client.query(new Query(`FETCH ${fetchSize} FROM cur`))
        .on('row', row => {
            let f = {
                type: 'Feature',
                properties: row,
                geometry: JSON.parse(row.st_asgeojson)
            }
            delete f.properties.st_asgeojson
            f.properties._database = database
            f.properties._view = view
            f.properties._table = view
            count++
            f = modify(f)
            if (f) features.push(f)
        })
        .on('error', err => {
            console.error(err.stack)
            reject()
        })
        .on('end', async () => {
            for (f of features) {
                try {
                    //console.log(f)
                    await noPressureWrite(stream, f)
                } catch (e) {
                    throw e
                }
            }
            resolve(count)
        })
    })
}


for (relation of relations){
    var startTime = new Date()
    const [database, schema, view] = relation.split('::')
    const tippecanoe = spawn(tippecanoePath, [
        `--output=${outTextDir}/${database}-${schema}-${view}.pmtiles`,
        `--no-tile-compression`,
        `--minimum-zoom=0`,
        `--maximum-zoom=5`
      ], { stdio: ['pipe', 'inherit', 'inherit'] })
    const stream = tippecanoe.stdin
    //const stream = fs.createWriteStream(`${outTextDir}/${database}-${schema}-${view}.txt`)
    if(!pools[database]){
        pools[database] = new Pool({
            host: config.get(`connection.${database}.host`),
            user: config.get(`connection.${database}.dbUser`),
            port: config.get(`connection.${database}.port`),
            password: config.get(`connection.${database}.dbPassword`),
            database: database
        })
    }
    pools[database].connect(async (err, client,release) => {
        if (err) throw err
        //Getting the list of columns, then adjust it
        let sql = `SELECT column_name FROM information_schema.columns WHERE table_schema = '${schema}' AND table_name = '${view}' ORDER BY ordinal_position`
        let cols = await client.query(sql)
        cols = cols.rows.map(r => r.column_name).filter(r => r !== 'geom') //choose "rows", then its colum_names are listed, and geom is removed.
        //we will add filter if needed
        cols.push(`ST_AsGeoJSON(${schema}.${view}.geom)`)
        //console.log(`columns used: ${cols}`)
        // Then, we will get feature record.
        await client.query('BEGIN')
        sql = `
        DECLARE cur CURSOR FOR
        SELECT ${cols.toString()} FROM ${schema}.${view}`
        cols = await client.query(sql)
        //console.log(cols.rows)
        try {
            while (await fetch(client, database, view, stream) !== 0) {}
        } catch (e) { throw e }
        await client.query(`COMMIT`)
        //await client.end()
        stream.end()
        const endTime = new Date()
        var diff = endTime.getTime() - startTime.getTime();
        var workTime = diff / 1000
        console.log(`workingTime for ${schema}.${view} in ${database} is ${workTime} (sec). End`)
        release()
    })
}
Final practice
I have already prepare an "index.js" in this repository. Run it to obtain the vector tile for ClearMap Vector.

(note: Because I listed only two views for testing purpose, it has less layers in the final product.)
Summary
Thus, I explained how we can create vector tile from PostgreSQL/PostGIS using nodejs and tippecanoe.
However, this practice is only for a single bounding box range. In order to deal with the global data up to larger zoom level, we may need to wisely use bounding box to limit the maximum size of vector tiles. In such a case, we can use mapbox/bbbox module or ST_TileEnvelope in PostGIS to create bbox. In addition, a npm module "better-queue" may help us to control the concurrent processing for each bounding boxes. I do not explain it here, but you can explore https://github.com/unvt/produce-gsc-6/blob/main/produce-gsc-osm/index_everyday.js for example.
I hope this helps.
Acknowledgement
This work is based on the development by @hfu. I thank for his efforts.
References