はじめに
マンデルブロ集合の視覚化としては、発散判定までのステップ数で色付けする方法が主流であるが、それ以外の手法も存在する。本記事ではそんな非主流派の中でも割とメジャーと思われるOrbit Trapについて簡単に解説し、実装して紹介する。また、関連手法としてTriangle Inequation Averageも合わせて紹介する。
Orbit Trap とは
発散までのステップ数を元に画像化する手法はEscape Time Algorithmと呼ばれるが、この場合は途中の計算結果は最終的には無視される。この途中の計算結果を集めると複素数の数列ということになるが、これは幾何学的には複素平面上を移動する点の軌道(Orbit)と解釈できる。ここで複素平面上になんらかの幾何学的な形状を距離計測の対象として用意し、軌道と対象との距離に基づいて着色する手法をOrbit Trapと呼ぶようだ。1
以下、特徴を箇条書きにする。
- 距離計測対象の形状の選択により結果が大きく変わる
- 点/円/直線/放物線/四角形など、距離が計算できればなんでも良い
- 大きさ/位置/角度等のパラメータも描画結果に大きく影響を与える
- どの時点の距離を選択するかでも変わる
- 最短、最長、平均、合計等
- Nステップ目の値を採用する、という手法もあり
- Escape Timeと違い、発散するかしないかは直接的な問題ではない
- 必ずしも発散まで計算する必要はないので、短時間で計算が終わる場合が多い
- 発散しない場所でも差異がつくので、マンデルブロ集合の内側の描画が可能
実装
以下、いくつか実装例と出力のサンプルを掲載する。出力画像は、特記しない限り注目している位置は全て同じで、パラメータだけ変更している。
距離だけで着色
ここでは、Trapの対象を円または十字とした場合の実装をしてみた。距離としては、最小・最大・平均を選択できる。
コード
TRAP_SHAPE_RING = 0
TRAP_SHAPE_CROSS = 1

@njit('void(uint8[:,:,:], float64, float64, float64, int64, float64, float64, int64,   int64, int64, float64, float64, float64, float64, float64)', parallel=True)
def draw_image(image, start_x, start_y, pixel_size, max_iters, bailout, density, sampling=1,
               trap_shape=0, trap_mode=0, trap_x=0.0, trap_y=0.0, trap_size=0, trap_threshold = 1.0, trap_power=1.0):

    sample_factor = pixel_size/sampling
    height, width = image.shape[0], image.shape[1]
    for y in prange(height):
        imag = start_y + y * pixel_size
        for x in range(width):
            real = start_x + x * pixel_size

            tmp_color = np.zeros((3,), np.float32)
            for s in range(sampling*sampling):
                real_offset = sample_factor*(s%sampling)
                imag_offset = sample_factor*(s//sampling)
                cy = imag + imag_offset
                cx = real + real_offset


                zx,zy, radius2 = 0.0, 0.0, 0.0
                iteration = 0

                d_closest, d_farthest, d_sum, d_count = 1e20, 0, 0, 0
                while iteration < max_iters and radius2 <= bailout:
                    zx, zy = zx*zx - zy*zy + cx, 2*zx*zy + cy
                    radius2 = zx*zx + zy*zy
                    iteration += 1

                    z2_x, z2_y = zx-trap_x, zy-trap_y
                    if trap_shape==TRAP_SHAPE_RING:
                        distance = math.sqrt(z2_x*z2_x + z2_y*z2_y)
                        d=abs(distance-trap_size)
                    if trap_shape==TRAP_SHAPE_CROSS:
                        d = min(abs(z2_x), abs(z2_y))

                    if d<trap_threshold:
                        if d > d_farthest:
                            d_farthest = d
                        d_sum += d
                        d_count += 1
                    if d < d_closest: d_closest = d

                outside = iteration<max_iters
                if outside:
                    if trap_mode == 0:
                        alpha = d_closest
                    elif trap_mode == 1:
                        alpha = d_farthest
                    elif trap_mode == 2:
                        if d_count==0:
                            alpha = 0.0
                        else:
                            alpha = d_sum/d_count
                    else: alpha = iteration*0.05

                    alpha = alpha**trap_power
                    alpha = alpha*density
                    alpha *= 2*np.pi
                    tmp_color[0] += math.cos(alpha-1.0*np.pi)+1.0
                    tmp_color[1] += math.cos(alpha-0.75*np.pi)+1.0
                    tmp_color[2] += math.cos(alpha-0.5*np.pi)+1.0
            color_coef = 0.5*255/(sampling*sampling)
            image[height-1-y, x] = tmp_color*color_coef
    return
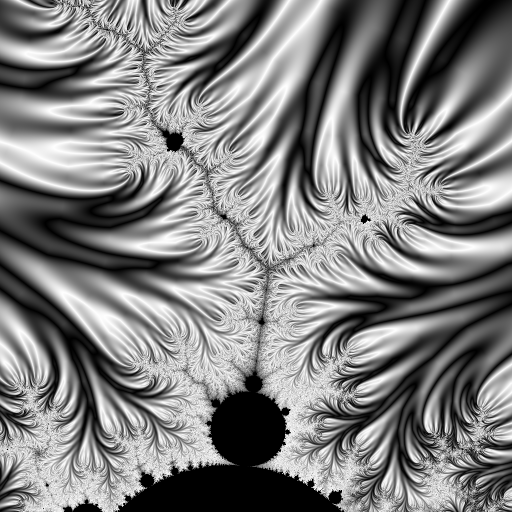
点(円の半径0)で最短距離を選択した場合の作図。
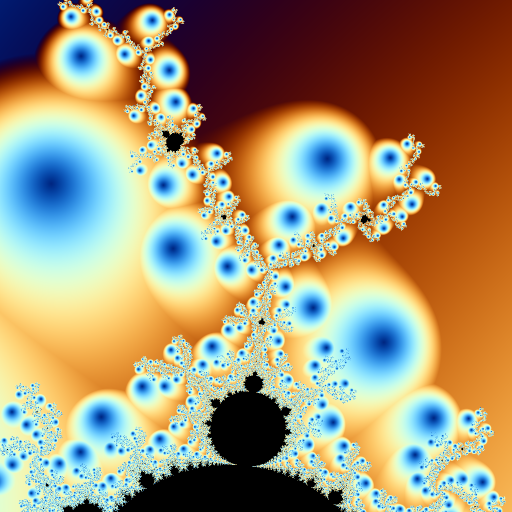
以下は円で同じく最短距離を使っているが、その他パラメータの影響もあって全く違う画像が出来上がる。
以下は円で最長距離を使ったもの。
以下は対象を十字に変えて最短距離を使ったもの。
十字で平均距離を使うとまた違う印象になる。
距離とステップ数で着色
距離とともに、ステップ数も利用して着色することもできる。ここでのステップ数というのは発散までのステップに限らず、「対象に対して所定の閾値以内に近づいた時点のステップ」とできる。この場合は対象に捕まって終わる形になるので"Trap"という呼称に合う気がする。
本記事での実装は、対象に捕まった時点のステップ数で色を決めて、距離は輝度として使う。この方式に対応しやすいようにHSL色空間を使っている。
コード
@njit('float32[:](float64,float64,float64)')
def get_color_hsl(hue, sat, lum):
    coef = np.array([0.0,4.0,2.0],np.float32)
    rgb = np.abs(np.mod( coef + 6*hue , 6.0) - 3.0) - 1.0
    rgb = np.clip(rgb, 0, 1)
    rgb = lum + sat * (rgb-0.5)*(1.0-abs(2.0*lum-1.0))
    return rgb.astype(np.float32)


@njit('void(uint8[:,:,:], float64, float64, float64, int64, float64, float64, int64,   int64, int64, float64, float64, float64,float64, int64 )', parallel=True)
def draw_image2(image, start_x, start_y, pixel_size, max_iters, bailout, density, sampling=1,
               trap_shape=0, trap_mode=0, trap_x=0.0, trap_y=0.0, trap_threshold = 1.0, trap_size=1.0, trap_iters=1):
    LOG2 = math.log(2)

    sample_factor = pixel_size/sampling
    height, width = image.shape[0], image.shape[1]
    for y in prange(height):
        imag = start_y + y * pixel_size
        for x in range(width):
            real = start_x + x * pixel_size

            red,green,blue = 0.0,0.0,0.0
            tmp_color = np.zeros((3,), np.float32)
            for s in range(sampling*sampling):
                real_offset = sample_factor*(s%sampling)
                imag_offset = sample_factor*(s//sampling)
                cy = imag + imag_offset
                cx = real + real_offset


                zx,zy, radius2 = 0.0, 0.0, 0.0
                iteration = 0

                d = 0.0
                c_distance = math.sqrt(cx*cx+cy*cy)
                d_trapped = 0
                while iteration < max_iters and radius2 <= bailout:
                    zx, zy = zx*zx - zy*zy + cx, 2*zx*zy + cy
                    radius2 = zx*zx + zy*zy
                    iteration += 1

                    z2_x, z2_y = zx-trap_x, zy-trap_y

                    if iteration>trap_iters:
                        if trap_shape==TRAP_SHAPE_RING:
                            z_distance = math.sqrt(z2_x*z2_x + z2_y*z2_y)
                            dist_diff = abs(z_distance-trap_size)
                        if trap_shape==TRAP_SHAPE_CROSS:
                            dist_diff = min(abs(z2_x), abs(z2_y))

                        if dist_diff<=trap_threshold:
                            d=1-(dist_diff/trap_threshold)
                            d_trapped = d
                            break

                outside = iteration<max_iters
                if outside and d_trapped!=0.0:
                    alpha = d_trapped

                    hue = iteration/density
                    tmp_color += get_color_hsl(hue, 1.0, alpha*0.75)
            color_coef = 255/(sampling*sampling)
            image[height-1-y, x] = tmp_color*color_coef
    return
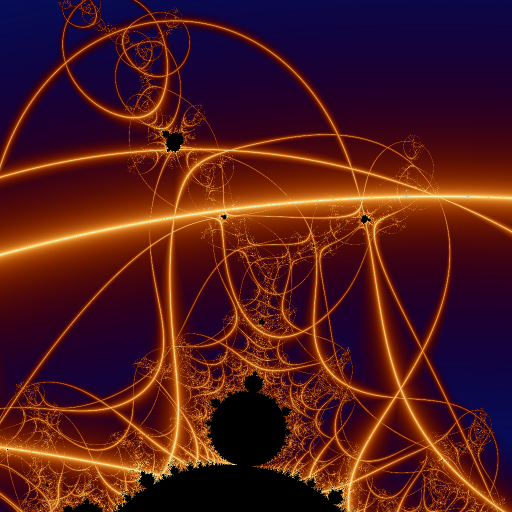
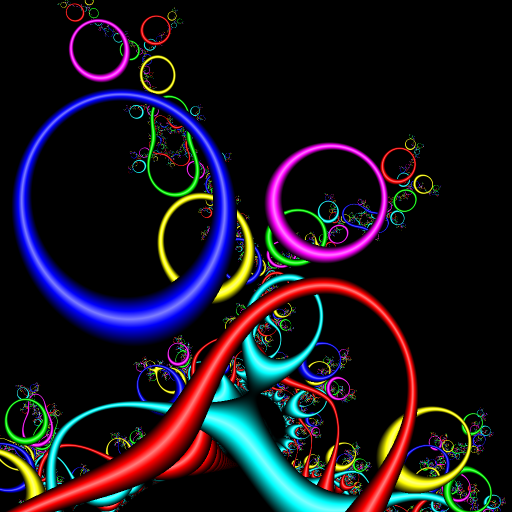
こちらは円との距離で作成した例。こちらの実装の場合は発散判定より先にTrapされる場合が多いので、Escape Timeでは着色できないマンデルブロ集合の内側にも色がついていることがわかる。
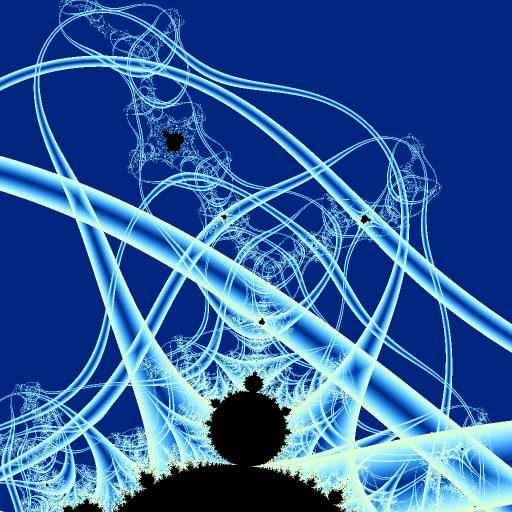
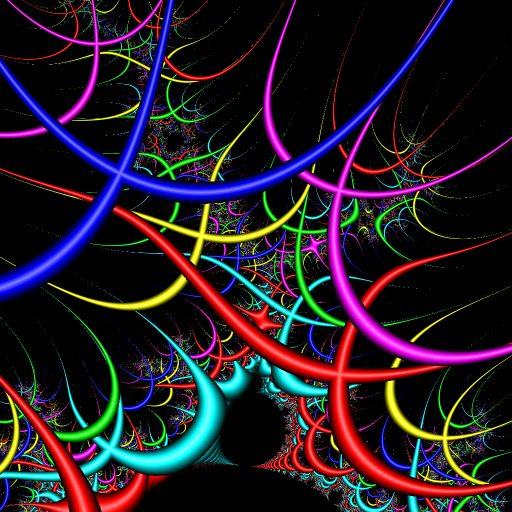
そしてこちらは十字との距離で作成した例。
Triangle Inequation Average
軌跡を角度の計算に使ってそれで着色する手法がある。ここではTriangle Inequation Average(TIA)を紹介する。こちらは普通はOrbit Trapに含まれないようだが、軌跡を使うということで同系統と考えて良いだろう。
Triangle Inequationは三角不等式のことだが、これは現在位置/初期位置/原点で作る三角形の角度の算出として使っているようだ。2
コード
@njit('void(uint8[:,:,:], float64, float64, float64, int64, float64, int64, float64,  float64, float64)', parallel=True)
def draw_image3(image, start_x, start_y, pixel_size, max_iters, bailout, sampling=1, color_density=1.0, color_hue=0.0, color_sat=0.0):
    LOG2 = math.log(2)


    lp2 = math.log(math.log(bailout))

    sample_factor = pixel_size/sampling
    height, width = image.shape[0], image.shape[1]
    for y in prange(height):
        imag = start_y + y * pixel_size
        for x in range(width):
            real = start_x + x * pixel_size

            tmp_color = np.zeros((3,), np.float32)
            for s in range(sampling*sampling):
                real_offset = sample_factor*(s%sampling)
                imag_offset = sample_factor*(s//sampling)
                cy = imag + imag_offset
                cx = real + real_offset

                zx,zy, radius2 = 0.0, 0.0, 0.0
                iteration = 0

                c_distance = math.sqrt(cx*cx+cy*cy)
                d_sum, d_sum2 = 0.0, 0.0
                while iteration < max_iters and radius2 <= bailout:

                    zx, zy = zx*zx - zy*zy + cx, 2*zx*zy + cy
                    radius2 = zx*zx + zy*zy
                    if radius2 > bailout: break

                    if iteration!=0:
                        d_sum2 = d_sum
                        tx, ty = zx-cx, zy-cy
                        z_distance = math.sqrt(tx*tx+ty*ty)
                        lowbound = abs(z_distance-c_distance)
                        d_sum += (math.sqrt(radius2) - lowbound) / (z_distance+c_distance - lowbound)
                    iteration += 1

                outside = iteration<max_iters
                if outside:
                    average = d_sum / iteration
                    average2 = d_sum2 / (iteration-1)
                    f = (lp2 - math.log(math.log(radius2)))/LOG2
                    alpha = average + (average-average2) * f

                    alpha *= color_density
                    falpha = alpha % 1
                    tmp_color += get_color_hsl(color_hue, color_sat, (0.5-abs(falpha-0.5))*2.0)
            color_coef = 255/(sampling*sampling)
            image[height-1-y, x] = tmp_color*color_coef
    return
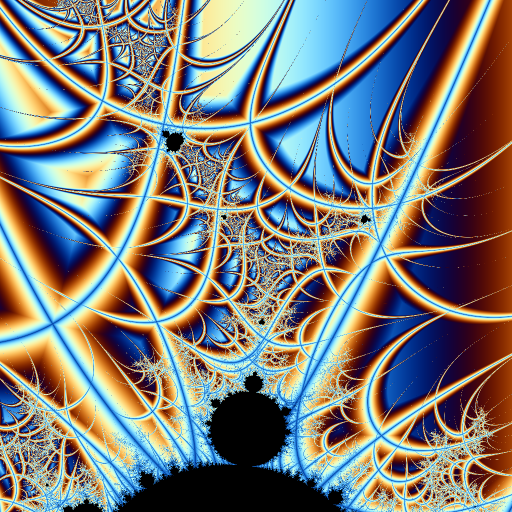
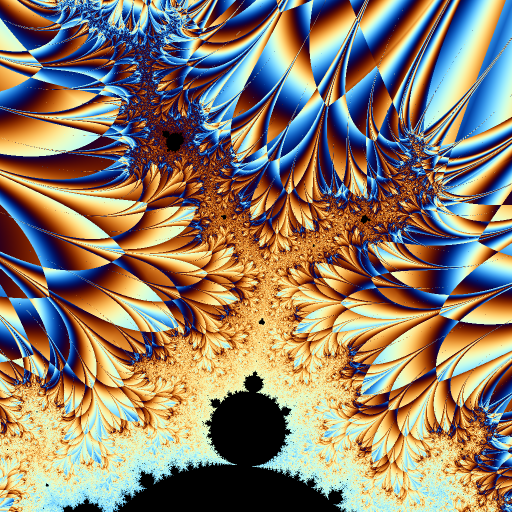
彩度0で輝度にTIAを適用した図がこちら。
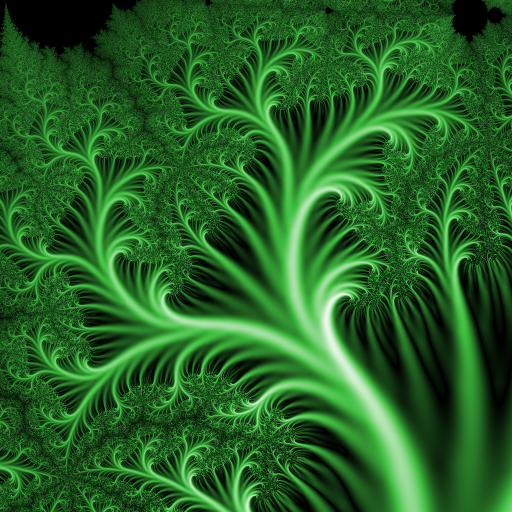
炎や流水のような効果が出せたりするが、場所やパラメータをうまく選ぶと、以下のように植物のような画像を作れたりもする。(これだけ他の作例とは別の座標)
関連記事