[サンプルプロジェクトのダウンロード] (https://github.com/Synashida/DotNetHighchartSample)
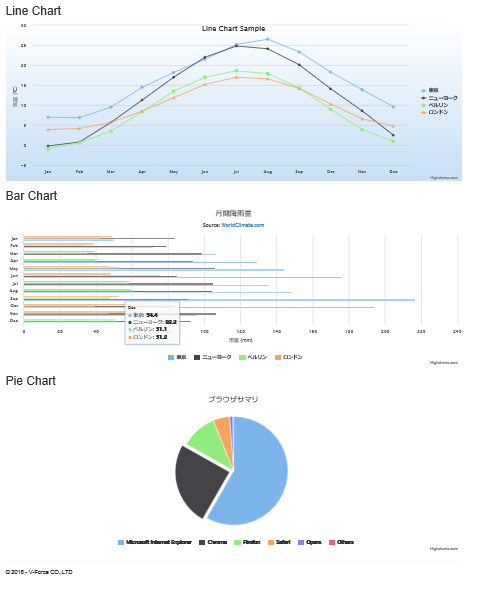
実行イメージはこちら
数年前に書いたものだったのですが、Visual Studioのバージョンもだいぶ上がったので書き直してみました。
サンプルプロジェクトの実行方法
- [githubからダウンロード] (https://github.com/Synashida/DotNetHighchartSample)
- HighchartSample.slnからVSを起動
- Nugetの復元
- 実行
サンプルを見かける時によく、HighCharts部分だけ記載されていて何のパッケージを参照するだとか、JSをどうやってBundleするだとか、ほんとの最初に使う時につまづいたりします。
そして情報がほしいときというのは概ねそういうフェーズだったりします。
なので動くサンプルの提供を行っていますので、詳細はサンプルを動かしてみていただければと思います。
その上でコードのポイント
App_Start¥BundleConfig.cs
            bundles.Add(new ScriptBundle("~/bundles/highcharts").Include(
                        "~/Scripts/Highcharts-4.0.1/js/highcharts.js"));
Views¥Shared¥_Layout.cshtml
<head>
    <meta charset="utf-8" />
    <meta name="viewport" content="width=device-width, initial-scale=1.0">
    <title>Highchartsサンプル</title>
    @Styles.Render("~/Content/css")
    @Scripts.Render("~/bundles/modernizr")

    @Scripts.Render("~/bundles/jquery")
    @Scripts.Render("~/bundles/bootstrap")
    @Scripts.Render("~/bundles/highcharts")
    @RenderSection("scripts", required: false)
</head>
Views¥Home¥Index.cshtml
<div class="row">
    <div class="col-md-12">
        <h2>Line Chart</h2>
        @Html.Raw(ViewData["lineChart"])
    </div>
</div>
下記コードをHighchartsのJSFeildと対比しながら写経していくとをC#の作法に置き換えているだけだというのがわかります。ほんと置き換えしてるだけです。
多少、配列の深さが変わってくるとインスタンスの指定方法に悩むこともありますが、そこはこちらのサンプルを参考にいただければと思います。
Controllers¥HomeController.cs
using DotNet.Highcharts;
using DotNet.Highcharts.Enums;
using DotNet.Highcharts.Options;
using DotNet.Highcharts.Helpers;
using System.Collections;

namespace HighchartSample.Controllers
{
    public class HomeController : Controller
    {
        public ActionResult Index()
        {
            CreateLineChart();
            CreateBarChart();
            CreatePieChart();
            return View();
        }

        private void CreateLineChart()
        {
            Highcharts chart = new Highcharts("linechart")
                .InitChart(new Chart
                {
                    DefaultSeriesType = ChartTypes.Line,
                    BackgroundColor = new BackColorOrGradient(
                                                    new Gradient
                                                    {
                                                        LinearGradient = new[] { 0, 0, 0, 400 }
                                                       ,
                                                        Stops = new object[,]
                                                               {
                                                                    {   0, System.Drawing.Color.White }
                                                                    , {1, "#C7DFF5" }
                                                               }
                                                    }),
                    Height = 400
                })
                .SetTitle(new Title
                {
                    Text = "Line Chart Sample",
                    Align = HorizontalAligns.Center,
                    VerticalAlign = VerticalAligns.Top
                })
                .SetXAxis(new XAxis
                {
                    Categories = new string[] { "Jan", "Feb", "Mar", "Apr", "May", "Jun", "Jul", "Aug", "Sep", "Oct", "Nov", "Dec" }
                })
                .SetYAxis(new YAxis
                {
                    Title = new YAxisTitle { Text = "気温(℃)" },
                    PlotLines = new[] { new YAxisPlotLines { Value = 0, Width = 1, Color = System.Drawing.Color.AliceBlue } }
                })
                .SetTooltip(new Tooltip { ValueSuffix = "℃" })
                .SetLegend(new Legend
                {
                    Layout = Layouts.Vertical, Align = HorizontalAligns.Right, VerticalAlign = VerticalAligns.Middle, BorderWidth = 0
                })
                .SetSeries(new []
                {
                    new Series {
                        Name = "東京",
                        Data = new Data(new object[] { 7.0, 6.9, 9.5, 14.5, 18.2, 21.5, 25.2, 26.5, 23.3, 18.3, 13.9, 9.6 })
                    },
                    new Series {
                        Name = "ニューヨーク",
                        Data = new Data(new object[] { -0.2, 0.8, 5.7, 11.3, 17.0, 22.0, 24.8, 24.1, 20.1, 14.1, 8.6, 2.5 })
                    },
                    new Series {
                        Name = "ベルリン",
                        Data = new Data( new object[] { -0.9, 0.6, 3.5, 8.4, 13.5, 17.0, 18.6, 17.9, 14.3, 9.0, 3.9, 1.0 })
                    },
                    new Series {
                        Name = "ロンドン",
                        Data = new Data(new object[] { 3.9, 4.2, 5.7, 8.5, 11.9, 15.2, 17.0, 16.6, 14.2, 10.3, 6.6, 4.8 })
                    }
                });
            ViewData.Add("lineChart", chart.ToHtmlString());
        }

        private void CreateBarChart()
        {
            Highcharts chart = new Highcharts("barchart")
               .InitChart(new Chart { DefaultSeriesType = ChartTypes.Bar })
               .SetTitle(new Title { Text = "月間降雨量" })
               .SetSubtitle(new Subtitle { Text = "Source: <a href=\"http://WorldClimate.com\">WorldClimate.com</a>", UseHTML = true })
               .SetXAxis(new XAxis { Categories = new string[] { "Jan", "Feb", "Mar", "Apr", "May", "Jun", "Jul", "Aug", "Sep", "Oct", "Nov", "Dec" }})
               .SetYAxis(new YAxis
               {
                   Min = 0,
                   Title = new YAxisTitle { Text = "雨量 (mm)" }
               })
               .SetTooltip(new Tooltip {
                   /*
                   HeaderFormat = "<span style=\"font-size:10px\">{point.key}</span><table>",
                   PointFormat = "'<tr><td style=\"color:{ series.color}; padding: 0\">{series.name}: </td>' + '<td style=\"padding:0\"><b>{point.y:.1f} mm</b></td></tr>'",
                   Formatter = "'</table>'",
                   */
                   Shared = true,
                   UseHTML = true
               })
               .SetPlotOptions(new PlotOptions
               {
                   Column = new PlotOptionsColumn { PointPadding = 0.2, BorderWidth = 0 }
               })
               .SetSeries(new[] {
                    new Series {
                        Name = "東京",
                        Data = new Data(new object[] { 49.9, 71.5, 106.4, 129.2, 144.0, 176.0, 135.6, 148.5, 216.4, 194.1, 95.6, 54.4 })
                    },
                    new Series {
                        Name = "ニューヨーク",
                        Data = new Data(new object[] { 83.6, 78.8, 98.5, 93.4, 106.0, 84.5, 105.0, 104.3, 91.2, 83.5, 106.6, 92.3 })
                    },
                    new Series {
                        Name = "ベルリン",
                        Data = new Data( new object[] { 42.4, 33.2, 34.5, 39.7, 52.6, 75.5, 57.4, 60.4, 47.6, 39.1, 46.8, 51.1 })
                    },
                    new Series {
                        Name = "ロンドン",
                        Data = new Data(new object[] { 48.9, 38.8, 39.3, 41.4, 47.0, 48.3, 59.0, 59.6, 52.4, 65.2, 59.3, 51.2 })
                    }
               });
            ViewData.Add("barChart", chart.ToHtmlString());
        }

        private void CreatePieChart() {
            Highcharts chart = new Highcharts("piechart")
                .InitChart(new Chart
                {
                    DefaultSeriesType = ChartTypes.Pie,
                    PlotBackgroundColor = null,
                    PlotBorderColor = null,
                    PlotShadow = null
                })
                .SetTitle(new Title { Text = "ブラウザサマリ" })
                .SetTooltip(new Tooltip
                {
                    PointFormat = "{series.name}: <b>{point.percentage:.1f}%</b>"
                })
                .SetPlotOptions(new PlotOptions
                {
                    Pie = new PlotOptionsPie
                    {
                        AllowPointSelect = true,
                        Cursor = Cursors.Pointer,
                        DataLabels = new PlotOptionsPieDataLabels { Enabled = false },
                        ShowInLegend = true
                    }
                })
                .SetSeries(new []
                {
                    new Series
                    {
                        Name = "製品名",
                        Data = new Data(new Point[] {
                            new Point { Name = "Microsoft Internet Explorer", Y = 56.33 },
                            new Point { Name = "Chrome", Y = 24.03, Selected = true, Sliced = true },
                            new Point { Name = "Firefox", Y = 10.38 },
                            new Point { Name = "Safari", Y = 4.77 },
                            new Point { Name = "Opera", Y = 0.91 },
                            new Point { Name = "Others", Y = 0.2 }
                        })
                    }
                });
            ViewData.Add("pieChart", chart.ToHtmlString());
        }
   }
}
お役に立てれば幸いです。