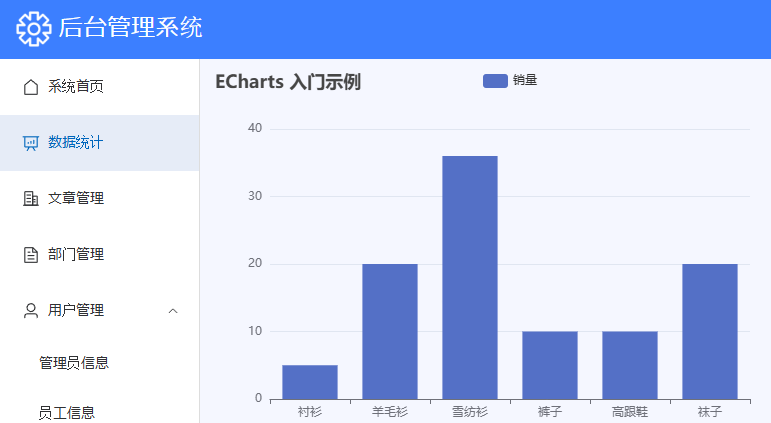
一:入门实例
1.安装使用Echarts
npm i echarts -S
2.dom容器
<div id="main" style="width: 600px;height:400px"></div>
3.引入onMounted
import * as echarts from 'echarts';
import { onMounted } from 'vue';

const option = {
  title: {
    text: 'ECharts 入门示例'
  },
  tooltip: {},
  legend: {
    data: ['销量']
  },
  xAxis: {
    data: ['衬衫', '羊毛衫', '雪纺衫', '裤子', '高跟鞋', '袜子']
  },
  yAxis: {},
  series: [
    {
      name: '销量',
      type: 'bar',
      data: [5, 20, 36, 10, 10, 20]
    }
  ]
};

// onMounted:表示页面所有的dom元素都初始化完成了
onMounted(() => {
    // 基于准备好的dom,初始化echarts实例
    const myChart = echarts.init(document.getElementById('main'));

    // 使用刚指定的配置项和数据显示图表。
    myChart.setOption(option);
})
4.代码
<template>
    <div>
        <!-- 为 ECharts 准备一个定义了宽高的 DOM -->
        <div id="main" style="width: 600px;height:400px"></div>
    </div>
</template>

<script setup>
import { reactive, onMounted } from 'vue';
import * as echarts from 'echarts';

const option = {
    title: {
        text: 'ECharts 入门示例'
    },
    tooltip: {},
    legend: {
        data: ['销量']
    },
    xAxis: {
        data: ['衬衫', '羊毛衫', '雪纺衫', '裤子', '高跟鞋', '袜子']
    },
    yAxis: {},
    series: [
        {
            name: '销量',
            type: 'bar',
            data: [5, 20, 36, 10, 10, 20]
        }
    ]
};

const data = reactive({
})

// onMounted:表示页面所有的dom元素都初始化完成了
onMounted(() => {
    // 基于准备好的dom,初始化echarts实例
    const myChart = echarts.init(document.getElementById('main'));

    // 使用刚指定的配置项和数据显示图表。
    myChart.setOption(option);
})

</script>

<style scoped></style>
5.图表
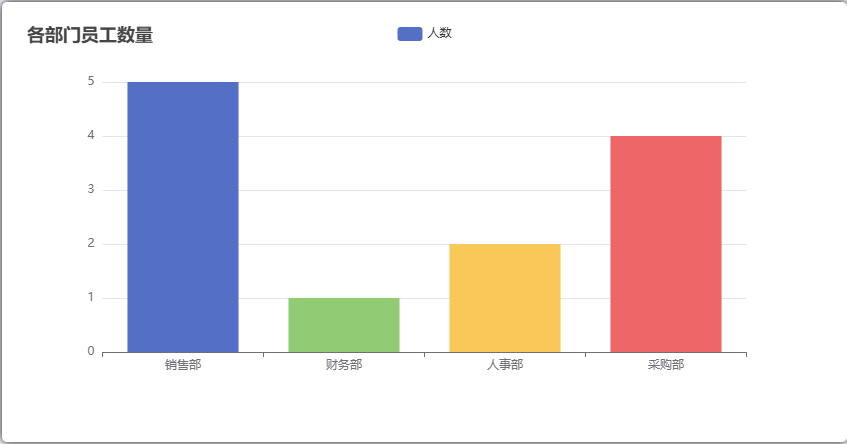
二:柱状图
1.后端接口-统计部门人数
    @GetMapping("/barData")
    public Result getBarData(){
        Map<String,Object> map = new HashMap<>();
        List<Employee> employeeList = employeeService.selectAll(null);
        Set<String> deptNameSet = employeeList.stream().map(Employee::getDeptName).collect(Collectors.toSet());
        map.put("dept",deptNameSet);  // 横轴数据
        List<Long> countList = new ArrayList<>();
        for(String deptName : deptNameSet){
            // 统计这个部门下面的员工的数量
            long count = employeeList.stream().filter(employee -> employee.getDeptName().equals(deptName)).count();
            countList.add(count);
        }
        map.put("count",countList); // 纵轴数据(员工数量数据)
        return Result.success(map);
    }
2.设置图表颜色
itemStyle: {
  normal: {
            color: function (params) {
            let colors = ['#5470c6','#91cc75','#fac858','#ee6666']
            return colors[params.dataIndex % colors.length]
                    }
                },
            },
3.前端代码
<div class="card" style="padding: 20px; flex: 1;height: 400px" id="bar"></div>

const barOption = {
    title: {
        text: '各部门员工数量'
    },
    tooltip: {},
    legend: {
        data: ['人数']
    },
    xAxis: {
        data: []
    },
    yAxis: {},
    series: [
        {
            name: '人数',
            type: 'bar',
            data: [],
            itemStyle: {
                normal: {
                    color: function (params) {
                        let colors = ['#5470c6', '#91cc75', '#fac858', '#ee6666']
                        return colors[params.dataIndex % colors.length]
                    }
                },
            },
        }
    ]
};

// onMounted:表示页面所有的dom元素都初始化完成了
onMounted(() => {

    // 基于准备好的dom,初始化echarts实例
    const barChart = echarts.init(document.getElementById('bar'));
    request.get('/barData').then(res => {
        barOption.xAxis.data = res.data.dept // 横轴数据
        barOption.series[0].data = res.data.count // 纵轴数据
        // 使用刚指定的配置项和数据显示图表。
        barChart.setOption(barOption);
    })
})
4.样式
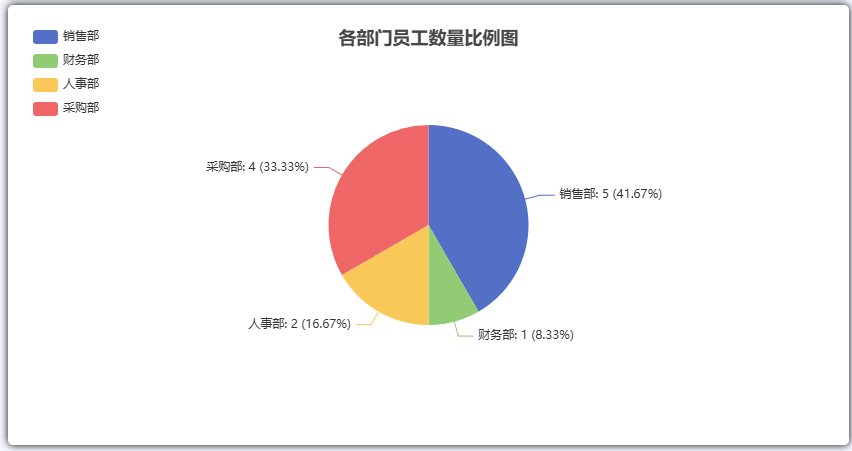
三:饼图
1.后端接口-统计部门人数
    @GetMapping("/pieData")
    public Result getPieData(){
        List<Map<String,Object >> list = new ArrayList<>();
        List<Employee> employeeList = employeeService.selectAll(null);
        Set<String> deptNameSet = employeeList.stream().map(Employee::getDeptName).collect(Collectors.toSet());
        for(String deptName : deptNameSet){
            HashMap<String,Object> map = new HashMap<>();
            map.put("name",deptName);
            // 统计这个部门下面的员工的数量
            long count = employeeList.stream().filter(employee -> employee.getDeptName().equals(deptName)).count();
            map.put("value",count);
            list.add(map);
        }
        return Result.success(list);
    }
2.前端代码
<div class="card" style="padding: 20px; width: calc(50% - 40px); height: 400px" id="pie"></div>

const pieOption = {
    title: {
        text: '各部门员工数量比例图',
        left: 'center'
    },
    tooltip: {
        trigger: 'item'
    },
    legend: {
        orient: 'vertical',
        x: 'left'
    },
    series: [
        {
            name: '员工数量',
            type: 'pie',
            radius: '50%',
            data: [],
            label: {
                formatter: '{b}: {@2012} ({d}%)'
            },
            emphasis: {
                itemStyle: {
                    shadowBlur: 10,
                    shadowOffsetX: 0,
                    shadowColor: 'rgba(0, 0, 0, 0.5)'
                }
            }
        }
    ]
}

// onMounted:表示页面所有的dom元素都初始化完成了
onMounted(() => {
    // 基于准备好的dom,初始化echarts实例
    const pieChart = echarts.init(document.getElementById('pie'));
    request.get('/pieData').then(res => {
        pieOption.series[0].data = res.data
        // lineChart
        pieChart.setOption(pieOption);
    })
})
3.样式
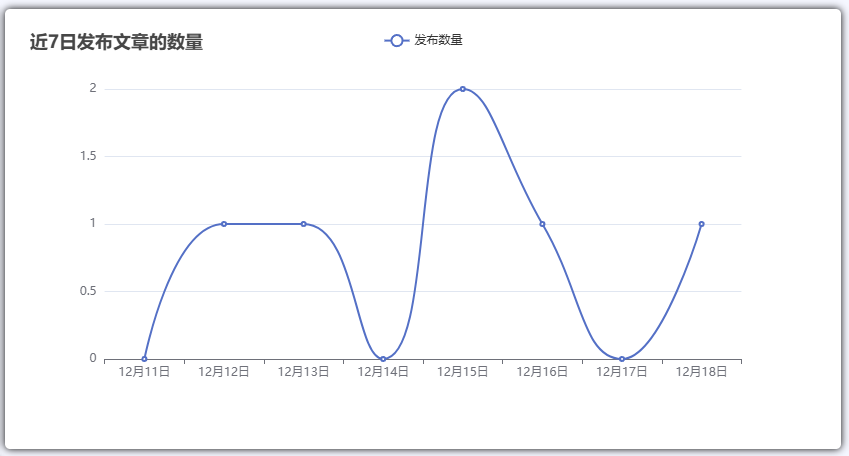
四:折线图
1.后端接口-统计近7日文章数量
    @GetMapping("/lineData")
    public Result getlineData(){
        Map<String,Object> map = new HashMap<>();
        Date date = new Date();// 当前时间
        DateTime start = DateUtil.offsetDay(date,-7);// 起始日期
        List<DateTime> dateTimeList = DateUtil.rangeToList(start,date, DateField.DAY_OF_YEAR);
        // 把DateTime类型的日期转换成字符串类型的日期 ["10月22日","10月23日..."]
        List<String> dateStrList = dateTimeList.stream().map(dateTime -> DateUtil.format(dateTime,"MM月dd日"))
                .sorted(Comparator.naturalOrder()).collect(Collectors.toList());
        map.put("date",dateStrList);  // 横轴数据

        List<Integer> countList = new ArrayList<>();
        for (DateTime day : dateTimeList) {
            String dayFormat  = DateUtil.formatDate(day); // 2023-10-22
            // 获取当天所有的发布的文章的数量
           Integer count = articleService.selectCountByDate(dayFormat);
           countList.add(count);
        }
        map.put("count",countList); // 纵轴数据(发布文章的数量)
        return Result.success(map);
    }
2.前端代码
<div class="card" style="padding: 20px;flex: 1;height: 400px" id="line"></div>

const lineOption = {
    title: {
        text: '近7日发布文章的数量'
    },
    tooltip: {},
    legend: {
        trigger: 'item'
    },
    xAxis: {
        data: []
    },
    yAxis: {},
    series: [
        {
            name: '发布数量',
            type: 'line',
            data: [],
            smooth: true
        }
    ]
};

// onMounted:表示页面所有的dom元素都初始化完成了
onMounted(() => {
    // 基于准备好的dom,初始化echarts实例
    const lineChart = echarts.init(document.getElementById('line'));
    request.get('/lineData').then(res => {
        lineOption.xAxis.data = res.data.date // 横轴数据
        lineOption.series[0].data = res.data.count // 纵轴数据
        // lineChart
        lineChart.setOption(lineOption);
    })
})
3.样式
⭐循环快捷键:iter