本稿概要
前回、OpenShift 4 を AWS にインストール しましたが、今回は、インストール時にはデプロイされていなかった OpenShift のログ集約基盤となる ClusterLogging をインストールしてみます。
OpenShift には元来、コンテナのログを収集,参照する機能として、Elasticsearch, Fluetnd, Kibana をデプロイして運用するのがセオリーでした。
OpenShift 3 では Ansible によるインストールプランが提供されていましたが、OpenShift 4.1 では ClusterLogging という Operator によるインストールプランに変更になったため、手順をメモ代わりに残しておきます。
ClusterLogging Operator 概要
ClsuterLogging Operator は大まかには以下のオブジェクトを よしなに 生成してくれます。
- Curator の CronJob, ConfigMap
- Fluentd の DaemonSet, Secret, ConfigMap, Service
- Kibana の Deployment, Secret, Service, Route
- Elasticsearch の Secret
- Elasticsearch Operator の Custom Resource Object (Elasticsearch)
※ Elasticsearch Operator は Service や Deployment, ConfigMap などを生成してくれます
などと書きましたが、Operator はそれでもう一つのアプリケーションパッケージのようなものですし、特に知らなくてもインストールできます。
インストールに問題が起こったときも、各種Podの起動でどんな問題が発生しているのかウォッチして対処していく程度で良いのではないかとも思います。
手順概要
- Elasticsearch Operator 用の Project (Namespace) を作成
- Elasticsearch Operator 用に OperatorGroup を作成
- Elasticsearch Operator を使えるようにするための CatalogSourceConfig を作成
- Prometheus によるモニタリング用に Role と RoleBindings を作成
- ClusterLogging がデプロイされるProject (Namespace) を作成
- Web Console から ClusterLogging Operator を Install
- Web Console から ClusterLogging Operator の Subscription を作成
- ClusterLogging オブジェクトを作成
あとは、ClusterLogging Operator が全部やってくれて、しばらくすると、 Kibana から、 Fluentd が収集して、Elasticsearch に集約されたコンテナのログが参照、検索できるようになっているかと思います。
手順詳細
事前準備
作る K8sリソースオブジェクトのマニフェストだけ先に書いて置いちゃいます。
内容は 公式ドキュメント と同じです。
apiVersion: v1
kind: Namespace
metadata:
  # Namespace 名は固定で、これ以外にすることができないようです
  name: openshift-operators-redhat
  annotations:
    openshift.io/node-selector: ""
  labels:
    openshift.io/cluster-logging: "true"
    openshift.io/cluster-monitoring: "true"
---
apiVersion: v1
kind: Namespace
metadata:
  name: openshift-logging
  annotations:
    openshift.io/node-selector: ""
  labels:
    openshift.io/cluster-logging: "true"
    openshift.io/cluster-monitoring: "true"
apiVersion: operators.coreos.com/v1
kind: OperatorGroup
metadata:
  # 名前を変えられるのかは調べてないですが、このままのほうが後々良さそう
  name: openshift-operators-redhat
  # ここは固定で変更できないようです
  namespace: openshift-operators-redhat
spec: {}
apiVersion: "operators.coreos.com/v1"
kind: "CatalogSourceConfig"
metadata:
  name: "elasticsearch"
  namespace: "openshift-marketplace"
spec:
  targetNamespace: "openshift-operators-redhat"
  packages: "elasticsearch-operator"
apiVersion: rbac.authorization.k8s.io/v1
kind: Role
metadata:
  name: prometheus-k8s
  namespace: openshift-operators-redhat
rules:
- apiGroups:
  - ""
  resources:
  - services
  - endpoints
  - pods
  verbs:
  - get
  - list
  - watch
---
apiVersion: rbac.authorization.k8s.io/v1
kind: RoleBinding
metadata:
  name: prometheus-k8s
  namespace: openshift-operators-redhat
roleRef:
  apiGroup: rbac.authorization.k8s.io
  kind: Role
  name: prometheus-k8s
subjects:
- kind: ServiceAccount
  name: prometheus-k8s
namespace: openshift-operators-redhat
apiVersion: "logging.openshift.io/v1"
kind: "ClusterLogging"
metadata:
  name: "instance"
  namespace: openshift-logging
spec:
  managementState: "Managed"
  logStore:
    type: "elasticsearch"
    elasticsearch:
      nodeCount: 2
      resources:
        limits:
          memory: 2Gi
        requests:
          cpu: 200m
          memory: 2Gi
      storage:
        storageClassName: "gp2"
        size: "200G"
      redundancyPolicy: "SingleRedundancy"
  visualization:
    type: "kibana"
    kibana:
      resources:
        limits:
          memory: 1Gi
        requests:
          cpu: 500m
          memory: 1Gi
      proxy:
        resources:
          limits:
            memory: 100Mi
          requests:
            cpu: 100m
            memory: 100Mi
      replicas: 2
  curation:
    type: "curator"
    curator:
      resources:
        limits:
          memory: 200Mi
        requests:
          cpu: 200m
          memory: 200Mi
      schedule: "*/10 * * * *"
  collection:
    logs:
      type: "fluentd"
      fluentd:
        resources:
          limits:
            memory: 1Gi
          requests:
            cpu: 200m
            memory: 1Gi
インストール
作成したマニフェスト (clusterlogging.yaml以外) をデプロイ
oc apply -f eo-project.yaml
oc apply -f eo-og.yaml
oc apply -f eo-csc.yaml
oc apply -f eo-rbac.yaml
ClusterLogging Operator をインストール
OpenShift の Web Console での操作になります
Catalog -> OperatorHub から Cluster Logging を選択
(OpenShift Logging を選んだ状態でにしとく)
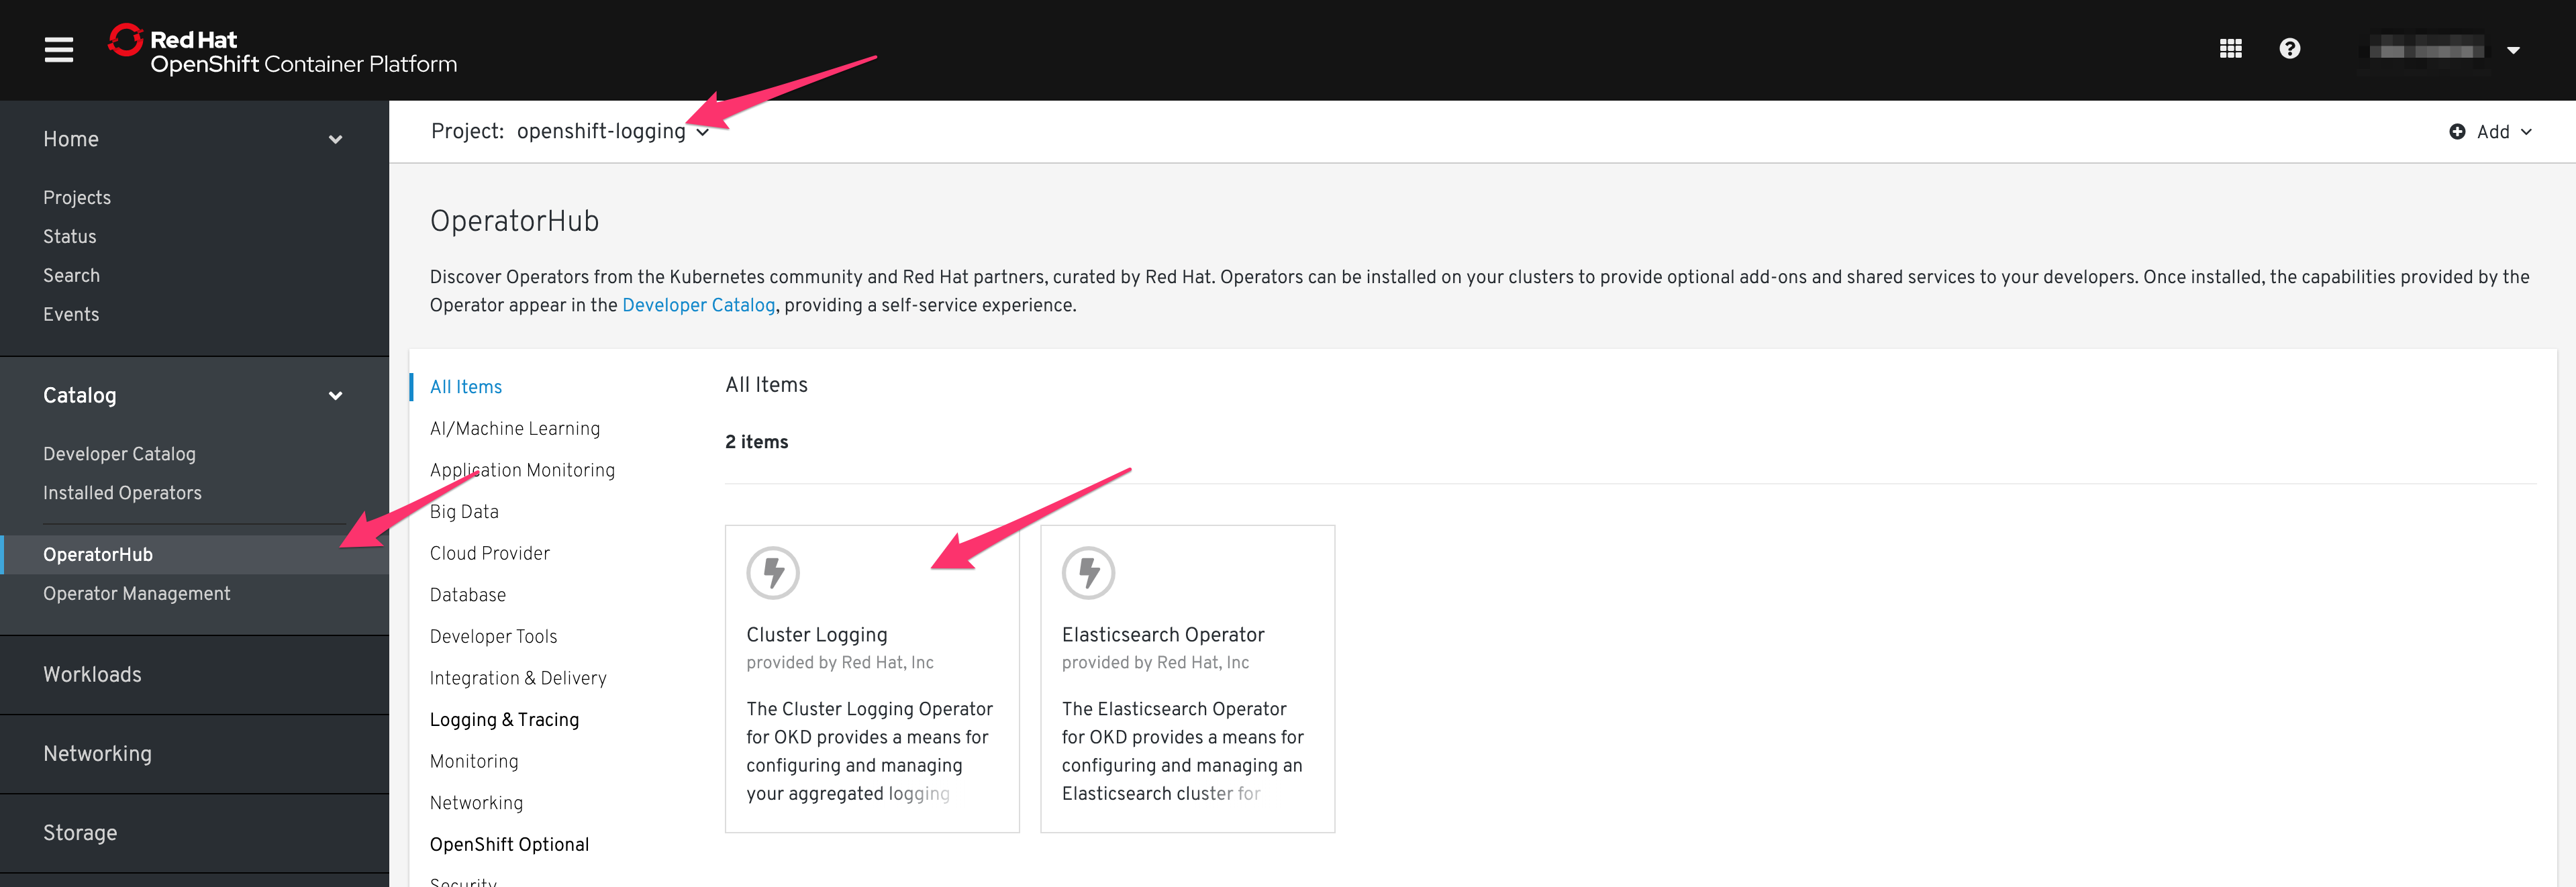
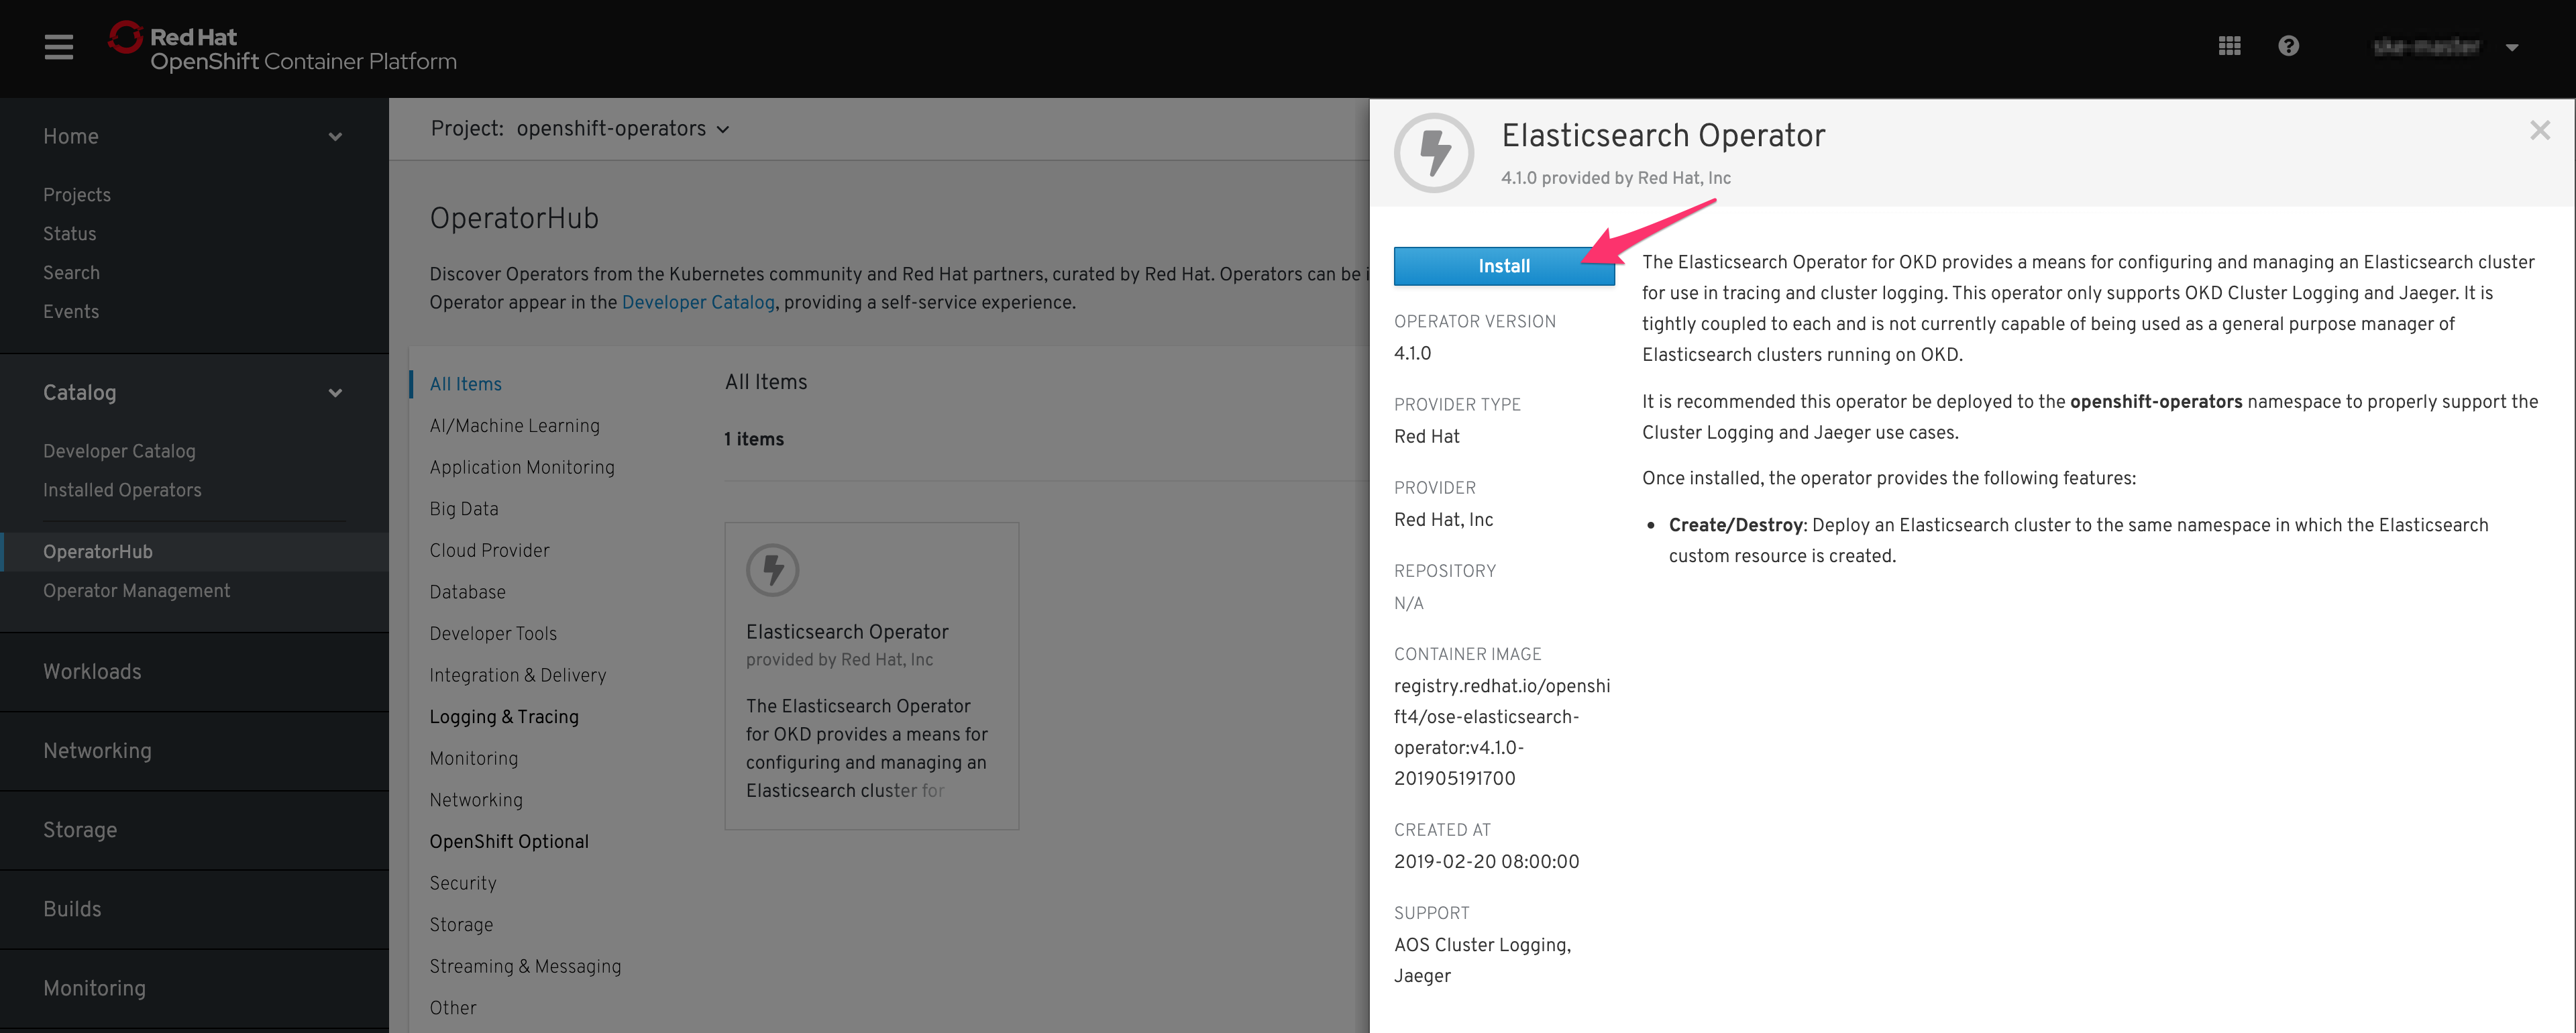
Install を選択
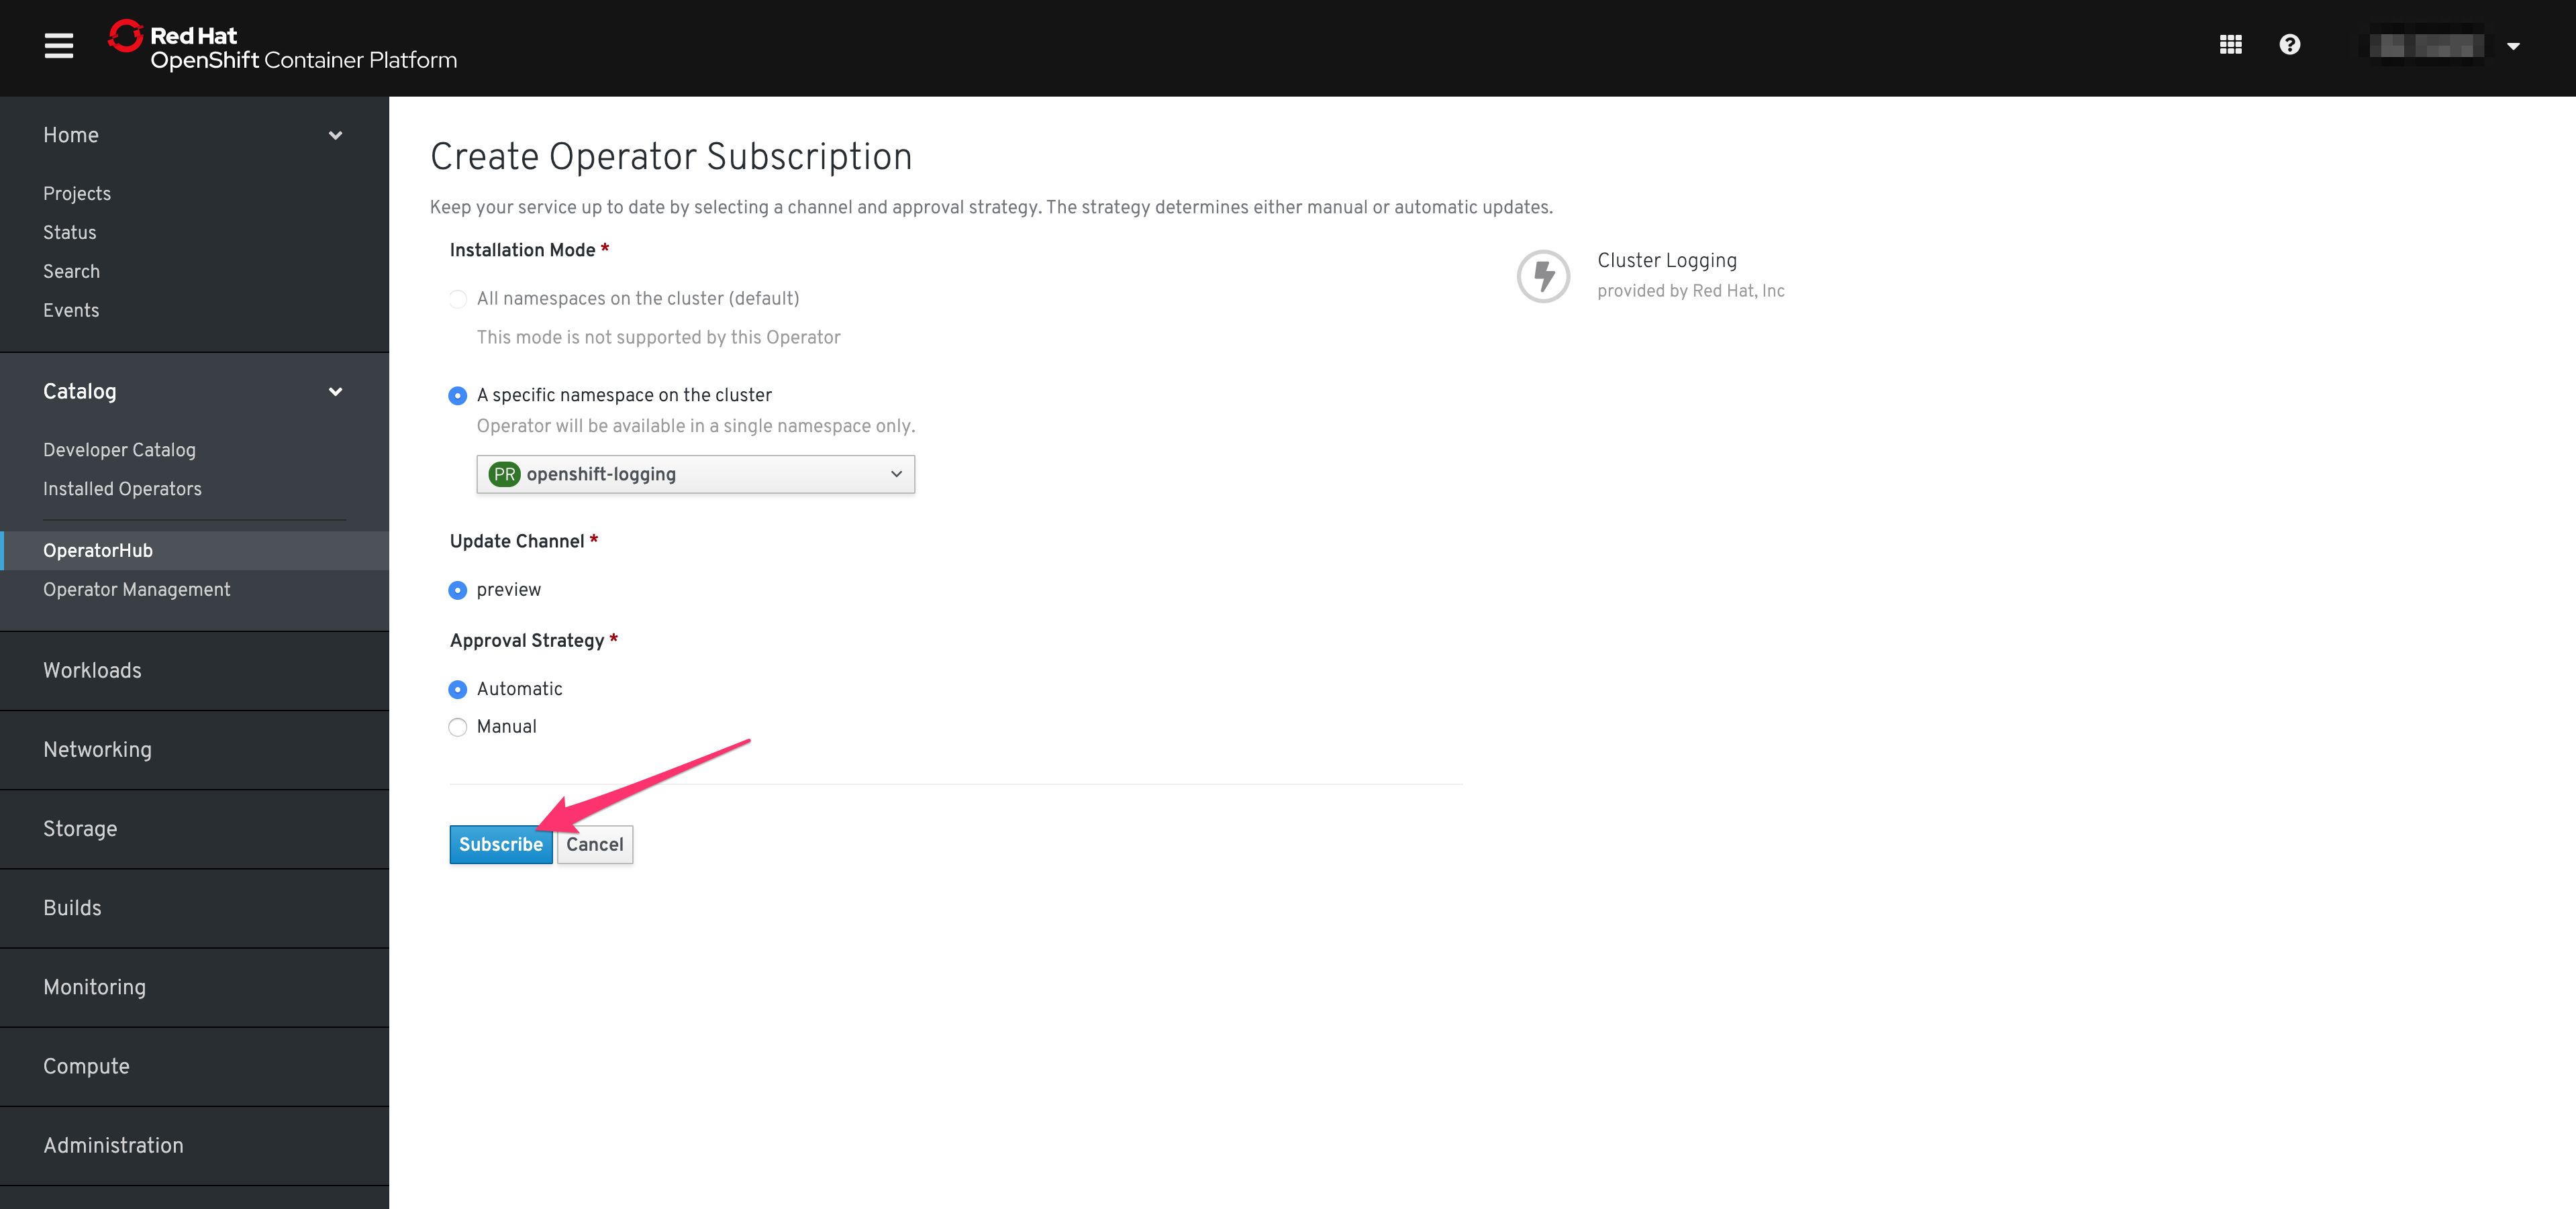
Subscribe を選択
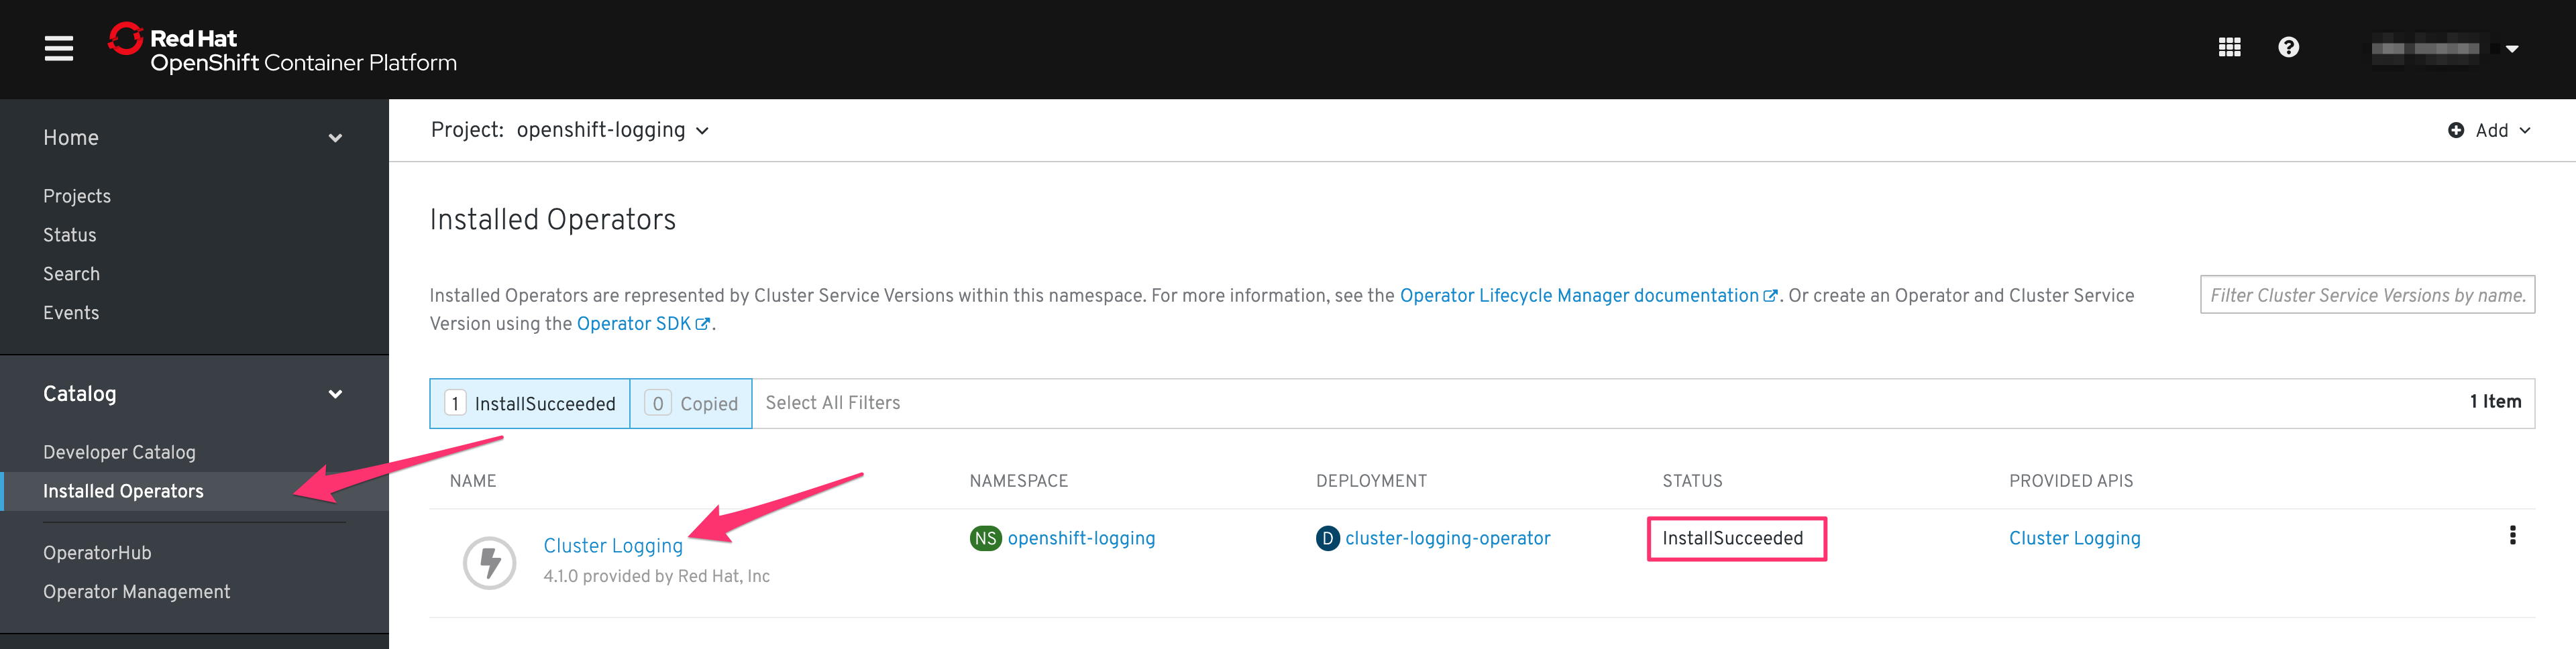
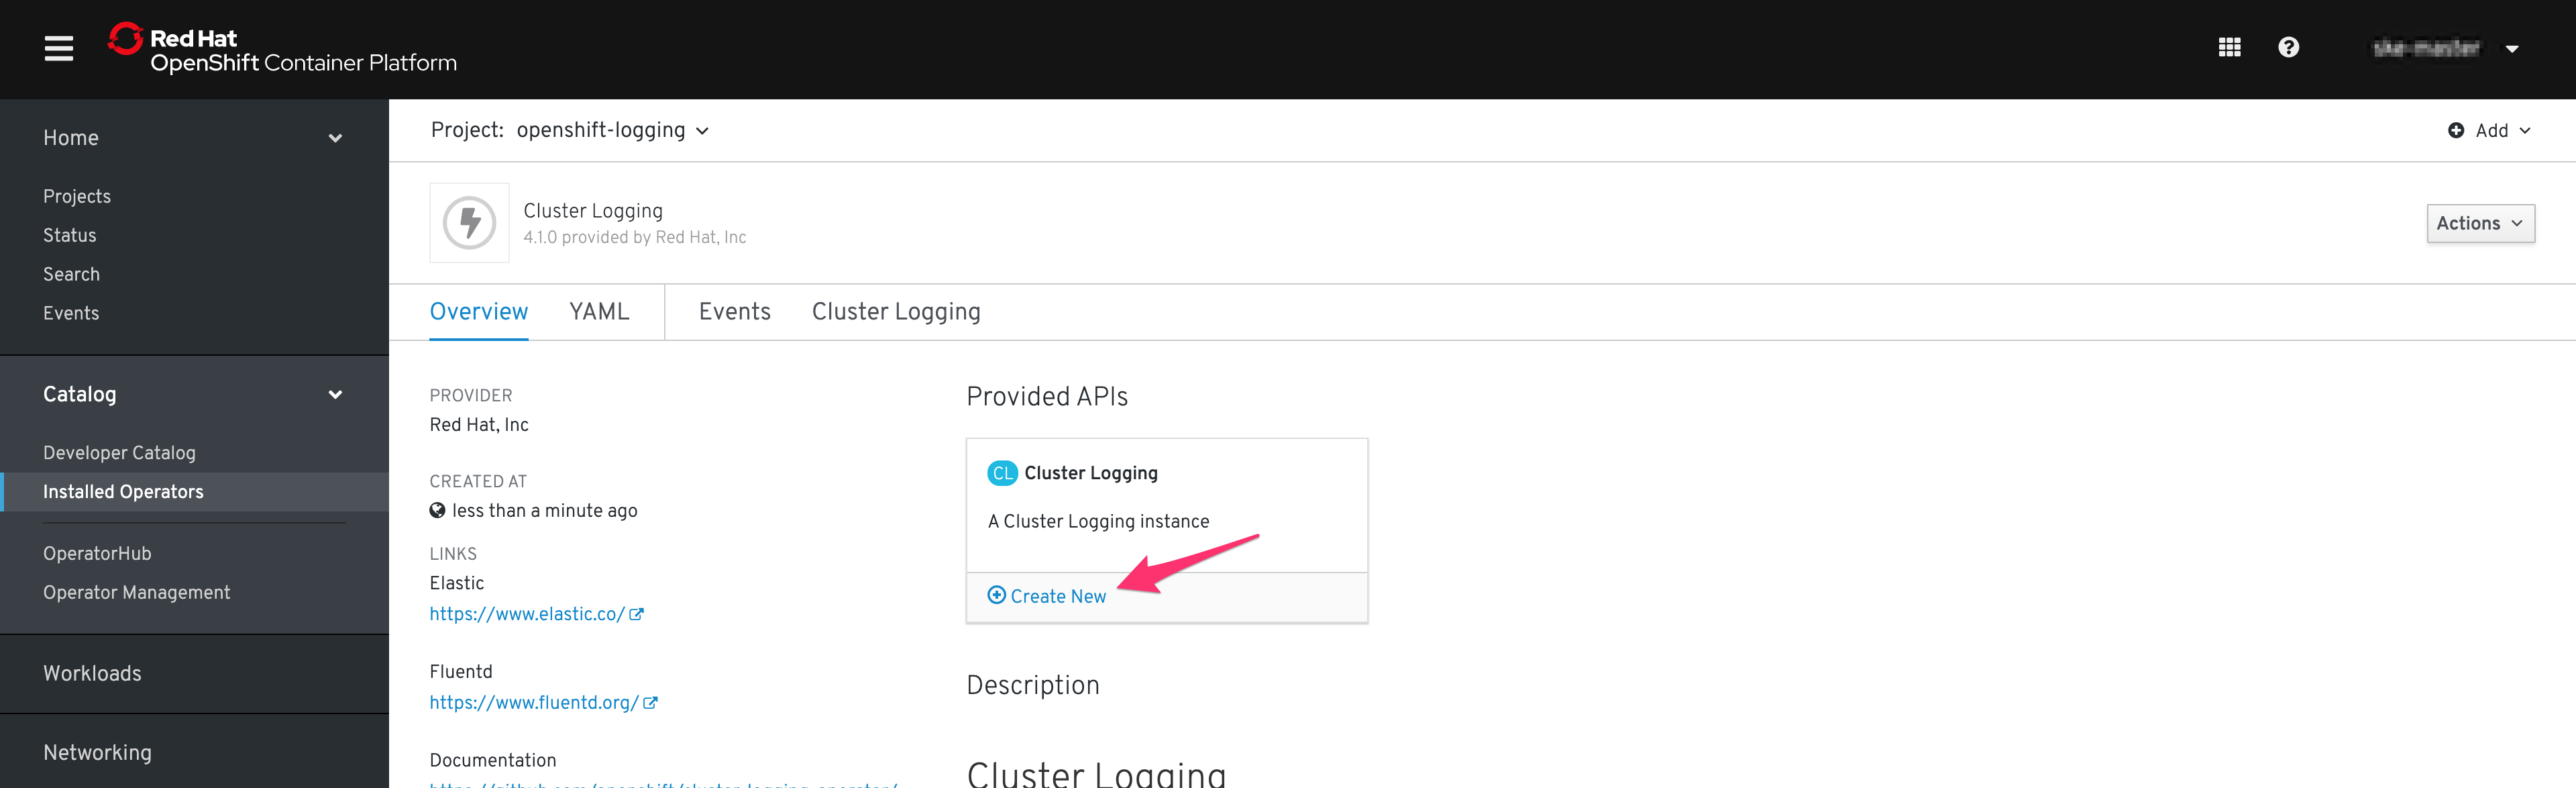
数十秒すると、Installed Operators に Cluster Logging が Install Succeeded になります。
Create New を選択
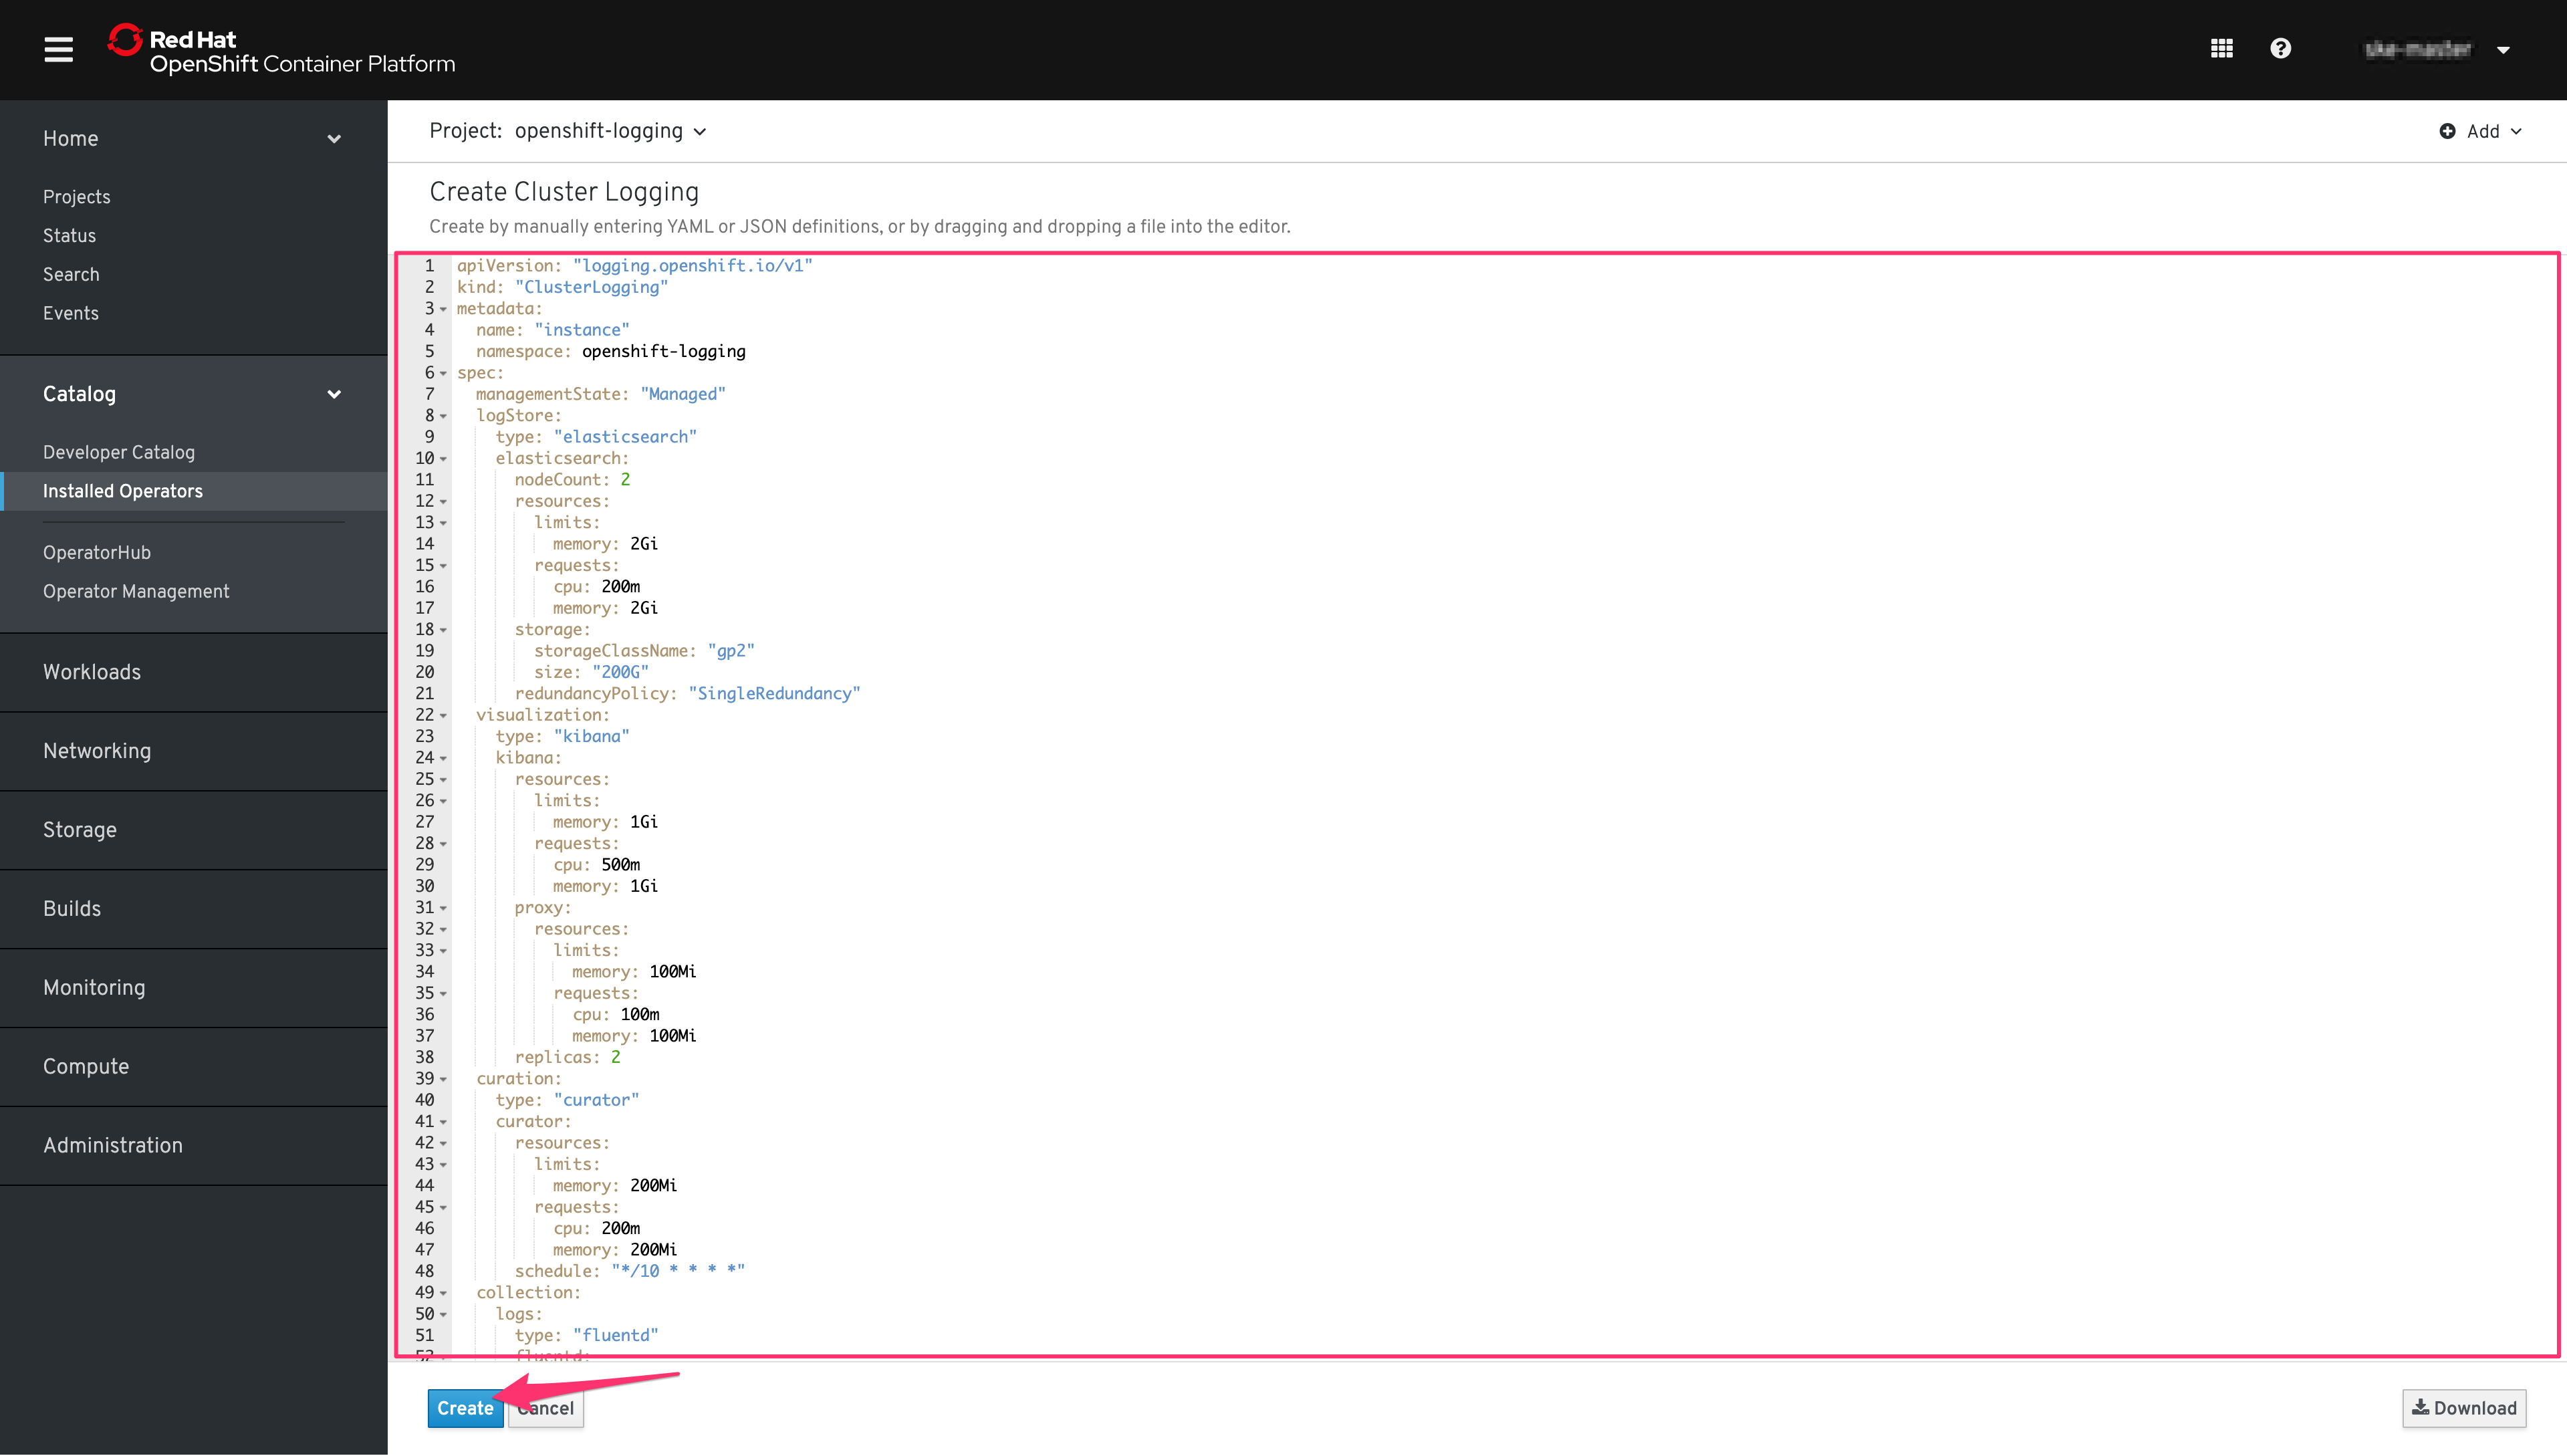
clusterlogging.yaml の内容をコピペして、Create を選択
すべてのPodが上がってくるまで少し時間がかかりますが、
https://kibana-openshift-logging.apps.YOURCLUSTERNAME.YOURDOMAIN/ にアクセスすると、Kibanaにアクセスでき、そこから Elasticsearch にストアされたログが見ることができるようになっているはずです。
気になる点
Cluster Logging Operator の Subscribe と同様に、 Elasticsearch Operator についてもやらないとだめなんじゃないかと思いますが、公式ドキュメントには書いてない気がします。
Installed になることを確認するとは書いてあるのですが、Elasticsearch Operator を Subscribe するだけでは、Elasticsearch Operator は Subscribe されませんでした... (手順ミスった?)