As I wrote in my previous post, I've been following the idea of treating unix as an IDE and one of the components for that is using gdb for debugging. Although I am no gdb expert, I've used it on and off throughout the years. This article will not be a gdb tutorial for complete beginners. Instead, I will give some tips that I think I would have found useful when I started to use gdb.
1. The power of readline
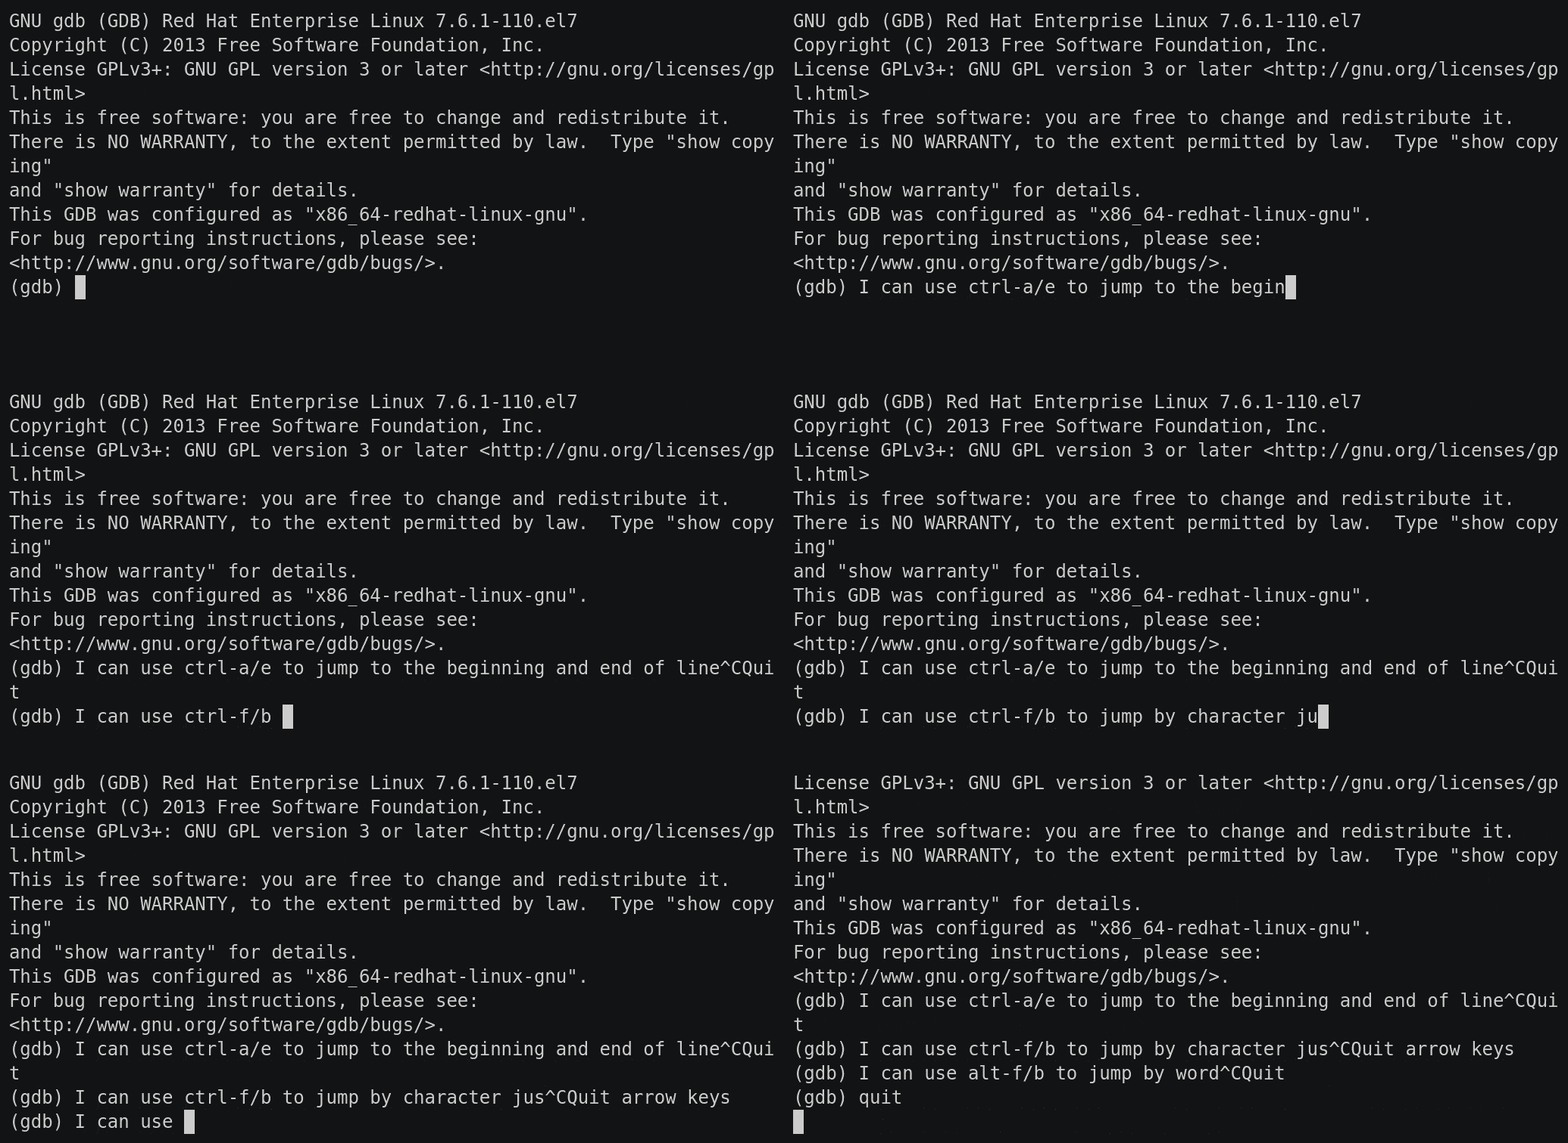
Gdb uses the readline library for handling command input. That means you have very similar features for gdb's input prompt as you do for bash. So commands like ctrl-a/e to jump to start/end of the line, ctrl-f/b to jump forward/backward one character, alt-f/b to jump forward/backward a word, ctrl-w to delete word before the cursor and so on.
Gdb also supports history and searching it. To enable, add the following lines to your ~/.gdbinit
set history save on
set history size 2048
set history filename ~/.gdb_history
Then you can use ctrl-p/n to go backwards and forwards as well as ctrl-r/s to search the history just like in bash!
2. Use gdb 8+
Since version 8 of gdb, support for rust has drastically improved. It can now properly inspect enum values as well as properly display name mangled symbols.
3. Use info function to find symbols for breakpoints
Finding the fully qualified name of the function you are looking for as well as getting the symbol name correctly so that gdb understands it can be tricky to get right. Using the info functions command can help a lot with this. Simply provide a regex for the function you are looking for to search for all matching function symbols. Notice that you should not include the return type or parameters (including surrounding ()s).
(gdb) info functions parse_inst
All functions matching regular expression "parse_inst":

File src/main.rs:
11:     static fn my_project::parse_inst(&str) -> my_project::Inst;
(gdb) break my_project::parse_inst
Breakpoint 1 at 0xc3e7: file src/main.rs, line 12.
(gdb) list my_project::parse_inst
6           Acc(isize),
7           Jmp(isize),
8           Nop(isize),
9       }
10
11      fn parse_inst(input: &str) -> Inst {
12          let mut splits = input.split(' ');
13          let inst = splits.next().unwrap();
14          let val = splits.next().unwrap().parse::<isize>().unwrap();
15          match inst {
4. The tui mode
Since the default mode of gdb is "cli mode" where a single command is read and the output is printed very much like bash, I believe that gdb has received an image of being archaic compared to modern IDEs. But in reality, it does actually support an interface more similar to such tools called "text user interface" (tui) mode. You enter tui mode by entering the ctrl-x ctrl-a sequence (first press ctrl-x and then ctrl-a after). This splits your screen in two showing the code being executed in one half and the "regular" command line prompt in the other.
Tui mode also has an even speedier sub-mode: "single key mode". You can enter this by hitting ctrl-x ctrl-s sequence. Rather than entering commands and hitting enter in-between, you can use single keys to execute the common "next", "step into", "finish", "continue" etc commands. The full list can be found here. You can also print values with the p key to temporarily jump down to the prompt to finish a print command. Finally, to exit single key mode, press q.
Limitations
Although gdb is quite powerful for debugging rust code, there are still some issues.
Macros is one obvious limitation. If you want to debug code that's inside a macro, you don't know where you are in the execution since gdb is not smart enough to be able to expand the macro for you. There is no easy remedy for this afaik, other than having the macro definition/expanded code open next to gdb and manually figure out where you are.
Sadly, another limitation is async code. Debugging async code is still quite painful in gdb although possible. The issue is typically around await points where execution is handed back to the runtime. You can circumvent this by putting a breakpoint after the await and continue execution until it hits that point. Far from ideal but workable. And afaik this is a common issue in most languages that support async programming.
Conclusion
Although there are some limitations, gdb is a very powerful tool and I've only touched on the most basic features. Other common debug tools are conditional breakpoints, moving up and down the call stack and jumping to different threads. But it also has more powerful features like executing custom command sequences on breakpoints and even a python api. Learning even basic gdb is both not too hard and well worth the investment in my opinion.


