0
3

Delete article

Deleted articles cannot be recovered.

Draft of this article would be also deleted.

Are you sure you want to delete this article?

More than 5 years have passed since last update.

matplotlibのAxesの枠線の太さを変える

Posted at

例えば、x軸とy軸のみ表示する

plot_out.jpg

axes_line_width.py
# !/usr/bin/env python3

import numpy as np
import matplotlib.pyplot as plt

# prepare test data
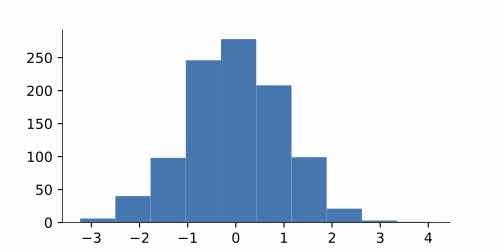
data=np.random.randn(1000)

# plot
fig=plt.figure(figsize=(5,2.5))
ax=fig.add_subplot(111)
ax.hist(data)  # histogram

axis=['top','bottom','left','right']
line_width=[0, 0.5, 0.5, 0]

for a,w in zip(axis, line_width):  # change axis width
    ax.spines[a].set_linewidth(w)

plt.savefig('plot_out.pdf')

環境

Ubuntu 18.04
Python 3.7.2
matplotlib 3.0.3
seaborn 0.9.0
numpy 1.15.4

0
3
0

Register as a new user and use Qiita more conveniently

  1. You get articles that match your needs
  2. You can efficiently read back useful information
  3. You can use dark theme
What you can do with signing up
0
3

Delete article

Deleted articles cannot be recovered.

Draft of this article would be also deleted.

Are you sure you want to delete this article?