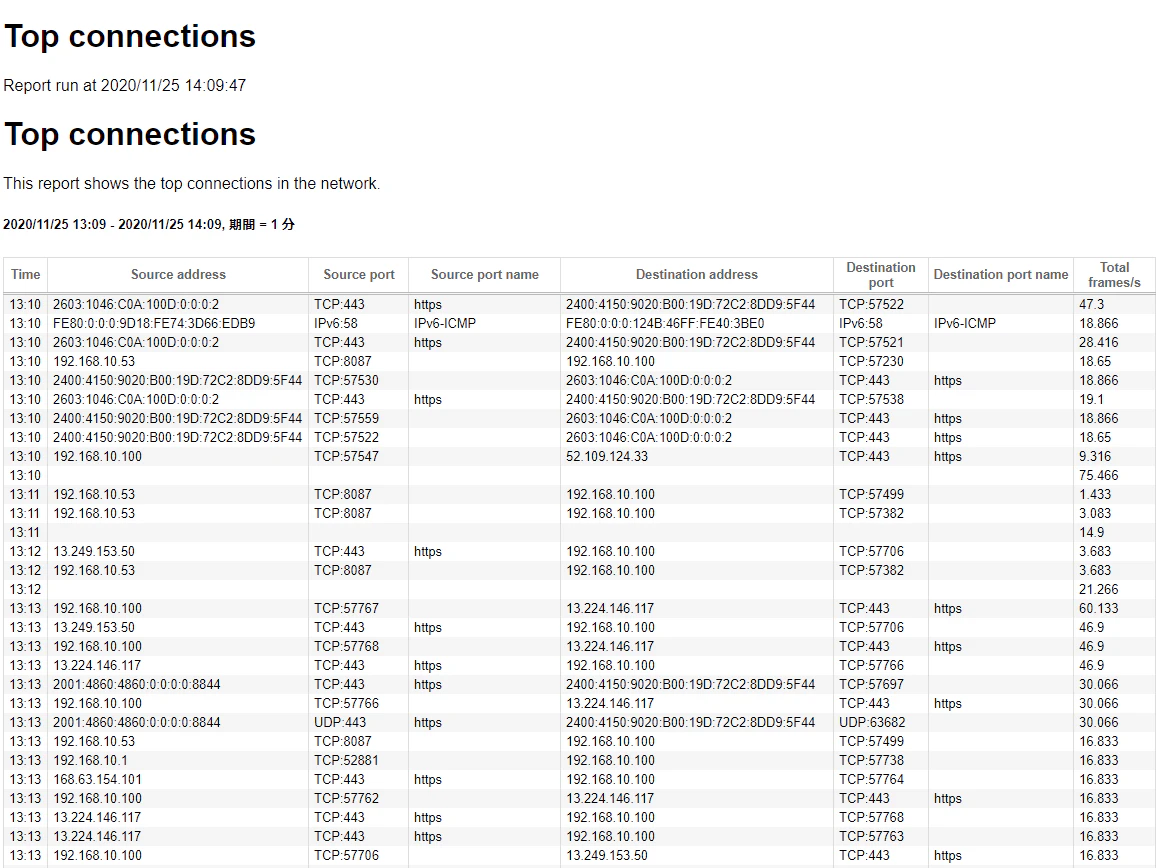
sFlow/NetFlowによるトラフィックフロー・レポート
sFlow/NetFlowを受信分析するシステムでは、時間帯別のSourceAddress、SourcePort、DestinationAddress、DestinationPort別のフローレポートを作成することが一般的と思われる。
以下にInMon社のシステムでの作成例をご紹介します。
TrafficSentinel
レポート
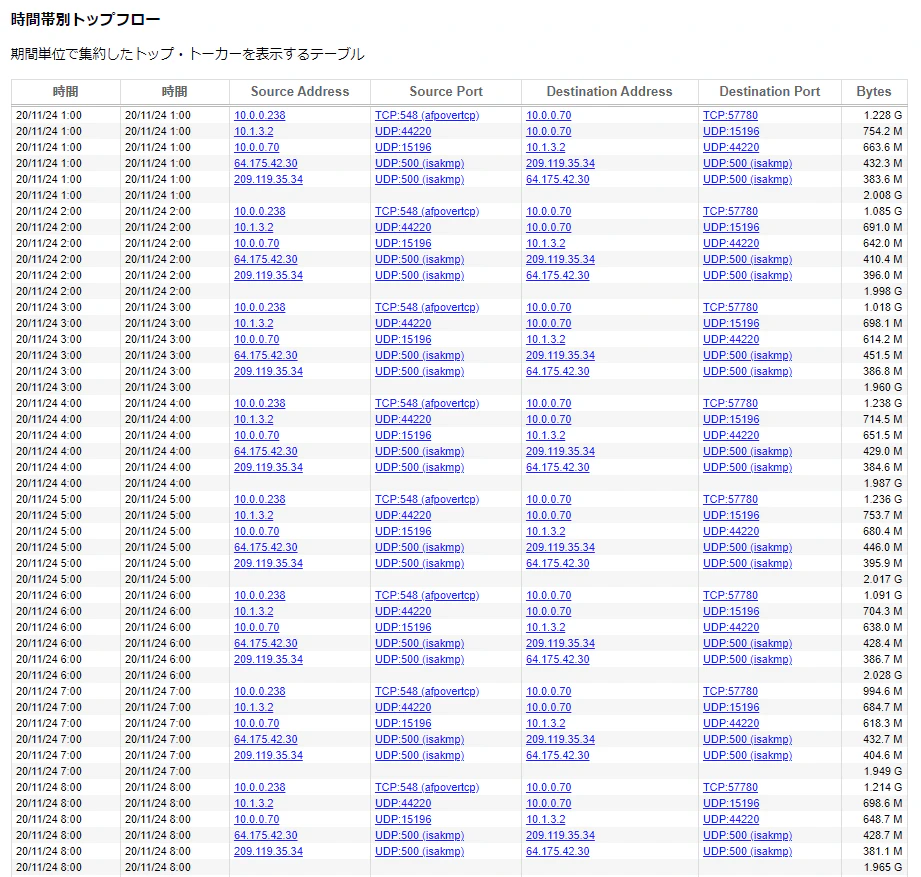
以下TrafficSentinelの時系列トラフックレポート作成画面
初期画面より、レポート>クエリのカテゴリ:Traffic、セクション:Traffic Totals by Time を選択し、下記画面を表示
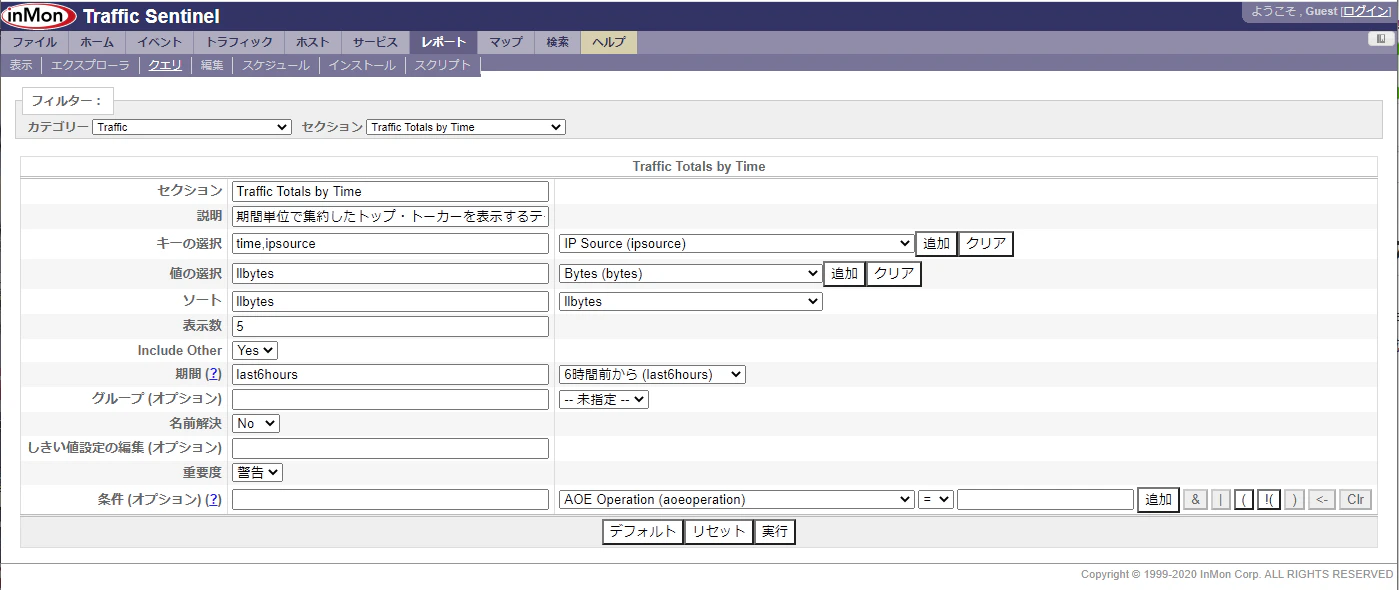
フロー情報を表示するので、キーの選択で必要な項目を選択;
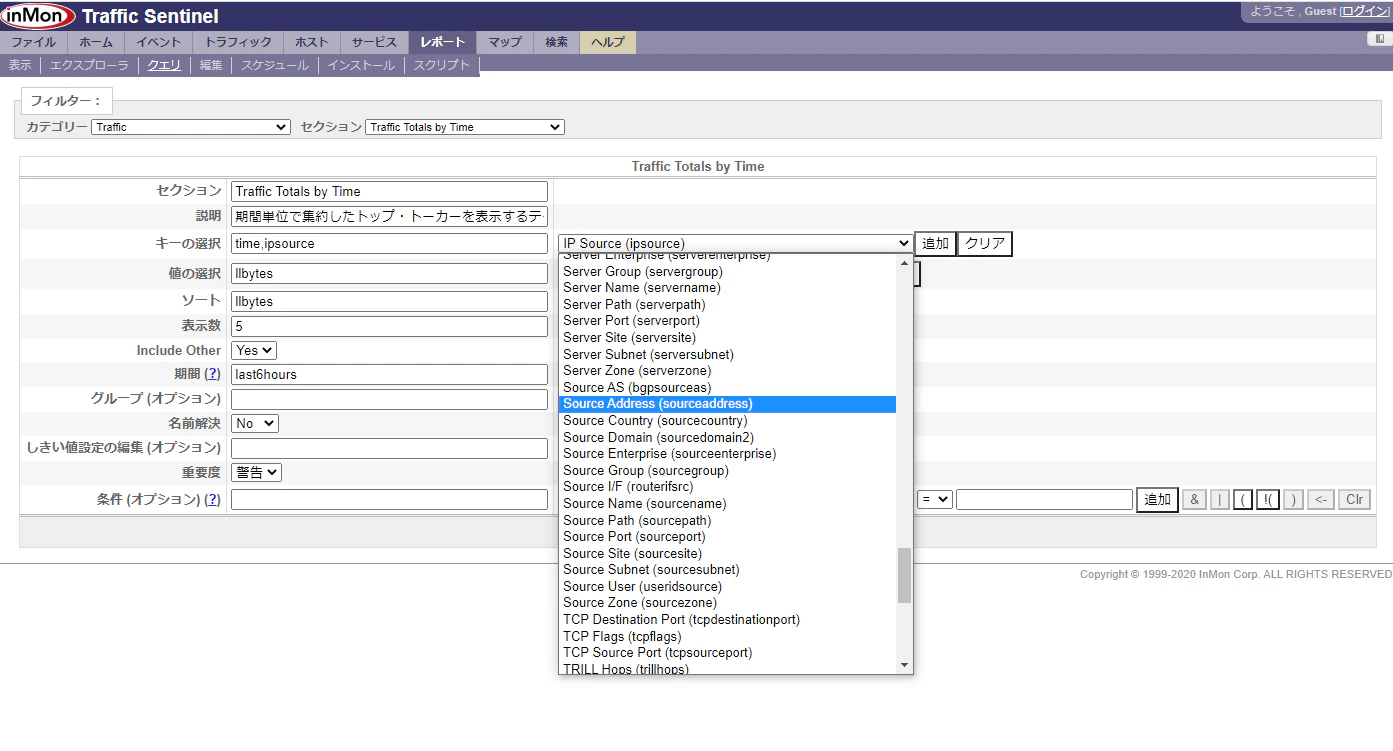
今回は、time,sourceaddress,sourceport,destinationaddress,destinationport で集約;
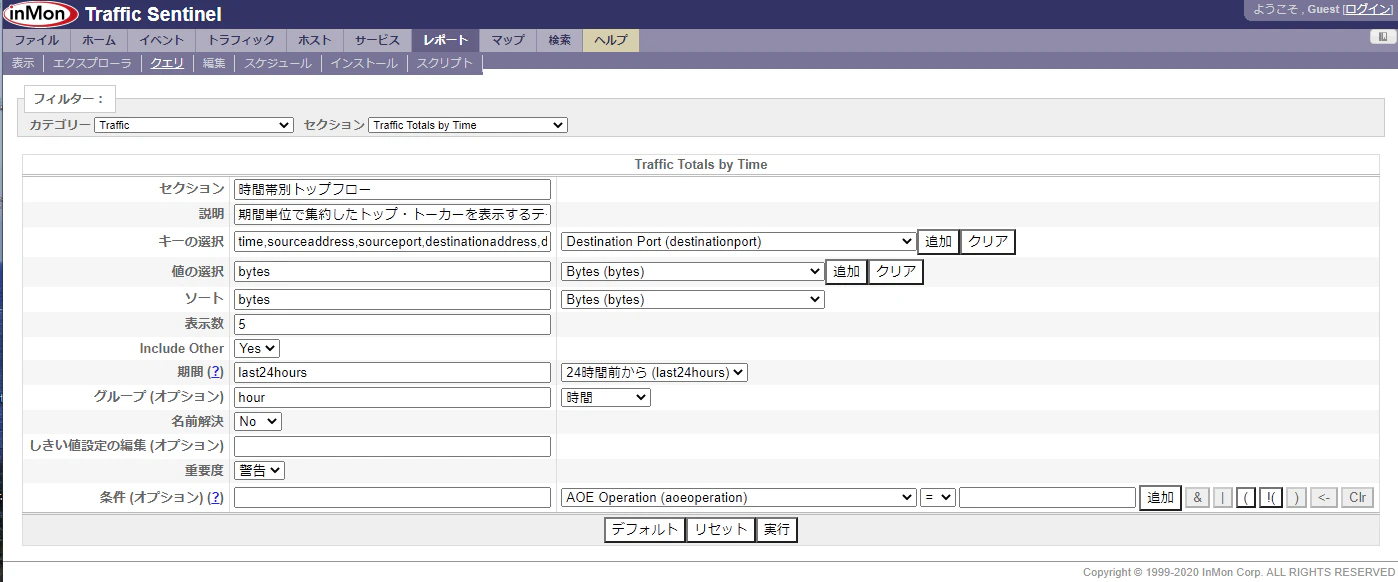
そして、実行;
このレポートは、システムが保持しているフロー全体からレポートしましたが、検索条件にて、
特定のエリア、エージェント(ネットワーク機器)、インターフェースなどで、集約して表示するのが効果的です。
例;
sourcegroup = '東京港区データセンター'
agent = 192.168.10.3
agent='192.168.10.3' & inputifindex = '1'
スクリプト
スクリプトでは;
初期画面より、レポート>スクリプトで、スクリプトを記述;
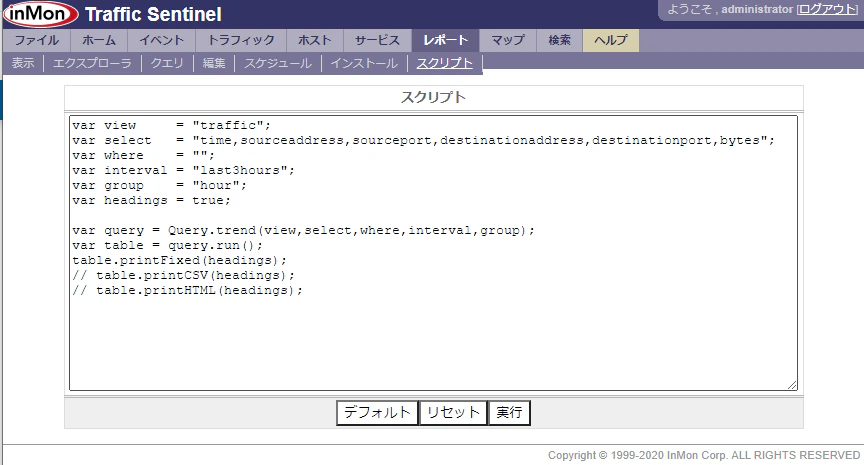
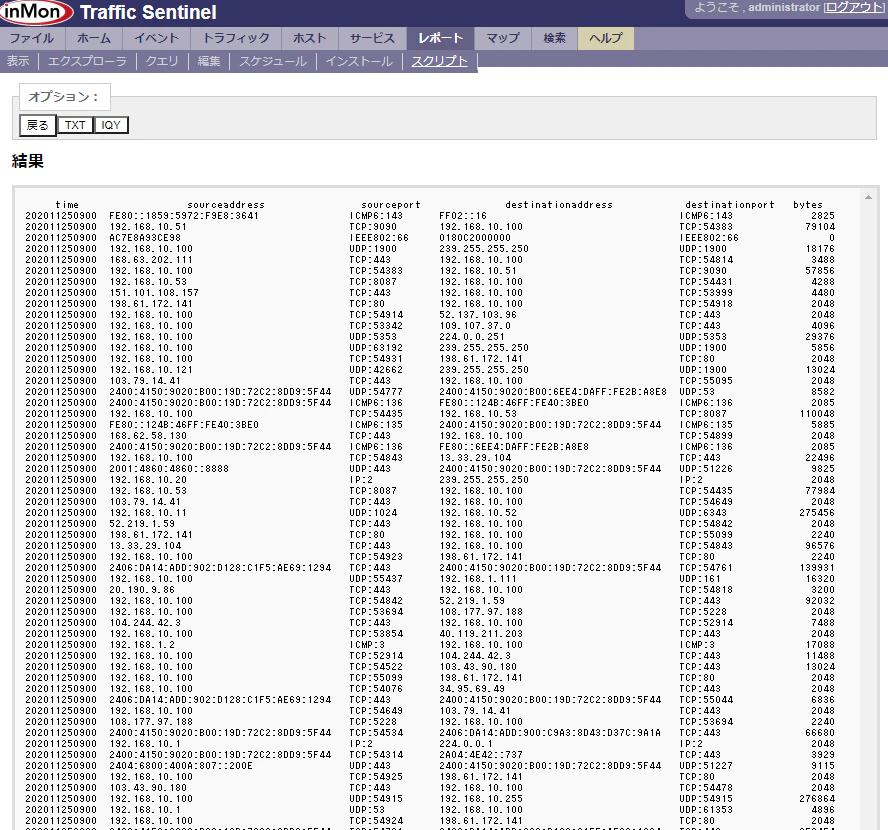
実行;
別のプログラムやシステムからスクリプトを実行してデータ取得する事も可能
sFlowTrend
sFlowTrendでのフローレポートは、
レポート>レポートの基本設定で、クエリを「Top source-destination flows」で作成;
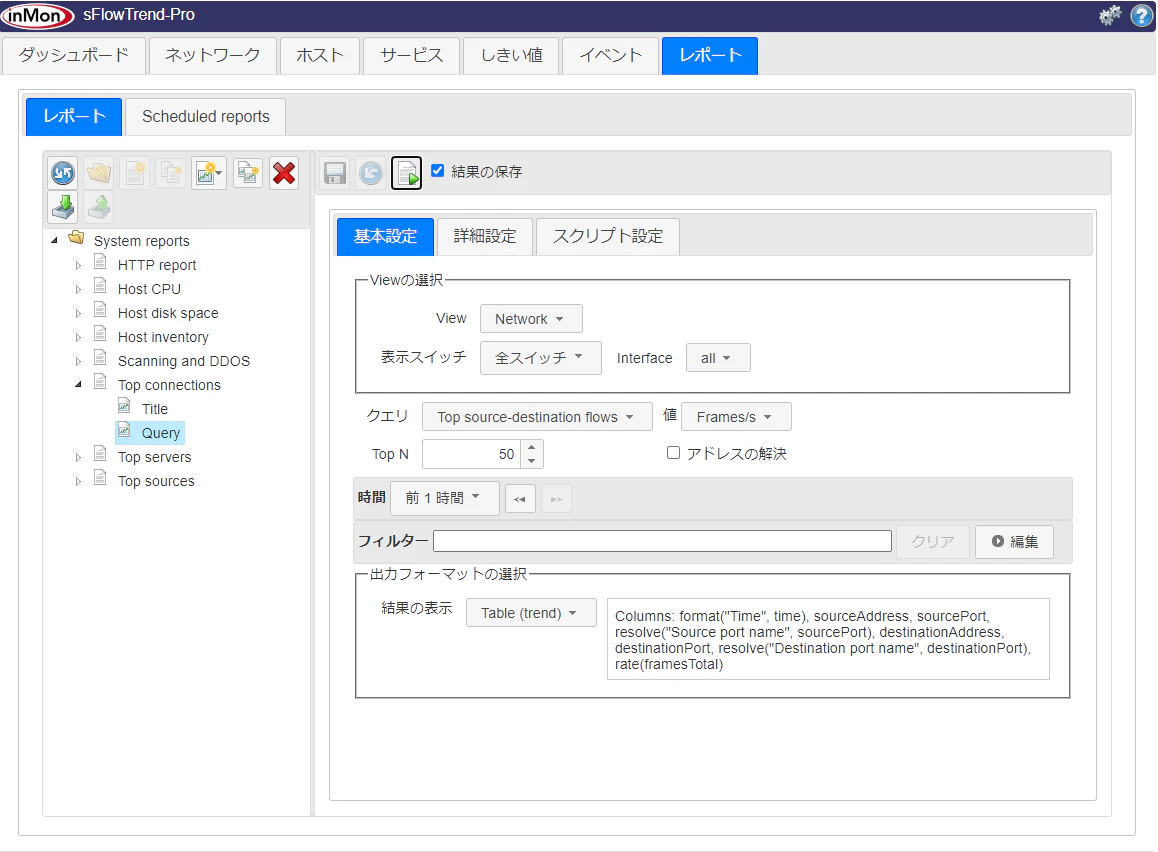
実行し表示;