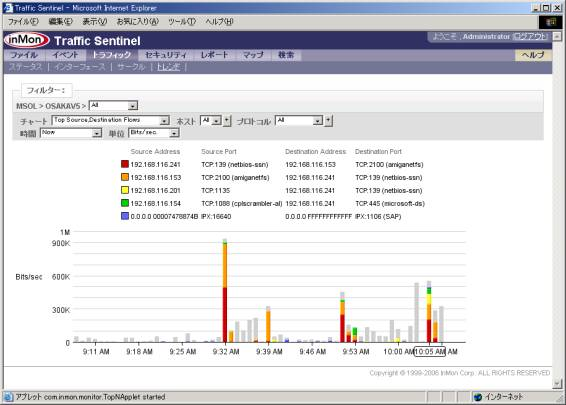
TrafficSentinelのレポート出力用テンプレート
InMonTrafficSentinelでは、ユーザが作成した、あるいは、提供されたレポート・テンプレートをインストールすることにより、レポート作成やイベントの発生などの機能を追加することが出来ます。
使用方法に関しては、下の
レポートテンプレートのインストール・編集・スケジュール化方法
を参照ください。
テンプレート・サンプル
detect_report.xml
指定したフロー情報のフレーム数やバイト数に対してしきい値を設け、しきい値超過時にイベントを発生。
<template name="Detect Report" category="miscellaneous">
<description>Detect Report</description>
<section name="Detect Report">
<description>Detect Report</description>
<input label="キーの選択" name="keys" type="view.rttraffic.key[]" value="time,sourceaddress,ipprotocol"/>
<input label="値" name="value" type="string" value="fps">
<option value="frames"/>
<option value="fps"/>
<option value="bytes"/>
<option value="Bps"/>
<option value="bps"/>
</input>
<input label="期間" name="interval" type="interval.realtime" value="last60minutes"/>
<input label="グループ" name="group" type="group" value="hour"/>
<input label="名前解決" name="lookupnames" type="string" value="no">
<option value="yes"/>
<option value="no"/>
</input>
<input label="条件" name="where" type="filter.rttraffic" required="false"/>
<input label="しきい値" name="thresh" type="integer" value="10000"/>
<script> var report = new Report(); var truncate = ""; var filter = null; if(typeof(where) != 'undefined') filter = where; var vcol; switch(value) { case "frames": vcol = "frames"; break; case "fps" : vcol = "rate(frames)"; break; case "bytes" : vcol = "bytes"; break; case "Bps" : vcol = "rate(bytes)"; break; case "bps" : vcol = "rate(bytes)"; break; default : vcol = "frames"; } var select = keys.toString() + "," + vcol; var query = new Query.topN("rttraffic",select,filter,interval,vcol,truncate); query.group = group; var table = query.run(); if("bps" == value) table.scaleColumn(table.ncols - 1,8); if("yes" == lookupnames) table.addressesToNames(); table.cnames[table.ncols - 1] = value; var violations = Table.create(table.cnames,table.ctypes); for(var r = 0; r < table.nrows; r++) { if(table.cell(r,table.ncols - 1) > thresh) violations.addRow(table.row(r)); } report.table(violations); // if the threshold is set and the first row exceeded it, then raise an event if(typeof(thresh) != 'undefined' && table.nrows > 0 && violations.cell(0, table.ncols - 1) > thresh) { report.sendEvent("threshold", "severe"); } </script>
</section>
</template>
ASAccounting_2.xml
BGPに対するWANトラフィックをレポート。
<template name="BGP Accounting" category="accounting">
<description>WAN traffic reports for BGP</description>
<section name="Total by AS">
<description>Accumulate total bytes to or through each active AS.</description>
<usage/>
<input name="interval" type="interval.history" value="yesterday"/>
<input name="where" type="filter.historytrmx" required="false"/>
<script> var report = new Report(); var filt = ""; if(typeof(where) != 'undefined') filt = where; // first make the query to get the totals for each as path var view = "historytrmx"; var select = "bgpdestinationaspath,bytes"; var sort = "bytes"; var query = Query.topN(view, select, filt, interval, sort, null); var table = query.run(); // now accumulate the total against each individual ASN var totals = new Array(); for(var i=0; i<table.nrows; i++) { var path = table.cell(i, 0); var bytes = table.cell(i, 1); if(path) { var asns = path.split("-"); for each (var asn in asns) { if(!totals[asn]) totals[asn] = 0; totals[asn] += bytes; } } } // create a two-column table to hold the results var results = Table.create(["AS", "MBytes"],["as","double"]); results.start = table.start; results.end = table.end; // add the rows to the table one at a time for (var asn in totals) { var row = new Array(asn, totals[asn]); results.addRow(row); } // sort by bytes results.sort(1, true); // add another column to represent Mbits/sec var seconds = (table.end.getTime() - table.start.getTime()) / 1000; var rates = new Array(); var scale = (8 / (seconds * 1000000)); for(var i=0; i< results.nrows; i++) { rates[i] = results.cell(i,1) * scale; } results.addColumn("Mbits/sec", "double", rates); // scale the bytes column to make it just show MBytes instead of bytes results.scaleColumn(1, (1 / 1000000)); // insert the AS names as another column var names = (new Network()).asMap(results.column(0)); results.insertColumn("AS Name", "string", names, 1); //add to report report.table(results); </script>
</section>
<section name="Total by Source AS">
<description>Accumulate total bytes from each Source AS.</description>
<usage/>
<input name="interval" type="interval.history" value="yesterday"/>
<input name="where" type="filter.historytrmx" required="false"/>
<script> var report = new Report(); var filt = ""; if(typeof(where) != 'undefined') filt = where; var view = "historytrmx"; var select = "bgpsourceas,bytes"; var sort = "bytes"; var query = Query.topN(view, select, filt, interval, sort, null); var table = query.run(); // add another column to represent Mbits/sec var seconds = (table.end.getTime() - table.start.getTime()) / 1000; var rates = new Array(); var scale = (8 / (seconds * 1000000)); for(var i=0; i< table.nrows; i++) { rates[i] = table.cell(i,1) * scale; } table.addColumn("Mbits/sec", "double", rates); // scale the bytes column to make it just show MBytes instead of bytes table.scaleColumn(1, (1 / 1000000)); // insert the AS names as another column var names = (new Network()).asMap(table.column(0)); table.insertColumn("AS Name", "string", names, 1); //add to report report.table(table); </script>
</section>
</template>
ASAccounting_link.xml
BGPに対するWANリンク・トラフィックをレポート。
<template name="BGP Accounting" category="accounting">
<description>WAN link traffic reports for BGP</description>
<section name="Link Total by AS">
<description>Accumulate total bytes to or through each active AS, as seen on the given link.</description>
<usage/>
<input name="port" label="interface" type="interface" required="true"/>
<input name="interval" type="interval.realtime" value="last60minutes"/>
<input name="where" type="filter.rttraffic" required="false"/>
<script> var report = new Report(); var filt = "path = " + port; if(typeof(where) != 'undefined') filt = "(" + where + ") & (" + filt + ")"; // first make the query to get the totals for each as path var view = "rttraffic"; var select = "bgpdestinationaspath,bytes"; var sort = "bytes"; var query = Query.topN(view, select, filt, interval, sort, null); var table = query.run(); // now accumulate the total against each individual ASN var totals = new Array(); for(var i=0; i<table.nrows; i++) { var path = table.cell(i, 0); var bytes = table.cell(i, 1); if(path) { var asns = path.split("-"); for each (var asn in asns) { if(!totals[asn]) totals[asn] = 0; totals[asn] += bytes; } } } // create a two-column table to hold the results var results = Table.create(["AS", "MBytes"],["as","double"]); results.start = table.start; results.end = table.end; // add the rows to the table one at a time for (var asn in totals) { var row = new Array(asn, totals[asn]); results.addRow(row); } // sort by bytes results.sort(1, true); // add another column to represent Mbits/sec var seconds = (table.end.getTime() - table.start.getTime()) / 1000; var rates = new Array(); var scale = (8 / (seconds * 1000000)); for(var i=0; i< results.nrows; i++) { rates[i] = results.cell(i,1) * scale; } results.addColumn("Mbits/sec", "double", rates); // scale the bytes column to make it just show MBytes instead of bytes results.scaleColumn(1, (1 / 1000000)); // insert the AS names as another column var names = (new Network()).asMap(results.column(0)); results.insertColumn("AS Name", "string", names, 1); //add to report report.table(results); </script>
</section>
<section name="Link Total by Source AS">
<description>Accumulate total bytes from each Source AS, as seen on the given link.</description>
<usage/>
<input name="port" label="interface" type="interface" required="true"/>
<input name="interval" type="interval.realtime" value="last60minutes"/>
<input name="where" type="filter.rttraffic" required="false"/>
<script> var report = new Report(); var filt = "path = " + port; if(typeof(where) != 'undefined') filt = "(" + where + ") & (" + filt + ")"; var view = "rttraffic"; var select = "bgpsourceas,bytes"; var sort = "bytes"; var query = Query.topN(view, select, filt, interval, sort, null); var table = query.run(); // add another column to represent Mbits/sec var seconds = (table.end.getTime() - table.start.getTime()) / 1000; var rates = new Array(); var scale = (8 / (seconds * 1000000)); for(var i=0; i< table.nrows; i++) { rates[i] = table.cell(i,1) * scale; } table.addColumn("Mbits/sec", "double", rates); // scale the bytes column to make it just show MBytes instead of bytes table.scaleColumn(1, (1 / 1000000)); // insert the AS names as another column var names = (new Network()).asMap(table.column(0)); table.insertColumn("AS Name", "string", names, 1); //add to report report.table(table); </script>
</section>
</template>
barcountertrend.xml
エージェント別・インターフェース別トラフィック量総計を日別・月別にバー形式レポートとして表示。
<template name="Custom I/F Trend" category="interfaces">
<description>Custom interface counter trend charts</description>
<section name="Interface Trend Bar Chart">
<description>Trend total bytes as a bar chart.</description>
<input name="ifx" label="Interface" type="interface"/>
<input name="interval" label="Interval" type="interval.history" value="thismonth"/>
<input name="charttitle" label="Chart Title" type="string" required="false"/>
<script>
<![CDATA[ var report = Report.current(); var cnames = 'time,ifinoctets,ifoutoctets'; var group; var _dates = Query.timeRange(interval,null,'historycounters'); var _delta = _dates[1].getTime() - _dates[0].getTime(); if(_delta <= 2764800000) group = 'day'; else group = 'month'; var q = Query.trend('historycounters2',cnames,'interface='+ifx,interval,group); var t = q.run(); // create totals column and time labels var labels = new Array(t.nrows); var totals = new Array(t.nrows); for(var r = 0; r < t.nrows; r++) { totals[r] = t.cell(r,1) + t.cell(r,2); labels[r] = formatdate(t.cell(r,0),group=='month' ? 'yyyy/MM' : 'yyyy/MM/dd','ja',"JP"); } t.insertColumn('Bytes','number',totals); t.insertColumn('Time','string',labels); t.printCSV(true); var title = 'Trend'; if(typeof(charttitle) == 'undefined') { var n = Network.current(); n.path=ifx; title = n.agent() + '>' + n.displayName(); } else { title = charttitle; }; var chart = Chart.singleSeries('bar',title,t,'time',0,'bytes',1); chart.width=640; report.chart(chart); ]]>
</script>
</section>
<section name="Agent Trend Bar Chart">
<description>Trend total bytes as a bar chart.</description>
<input name="agent" label="Agent" type="agent"/>
<input name="interval" label="Interval" type="interval.history" value="thismonth"/>
<input name="charttitle" label="Chart Title" type="string" required="false"/>
<script>
<![CDATA[ var report = Report.current(); var cnames = 'time,ifinoctets,ifoutoctets'; var group; var _dates = Query.timeRange(interval,null,'historycounters'); var _delta = _dates[1].getTime() - _dates[0].getTime(); if(_delta <= 2764800000) group = 'day'; else group = 'month'; var q = Query.trend('historycounters2',cnames,'agent='+agent,interval,group); var t = q.run(); // create totals column and time labels var labels = new Array(t.nrows); var totals = new Array(t.nrows); for(var r = 0; r < t.nrows; r++) { totals[r] = t.cell(r,1) + t.cell(r,2); labels[r] = formatdate(t.cell(r,0),group=='month' ? 'yyyy/MM' : 'yyyy/MM/dd','ja',"JP"); } t.insertColumn('Bytes','number',totals); t.insertColumn('Time','string',labels); t.printCSV(true); var title = 'Trend'; if(typeof(charttitle) == 'undefined') { var n = Network.current(); n.path=agent; title = n.agent(); } else { title = charttitle; }; var chart = Chart.singleSeries('bar',title,t,'time',0,'bytes',1); chart.width=640; report.chart(chart); ]]>
</script>
</section>
</template>
tablecountertrend.xml
カウンターデータを表形式で表示。
<template name="Tabular Counter Queries" category="interfaces">
<description>Queries returning tabular counter data.</description>
<section name="Tabular Counter Trend">
<description>Display counter trend as a table.</description>
<input label="Interface" name="port" type="interface"/>
<input label="Select" name="select" type="view.historycounters.value[]" value="ifinutilization,ifoututilization"/>
<input label="Group" name="group" type="group" value="hour"/>
<input label="Interval" name="interval" type="interval.history" value="yesterday"/>
<script> var report = Report.current(); var network = Network.current(); network.path = port; var where = "interface=" + port; var query = new Query.trend("historycounters","time," + select,where,interval,group); var table = query.run(); report.heading(network.printPath()); report.table(table); </script>
</section>
</template>
checkpath.xml
特定のホストが経由するパス上のインターフェースのパフォーマンスをチェック。
<template name="Troubleshooting" category="host">
<description>Troubleshooting utilities</description>
<section name="Interfaces on Path">
<description>Test interfaces on path from host to group</description>
<input name="host" type="string" label="Host"/>
<input name="group" type="string" label="Destination Group" value="grc"/>
<input name="truncate" type="integer" label="Truncate" value="50"/>
<input name="interval" type="interval.realtime" label="Interval" value="last60minutes"/>
<input name="where" type="filter.rttraffic" label="Where" required="false"/>
<script> var report = new Report(); var net = new Network(); var address = net.ipAddressFromName(host); if(!address) { report.paragraph("DNS lookup failed for " + host); } else { var view = "rttraffic"; var select = "agent,inputifindex,outputifindex,bytes,ipttl"; var where = "ipsource = " + address + " & destinationgroup = " + group; var sort = "bytes"; var n = 50; var query = Query.topN(view, select, where, interval,null, n); var table = query.run(); table.sort(4,true); report.table(table); var ttls = new Array(); var if_filter = new Array(); for(var i = 0; i < table.nrows; i++) { var agnt = table.cell(i, 0); var ifin = table.cell(i, 1); var ifout = table.cell(i, 2); if_filter.push(agnt + ">" + ifin); if_filter.push(agnt + ">" + ifout); var ttl = table.cell(i,4); ttls[agnt + ">" + ifin] = ttl; // subtracting 0.5 preserves the input to output order ttls[agnt + ">" + ifout] = ttl - 0.5; } // println("interface filter is " + if_filter); view = "rtcounters"; select = "interface,ifspeed,max(ifinutilization),max(ifoututilization),ifindiscards,ifoutdiscards,ifinerrors,ifouterrors"; where = "interface = " + if_filter; sort = "max(ifinutilization)"; n = null; var query2 = Query.topN(view, select, where, interval, sort, n); var table2 = query2.run(); report.paragraph("Traffic from " + host + " (" + address + ") to group " + group + " was seen traversing the following interfaces"); var ttlcol = new Array(); for(var i = 0; i < table2.nrows; i++) { var ifx = table2.cell(i,0); ttlcol[i] = ttls[ifx]; } table2.addColumn("IP TTL","integer",ttlcol); table2.sort(8,true); table2.cnames[2] = "Max. %Utilization In"; table2.cnames[3] = "Max. %Utilization Out"; report.table(table2); } </script>
</section>
</template>
avail-sla.xml
ルーター・スイッチの可用性をチェックするレポート。
<template name="Device availability" category="qos">
<description>Report data on availability of switches and routers</description>
<section name="% Availability of switches and routers">
<description>% availability of switches and routers based on continuity of receiving data from a switch and sysUpTime</description>
<usage>Select the Interval over which availability is to be calculated and the Path (ie >>Zone>Group>Agent hierarchy) containing devices for which the availability report is required</usage>
<input label="Interval" name="interval" type="string" value="lastHour">
<option value="lastHour"/>
<option value="today"/>
<option value="thisWeek"/>
<option value="last7Days"/>
<option value="thisMonth"/>
<option value="last30Days"/>
</input>
<input label="Path" name="path" type="path" value="" required="false"/>
<input label="Include 100%" name="includeall" type="string" value="yes">
<option value="yes"/>
<option value="no"/>
</input>
<input label="Include sysDescr" name="includeSysDescr" type="string" value="no">
<option value="yes"/>
<option value="no"/>
</input>
<script>
<![CDATA[ var view = "historycounters"; // get the interval size with a dummy query var dummy = Query.topN(view, "", "agent = null", interval, null, null).run(); // and use it to calculate the time window and uptime threshold var start_ms = dummy.start.getTime(); var end_ms = dummy.end.getTime(); var now ]]>
<![CDATA[ = new Date(); now.setSeconds(0); var now_ms = now.getTime(); if(end_ms > now_ms) end_ms = now_ms; var intervalMins = Math.round((end_ms - start_ms) / 60000); var centiSecsSinceStart = Math.round((now_ms - start_ms) / 10); var net = new Network(); if(typeof(path) != 'undefined') net.path = path; var agents = net.agents(); var checkAgents = new Array(); var uptime = new Array(); // for computing mean var mean_total = 0; var mean_n = 0; // see who has been up the whole time, and count them as 100% // collect the others in a list for further processing for each (var agentIP in agents) { net.path = agentIP; var sysUp = net.sysUpTime(); if (sysUp >= centiSecsSinceStart) { if("yes" == includeall) uptime[agentIP] = 100.0; mean_total += 100.0; mean_n++; } else checkAgents.push(agentIP); } if(checkAgents.length > 0) { var where = "agent=" + checkAgents.join(); var select = "agent,count(intervalstart)"; var sort = "count(intervalstart)"; var n = null; var result = Query.topN(view, select, where, interval, sort, n).run(); for (var r=0; r < result.nrows; r++) { var agentIP = result.cell(r, 0); if(agentIP != null) { var minuteCount = result.cell(r, 1); var percentUp = minuteCount * 100.0 / intervalMins; // if percentUp == 100.0, then perhaps we should treat that the // same as if sysUpTime dated back to before the start - but what // if a switch is rebooting in less than a minute? Better to show // an extra column "last boot" so that this can be detected. See below. uptime[agentIP] = percentUp; mean_total += percentUp; mean_n++; } } } var availData = Table.create(["agent", "name", "Zone", "Group", "availability (%)", "uptime (min)", "last boot"], ["agent", "string", "string", "string", "double", "integer", "time"]); var sysDescrCol = new Array(); for (var agentIP in uptime) { net.path = agentIP; uptimePercent = uptime[agentIP]; var sysUp = net.sysUpTime(); lastBoot_ms = now_ms - (sysUp * 10); lastBoot = new Date(lastBoot_ms); availData.addRow([net.path, net.sysName(), net.zone(), net.group(), uptimePercent, (sysUp / 6000), lastBoot]); if("yes" == includeSysDescr) sysDescrCol.push(net.sysDescr()); } if("yes" == includeSysDescr) availData.addColumn("sysDescr", "string", sysDescrCol); var report = Report.current(); var date = new Date(report.getTime()); report.heading(interval + " availability report run at " + date); // report.paragraph("" + dummy.start + " - " + dummy.end); if(availData.nrows == 0) { report.paragraph("Average availability = 100%"); } else { // should really be sorting by both availability and uptime availData.sort(4, 0); var mean = (mean_total / mean_n).toFixed(2); report.paragraph("Average availability = " + mean + "% (n=" + mean_n + ")"); } report.table(availData); ]]>
</script>
</section>
</template>
trafficlevel.xml
トラフィックレベルによるイベント・アラームを発生させるテンプレート。
しきい値のLOWER以下、あるいは、UPPER以上のビットレートが発生した場合イベントを発生させる。
<template name="Traffic Level" category="host">
<description>Traffic Level Alarms</description>
<section name="Bitrate Threshold">
<description>Raise event if host traffic exceeds threshold</description>
<input name="interval" type="interval.realtime" value="last60minutes"/>
<input name="host" type="address[]" required="true"/>
<input name="upper" type="integer" value="1000000"/>
<input name="lower" type="integer" value="0"/>
<input name="where" type="filter.rttraffic" required="false"/>
<script> var report = new Report(); var filter = "sourceaddress = " + host + " | destinationaddress = " + host; if(typeof(where) != 'undefined') filter = "(" + where + ") & (" + filter + ")"; var query = Query.topN("rttraffic", "rate(bytes)", filter, interval, null, 1); var table = query.run(); var bitrate = table.cell(0,0) * 8; if(bitrate < lower || bitrate > upper) { report.paragraph("bitrate " + bitrate + " tripped threshold, raising event"); report.sendEvent("threshold", "severe"); } else { report.paragraph("bitrate " + bitrate + " ok, not raising event"); } </script>
</section>
</template>
accuracy99.xml
99%信頼区間による長期間トラフィック総計に対する正確度を表示するテーブル(JuniperのJ-FLOWで推奨)。
<template name="accuracy99" category="Miscellaneous">
<description>99%信頼区間による長期間トラフィック総計に対する正確度を表示するテーブル</description>
<section name="Historical Traffic Accuracy">
<description>99%信頼区間による長期間トラフィック総計に対する正確度を表示するテーブル</description>
<input name="keys" type="view.historytrmx.key[]" value="ipsource"/>
<input name="value" type="view.historytrmx.value[]" value="bytes">
<option value="bytes"/>
<option value="frames"/>
</input>
<input name="truncate" type="integer" value="5"/>
<input name="interval" type="interval.history" value="yesterday"/>
<input name="lookupnames" type="string" value="no">
<option value="yes"/>
<option value="no"/>
</input>
<input name="where" type="filter.historytrmx" required="false"/>
<script>
<![CDATA[ var square = function(x) { return x * x; } var report = Report.current(); var filter = null; if(typeof(where) != 'undefined') filter = where; var select = keys.toString() + ",totalSamples,frames"; if("bytes" == value) select += ",bytes,size64,sizeto127,sizeto255,sizeto511,sizeto1023,sizeto1518"; va ]]>
<![CDATA[ r query = new Query.topN("historytrmx",select,filter,interval,value,truncate); var table = query.run(); var cindex = ("frames" == value) ? table.ncols - 2 : table.ncols - 9; var cnames = new Array(); var ctypes = new Array(); for(var i = 0; i < cindex; i++) { cnames.push(table.cnames[i]); ctypes.push(table.ctypes[i]); } if("frames" == value) { cnames.push("c.frames"); ctypes.push("integer"); } else { cnames.push("c.bytes"); ctypes.push("integer"); } cnames.push("下限"); ctypes.push("integer"); cnames.push("上限"); ctypes.push("integer"); cnames.push("誤差%"); ctypes.push("double"); var result = Table.create(cnames,ctypes); for(var r = 0; r < table.nrows; r++) { var row = new Array(); for(var i = 0; i < cindex; i++) row[i] = table.cell(r,i); var frames = table.cell(r,cindex + 1); var c = table.cell(r,cindex); var sdevframes = frames * Math.sqrt(1/c); if("frames" == value) { row[cindex] = frames; row[cindex + 1] = Math.max(0,frames - (2.58 * sdevframes)); row[cindex + 2] = frames + (2.58 * sdevframes); row[cindex + 3] = 258 * sdevframes / frames; } else { var bytes = table.cell(r,cindex + 2); var pktsize = bytes / frames; var size64 = table.cell(r,cindex + 3); var sizeto127 = table.cell(r,cindex + 4); var sizeto255 = table.cell(r,cindex + 5); var sizeto511 = table.cell(r,cindex + 6); var sizeto1023 = table.cell(r,cindex + 7); var sizeto1518 = table.cell(r,cindex + 8); var sumsqd = size64 * square(64 - pktsize); sumsqd += sizeto127 * square(96 - pktsize); sumsqd += sizeto255 * square(192 - pktsize); sumsqd += sizeto511 * square(384 - pktsize); sumsqd += sizeto1023 * square(768 - pktsize); sumsqd += sizeto1518 * square(1270 - pktsize); var sdevsize = Math.sqrt(sumsqd / frames) / Math.sqrt(c); var sdevbytes = Math.sqrt((square(sdevframes) * square(sdevsize)) + (square(frames) * square(sdevsize)) + (square(pktsize) * square(sdevframes))); row[cindex] = bytes; row[cindex + 1] = Math.max(0,bytes - (2.58 * sdevbytes)); row[cindex + 2] = bytes + (2.58 * sdevbytes); row[cindex + 3] = 258 * sdevbytes / bytes; } result.addRow(row); } if("yes" == lookupnames) result.addressesToNames(); report.table(result); ]]>
</script>
</section>
</template>
ここで提示したテンプレートは、動作を保証するものではありません。ユーザ様環境にて動作させるために編集・修正を行いご利用ください。
レポートテンプレートのインストール・編集・スケジュール化方法
InMonTrafficSentinelでは、ユーザが作成した、あるいは、提供されたレポート・テンプレートをインストールすることにより、 レポート作成やイベントの発生などの機能を追加することが出来ます。
以下は、その導入方法の例になります。
レポート・テンプレートのインストール
レポート>インストール画面の
レポート・テンプレートのインストール
にて、
インストールするテンプレート(例:detect_report.xml)を[参照]し、[実行]します。
以下の様に登録されます。
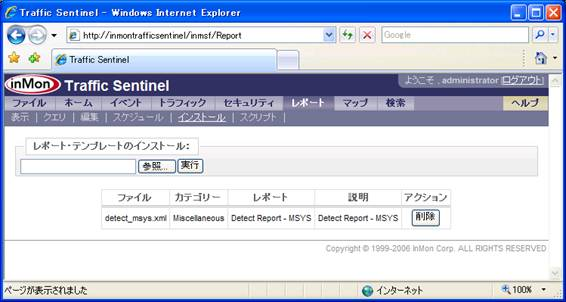
削除する場合も、この画面より[削除]ボタンにより行います。
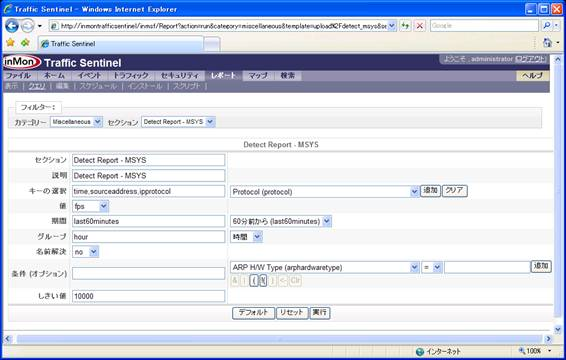
レポート・テンプレートの編集
レポート>クエリ画面で、
カテゴリー:Miscellaneous セクション:Detect Report
を選択すると、下記画面が表示されます。
レポート>編集画面で
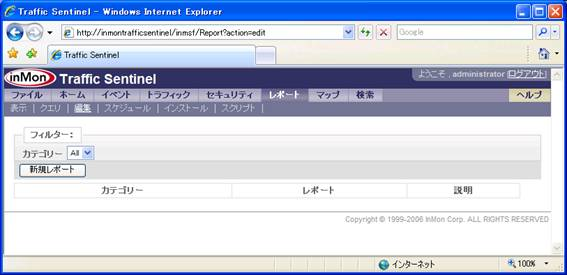
[新規レポート]をクリックし作成します。
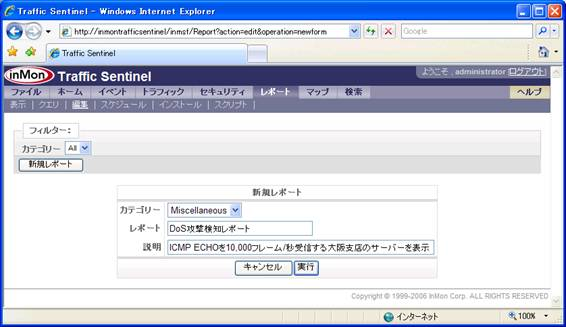
カテゴリーに任意のものを選択し(Miscellaneousを推奨)、
レポート・説明に任意に指定し、[実行]をクリックします。
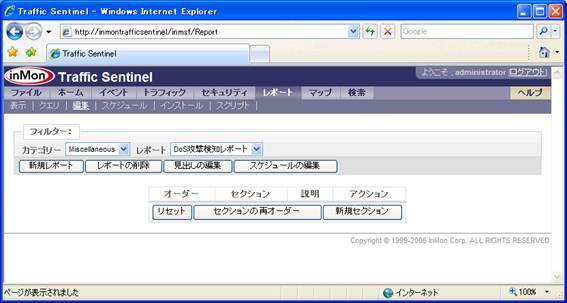
[新規セクション]ボタンをクリックして、このレポートに使用したいレポート・テンプレートを選択します。
今回は、先ほど登録した、
カテゴリー:Miscellaneous セクション:Detect Report
のレポートを指定します。
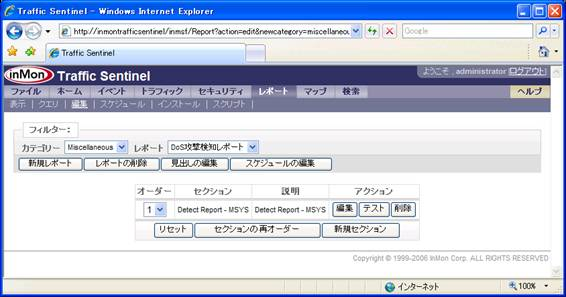
レポート内容の設定のために、[編集]をクリックします。
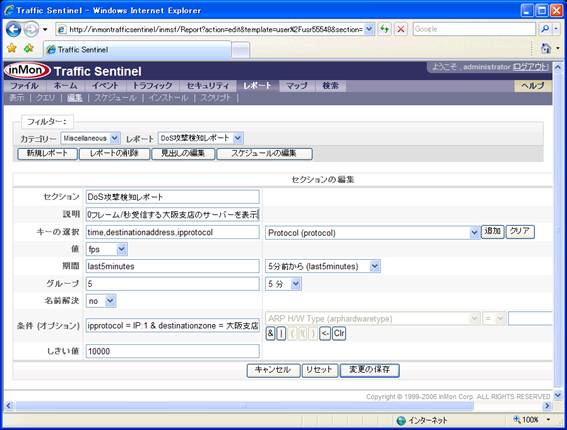
この画面で、タイトルの変更・キーの選択・フィルタリング・しきい値設定などを行います。
[変更の保存]をクリックし、変更を保存する。
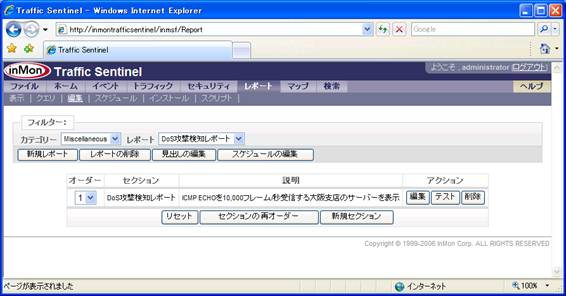
[テスト]をクリックすることで、レポートの実行をテストできます。
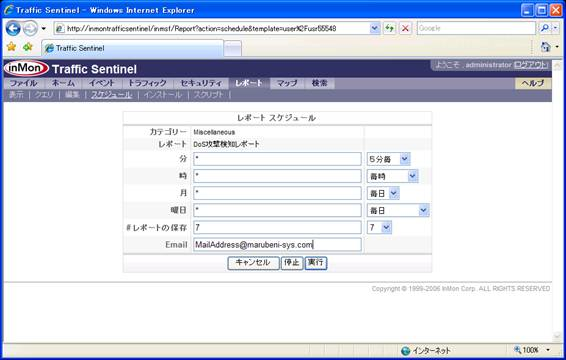
レポート・テンプレートのスケジュール化
上記画面の[スケジュールの編集]、あるいは、レポート>スケジュールにて、該当レポートの実行を
スケジュール化出来ます。
detect_msys.xmlのように、イベントを発生させるロジックが入っている場合、
実行をスケジュール化することにより、該当の条件を満たした時、イベントとして警告されます。
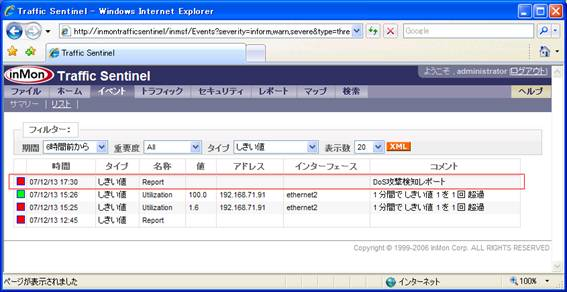
その他、メールによるイベント警告・レポート送信、SNMP-TRAPによる警告などが可能です。