[以下追記] matplotlib のバージョンが3.7.0等だと、aplpy でエラーが起きるようです。
TypeError: WCSAxes.__init__() got multiple values for argument 'wcs'
pip install matplotlib==3.5.2
などとしてダウングレードしてください。
[以上追記]
この記事からは python を使った fits 画像の取り扱いについて書いていきます。今回は、astropy.io.fits, numpy, matplotlib.pyplot, aplpy を用います。例として Spitzer の 8.0 µm データを使用します。
https://irsa.ipac.caltech.edu/data/SPITZER/GLIMPSE/images/I/1.2_mosaics_v3.5/GLON_30-53/
から GLM_03000+0000_mosaic_I4.fits をダウンロードしました。
fits の開き方
まず必要な module を import します。
from astropy.io import fits
import numpy as np
from matplotlib import pyplot as plt
import aplpy
もし
ModuleNotFoundError: No module named 'aplpy'
などと言われてしまった場合は、pip でインストールしましょう。
pip install aplpy
astropy.io.fits を使って fits を開きます。path は 絶対path でも 相対path でもどちらでも大丈夫です。
hdu = fits.open("~/your/fits/dir/GLM_03000+0000_mosaic_I4.fits")[0]
後ろの [0] は普通は気にしなくて大丈夫です。hdu には header と data が格納されており、hdu.header や hdu.data と打つとそれぞれ返ってきます。header は辞書、data は numpy array です。
fits の plot
まずは最も一般的な matplotlib.pyplot を使って data を plot してみます。
plt.imshow(hdu.data)
plt.show()

カラーレンジが悪くてほとんど何も見えません。log にしてみましょう。
plt.imshow(np.log10(hdu.data))
plt.show()

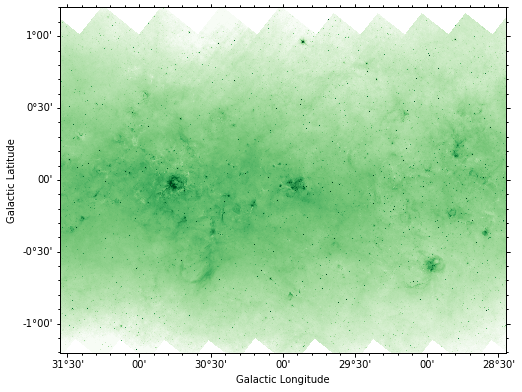
ちょっと見えました。今は軸が pixel になっているので、これを座標にします。matplotlib でも可能ですが、aplpy という module を使えば簡単にできます。
fig = plt.figure(figsize=(8, 8))
f = aplpy.FITSFigure(hdu, slices=[0], convention='wells', figure=fig)
f.show_colorscale(vmin=10, vmax=1000, stretch='log', cmap="Greens", aspect="equal")
plt.show()
ticks が外向きなのが気になる人は以下を実行しましょう。
plt.rcParams['xtick.direction'] = 'in'
plt.rcParams['ytick.direction'] = 'in'
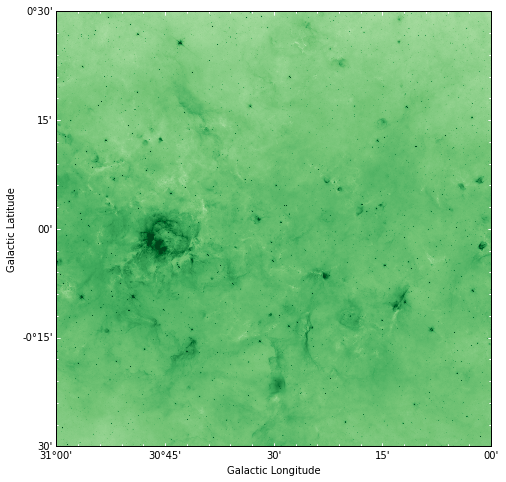
拡大図は recenter を使います。横軸の中心 (degree), 縦軸の中心 (degree), width (degree), height (degree) の順番で渡します。
fig = plt.figure(figsize=(8, 8))
f = aplpy.FITSFigure(hdu, slices=[0], convention='wells', figure=fig)
f.show_colorscale(vmin=10, vmax=1000, stretch='log', cmap="Greens", aspect="equal")
f.recenter(30.5, 0.0, width=1.0, height=1.0)
plt.show()
その他 カラーバー, スケールバー, マーカーなど一通りの機能ももちろん備わっています。ドキュメントを参照して描きたい図を作りましょう。
https://aplpy.github.io/
3D fits (cube) の場合も基本的には同様で、slices=[0] の 0 部分を plot したいチャンネルに変更します。
よくあるエラー
ALMA の cube データがうまく開けない!
ALMA データはデフォルトでは 4軸目に Stokes parameter が入っています。しかも3軸目がfrequencyです。
casaで一回読み込んで出力すると大抵うまくいきます。casa のターミナルを起動して、
importfits(fitsimage="yourfits.fits", imagename="yourfits.im")
exportfits(imagename="yourfits.im/", fitsimage="yourfits_new.fits", velocity=True, dropstokes=True, overwrite=True)
で出てきた fits を使いましょう。
リンク
目次