本記事では、カタログの扱い方について紹介します。astroquery や pandas などを用います。numpy (loadtxt) だけでも一応大丈夫ですが、あまりメリットがないので pandas を使いましょう。
インストール済みでない方は
pip install astroquery
pip install pandas
を実行しましょう。
今回、例として、Spitzer 8.0 µm のアーカイブデータを使用します。
https://irsa.ipac.caltech.edu/data/SPITZER/GLIMPSE/images/I/1.2_mosaics_v3.5/GLON_30-53/
から GLM_03000+0000_mosaic_I4.fits をダウンロードしました。
astroquery
table の作成
よく用いられる Simbad についての例を紹介します。
まず必要なものを import します。
from astroquery.simbad import Simbad
from astropy import coordinates
import astropy.units as u
from matplotlib import pyplot as plt
from astropy.io import fits
import aplpy
W43 を取得します。
result_table = Simbad.query_object("W43")
print(result_table)
#    MAIN_ID        RA      DEC    ... COO_WAVELENGTH     COO_BIBCODE
#                "h:m:s"  "d:m:s"  ...
# --------------- -------- -------- ... -------------- -------------------
# SNR G030.8-00.0 18 47 32 -01 56.5 ...              O 2013A&A...558A..53K
W40 - W49 までを取得したい場合は、wildcard で指定できます。
result_table = Simbad.query_object("W 4[0-9]", wildcard=True) # なぜかこっちはスペースがいる
print(result_table)
#     MAIN_ID             RA      ... COO_WAVELENGTH     COO_BIBCODE
#                      "h:m:s"    ...
# ------------------ ------------- ... -------------- -------------------
#  LBN 028.77+03.43    18 31 26.5 ...              R 1992ApJS...79..331W
#   SNR G023.3-00.3   18 34 51.80 ...                2006ApJ...651..190L
# GRS G024.80 +00.10    18 38 14.8 ...                1984A&AS...58..197R
#   SNR G030.8-00.0      18 47 32 ...              O 2013A&A...558A..53K
#   SNR G034.6-00.5  18 56 10.650 ...                2015ApJS..217....2M
#            CTB 61       18 56.4 ...              R 2012MNRAS.422.2429A
#   IRAS 18549+0913 18 57 20.7234 ...              O 2018yCat.1345....0G
#            CTB 64      19 00 59 ...
#   SNR G035.2-01.8       19 01.6 ...              R 2012MNRAS.422.2429A
#              W 49      19 10 20 ...                2003A&A...397..133R
次は、W43 の周囲 0.5 度の天体を取得します。
result_table = Simbad.query_region("W43", radius=0.5 * u.deg)
print(result_table)
#         MAIN_ID                RA      ... COO_WAVELENGTH     COO_BIBCODE
#                             "h:m:s"    ...
# ------------------------- ------------- ... -------------- -------------------
#          SNR G030.8-00.0      18 47 32 ...              O 2013A&A...558A..53K
#        SDC G30.762-0.015   18 47 32.06 ...              I 2009A&A...505..405P
# SSTOERC G030.7626-00.0243   18 47 33.97 ...              M 2017ApJ...839..108S
# SSTOERC G030.7566-00.0121   18 47 30.71 ...              M 2017ApJ...839..108S
#  [HBM2005] G30.760-0.027    18 47 34.2 ...              m 2005MNRAS.363..405H
# SSTOERC G030.7689-00.0238   18 47 34.57 ...              M 2017ApJ...839..108S
#            [CPA2006] N52      18 47 31 ...                2006ApJ...649..759C
# SSTOERC G030.7478-00.0185   18 47 31.11 ...              M 2017ApJ...839..108S
#     AGAL G030.763-00.031    18 47 35.2 ...              s 2015ApJS..218....1M
#       [MSL2003] W43-MM45    18 47 34.4 ...                2003ApJ...582..277M
#                      ...           ... ...            ...                 ...
#  2MASS J18454366-0209104 18 45 43.6263 ...              O 2018yCat.1345....0G
#     AGAL G031.254+00.057    18 48 10.2 ...              s 2015ApJS..218....1M
# SSTOERC G030.4851-00.4363   18 48 31.64 ...              M 2017ApJ...839..108S
# SSTOERC G030.3573-00.3154   18 47 51.78 ...              M 2017ApJ...839..108S
# SSTOERC G031.2587-00.0357   18 48 30.75 ...              M 2017ApJ...839..108S
# SSTOERC G031.2505+00.0732   18 48 06.59 ...              M 2017ApJ...839..108S
#     BGPS G030.315+00.212 18 45 54.5631 ...              m 2010ApJS..188..123R
#     BGPS G030.512-00.453 18 48 38.0883 ...              m 2010ApJS..188..123R
# SSTOERC G030.2889-00.1880   18 47 17.05 ...              M 2017ApJ...839..108S
# SSTOERC G030.2597-00.0367   18 46 41.50 ...              M 2017ApJ...839..108S
# Length = 6684 rows


# もちろん座標指定でも取得できます。
result_table = Simbad.query_region(coordinates.SkyCoord(l=30.7593, b=-0.0186, frame='galactic', unit=u.deg), radius=0.5 * u.deg)
print(result_table)
#         MAIN_ID                RA      ... COO_WAVELENGTH     COO_BIBCODE
#                             "h:m:s"    ...
# ------------------------- ------------- ... -------------- -------------------
#          SNR G030.8-00.0      18 47 32 ...              O 2013A&A...558A..53K
#        SDC G30.762-0.015   18 47 32.06 ...              I 2009A&A...505..405P
# SSTOERC G030.7626-00.0243   18 47 33.97 ...              M 2017ApJ...839..108S
# SSTOERC G030.7566-00.0121   18 47 30.71 ...              M 2017ApJ...839..108S
#  [HBM2005] G30.760-0.027    18 47 34.2 ...              m 2005MNRAS.363..405H
# SSTOERC G030.7689-00.0238   18 47 34.57 ...              M 2017ApJ...839..108S
#            [CPA2006] N52      18 47 31 ...                2006ApJ...649..759C
# SSTOERC G030.7478-00.0185   18 47 31.11 ...              M 2017ApJ...839..108S
#     AGAL G030.763-00.031    18 47 35.2 ...              s 2015ApJS..218....1M
#       [MSL2003] W43-MM45    18 47 34.4 ...                2003ApJ...582..277M
#                      ...           ... ...            ...                 ...
#  2MASS J18454366-0209104 18 45 43.6263 ...              O 2018yCat.1345....0G
#     AGAL G031.254+00.057    18 48 10.2 ...              s 2015ApJS..218....1M
# SSTOERC G030.4851-00.4363   18 48 31.64 ...              M 2017ApJ...839..108S
# SSTOERC G030.3573-00.3154   18 47 51.78 ...              M 2017ApJ...839..108S
# SSTOERC G031.2587-00.0357   18 48 30.75 ...              M 2017ApJ...839..108S
# SSTOERC G031.2505+00.0732   18 48 06.59 ...              M 2017ApJ...839..108S
#     BGPS G030.315+00.212 18 45 54.5631 ...              m 2010ApJS..188..123R
# SSTOERC G030.2889-00.1880   18 47 17.05 ...              M 2017ApJ...839..108S
# SSTOERC G030.2597-00.0367   18 46 41.50 ...              M 2017ApJ...839..108S
#     BGPS G030.512-00.453 18 48 38.0883 ...              m 2010ApJS..188..123R
# Length = 6684 rows

# 論文の bibcode からも取ってこれます。
Simbad.TIMEOUT = 300 # 天体数が多いと timeout するので、長くしておく
result_table = Simbad.query_bibobj('2017ApJ...839..108S') # Saral et al. 2017
#         MAIN_ID                RA      ... COO_WAVELENGTH     COO_BIBCODE
#                             "h:m:s"    ...
# ------------------------- ------------- ... -------------- -------------------
#                  IC 1848      02 51 06 ...              O 2013A&A...558A..53K
#        NAME G305 Complex         13 13 ...                2012MNRAS.419.1871D
#         NAME RCW 106 GMC       16 21.0 ...              R 2006MNRAS.367.1609B
# SSTOERC G029.0464+00.3218   18 43 11.73 ...              M 2017ApJ...839..108S
# SSTOERC G030.5437+01.0894   18 43 12.06 ...              M 2017ApJ...839..108S
# SSTOERC G030.8961+01.2696   18 43 12.20 ...              M 2017ApJ...839..108S
# SSTOERC G030.5271+01.0799   18 43 12.25 ...              M 2017ApJ...839..108S
#  2MASS J18431248-0213585 18 43 12.4780 ...              O 2018yCat.1345....0G
# SSTOERC G029.2830+00.4386   18 43 12.74 ...              M 2017ApJ...839..108S
# SSTOERC G029.0774+00.3319   18 43 12.96 ...              M 2017ApJ...839..108S
#                      ...           ... ...            ...                 ...
# SSTOERC G049.2320-01.0191   19 25 31.43 ...              M 2017ApJ...839..108S
# SSTOERC G049.2997-00.9834   19 25 31.60 ...              M 2017ApJ...839..108S
#  2MASS J19253166+1417349  19 25 31.667 ...              I 2003yCat.2246....0C
# SSTOERC G049.2291-01.0225   19 25 31.82 ...              M 2017ApJ...839..108S
# SSTOERC G050.0326-00.5913   19 25 32.24 ...              M 2017ApJ...839..108S
# SSTOERC G049.4660-00.9020   19 25 33.39 ...              M 2017ApJ...839..108S
# SSTOERC G049.7610-00.7431   19 25 33.42 ...              M 2017ApJ...839..108S
#               NAME Cyg X      20 28 41 ...              G 2013ApJS..209...34A
#             NAME Sct-Cen               ...
#        NAME Galactic Bar               ...
# Length = 15673 rows
SNR だけ欲しい場合など、こう言う書き方もあります。詳しくはドキュメントを参照。
result = Simbad.query_criteria('region(box, GAL, 0 +0, 3d 1d)', otype='SNR')
# もしくは
script = '(region(box, GAL, 0 +0, 0.5d 0.5d) | region(box, GAL, 43.3 -0.2, 0.25d 0.25d))'
result = Simbad.query_criteria(script, otype='SNR')
print(result)
#     MAIN_ID           RA      ... COO_WAVELENGTH     COO_BIBCODE
#                    "h:m:s"    ...
# ----------------- ------------ ... -------------- -------------------
#  SNR G359.9-00.9      17 45.8 ...
#  NAME Sgr A East     17 45 41 ...                2010ApJS..188..405A
#            W 49b 19 11 09.000 ...                2015ApJS..217....2M
# SNR G000.13-00.12      17 46.4 ...                2013MNRAS.434.1339H
table の使い方
使いやすいように、coordinates.SkyCoord のオブジェクトにします。
ra, dec = result_table["RA"], result_table["DEC"]
c = coordinates.SkyCoord(ra=ra, dec=dec, frame="fk5", unit=(u.hourangle, u.deg))
# ValueError: Syntax error parsing angle ''
何かエラー出ました。おそらく座標が適切でないものが混じっているっぽいです。たぶん後ろの 2 行だと思います。
ra, dec = result_table["RA"][:-2], result_table["DEC"][:-2]
c = coordinates.SkyCoord(ra=ra, dec=dec, frame="fk5", unit=(u.hourangle, u.deg))
うまくいきました。
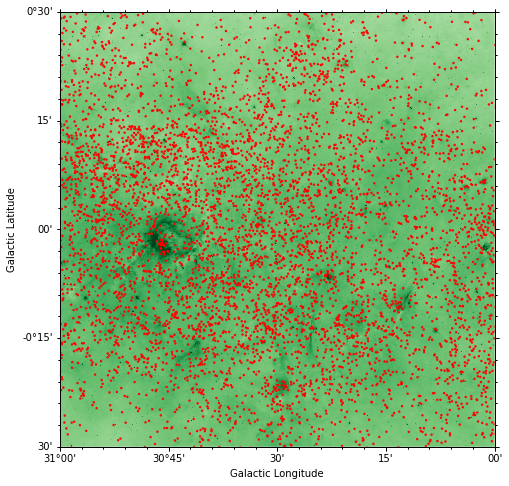
これを Spitzer 8.0 µm の上に plot してみます。
hdu = fits.open("~/your/fits/dir/GLM_03000+0000_mosaic_I4.fits")[0]

fig = plt.figure(figsize=(8, 8))
f = aplpy.FITSFigure(hdu, slices=[0], convention='wells', figure=fig)
f.show_colorscale(vmin=10, vmax=1000, stretch='log', cmap="Greens", aspect="equal")
f.recenter(30.5, 0.0, width=1.0, height=1.0)
f.show_markers(c.galactic.l.deg, c.galactic.b.deg, s=2)
plt.show()

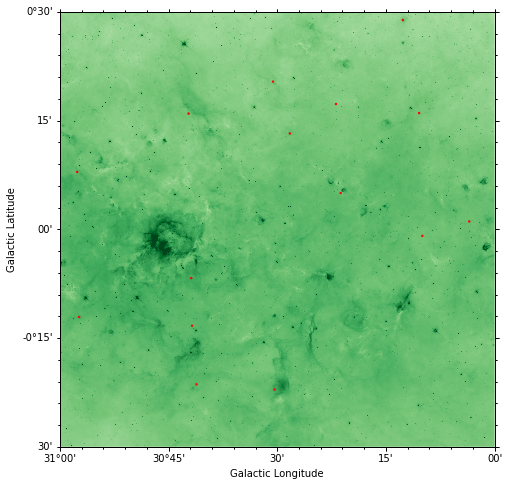
何かカタログの中の値 (result_table.columns で確認可能) で mask したい場合などは、
fig = plt.figure(figsize=(8, 8))
f = aplpy.FITSFigure(hdu, slices=[0], convention='wells', figure=fig)
f.show_colorscale(vmin=10, vmax=1000, stretch='log', cmap="Greens", aspect="equal")
f.recenter(30.5, 0.0, width=1.0, height=1.0)
mask = result_table["COO_QUAL"][:-2]=="A"
f.show_markers(c.galactic.l.deg[mask], c.galactic.b.deg[mask], s=2)
plt.show()

COO_QUAL が A のものだけを plot しました。
自前の csv ファイルを読み取る
手元にある天体のリストのテキストファイルを python で読み取る場合について紹介します。
手っ取り早いのは、excel か何かに貼って、重複する column 名を変更して (pandas なら変更しなくても ok)、テキストエディタにコピペして textfile で保存し、それを読みこむ方法です。
例として、
https://ui.adsabs.harvard.edu/abs/2017yCat..18390108S/abstract
の mysos を取ってきて Saral_test.txt と言う名前で保存しました。
import pandas as pd
import numpy as np

# delimiter で区切りを指定します。タブ (\t) 区切りの場合は
Saral_df = pd.read_csv("Saral_test.txt", delimiter="\t")
numpy array にしたい場合などは、
ra, dec, lumi, mass = np.array(Saral_df["RAJ2000"]), np.array(Saral_df["DEJ2000"]), np.array(Saral_df["Lum"]), np.array(Saral_df["Mass"])
c = coordinates.SkyCoord(ra=ra, dec=dec, frame="fk5", unit=(u.deg, u.deg))
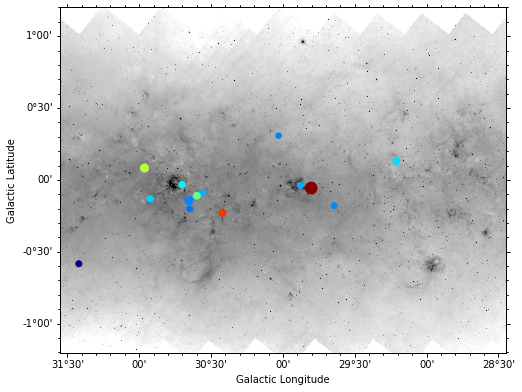
例えばluminosity で大きさを変えて、mass で色を変えて plot してみます。
fig = plt.figure(figsize=(8, 8))
f = aplpy.FITSFigure(hdu, slices=[0], convention='wells', figure=fig)
f.show_colorscale(vmin=10, vmax=1000, stretch='log', cmap="Greys", aspect="equal")
mask = Saral_df["Reg"]=="W43"
f.show_markers(c.galactic.l.deg[mask], c.galactic.b.deg[mask], s=lumi[mask]*30, c=mass[mask], cmap="jet")
plt.show()
ちなみに、論文のテーブルがうまく選択できなくてコピペできない場合などは、Google Chrome や Adobe Acrobat Reader 等を使えば選択できる可能性があります。また、論文が古すぎて画像しかない場合は、文字起こしソフト (Google にもあった気がする) を使えば、手打ちするよりは早いと思います。
以上です。
リンク
目次
