初めに
最近、pythnを使ったデータ分析に手を出し始めました。
今回はとある部屋への自分の入室時間をk-means法を用いてクラスタリングしていきます。
もちろんpythonもデータ分析もひよこ状態ですがなんとかやってみました。
k-means法について
よくk-means法で使われるデータは多次元データであり、事実Pythonで提供されているライブラリは2次元のデータを扱うものがほとんどです。
そういうわけで今回は1次元k-means法を実装して、クラスタリングしていこうと思います。
扱うデータ
自分自身がその日の最初にとある部屋へ入室した時間です。
以下の表は一部抜粋となっています。
| 入室時間 |
|---|
| 08:59:49.995 |
| 20:24:23.946 |
| 16:18:50.910 |
実装手順
k-means法によるクラスタリングは次のように実装していきます。
- ランダムな点をk個設置
- 最も近い点が同じデータでグループ化
- グループごとの重心を求めてそれを新たな点とする
- 2、3を繰り返す
- 3で同じ値に点を設置した場合に終了
- クラスタリングした結果を出力
今回はクラスタリングしたデータをグラフにより表示させる部分まで実装していきます。
実装
クラスタリング
では実際に1次元k-meansクラスタリングを実装していきます。
今回は時間データをクラスタリングすることが前提になっているので、秒単位で受け取ったデータをクラスタリングした後にhh:mm:ssの形式に直して返すようにしています。
import numpy as np

# 秒単位をhh:mm:ssへ変換
def convert_seconds_to_hms(seconds):
    hours, remainder = divmod(seconds, 3600)
    minutes, seconds = divmod(remainder, 60)
    return f"{int(hours):02d}:{int(minutes):02d}:{int(seconds):02d}"

# k-meansの実装
def k_means_clustering(data, k):
    # ステップ1: ランダムな点をk個設置
    centroids = np.random.choice(data, size=k, replace=False)

    while True:
        # ステップ2: 最も近い点が同じデータでグループ化
        groups = [[] for _ in range(k)]
        for point in data:
            distances = [np.linalg.norm(point - centroid) for centroid in centroids]
            closest_centroid_index = np.argmin(distances)
            groups[closest_centroid_index].append(point)

        # ステップ3: グループごとの重心を求めてそれを新たな点とする
        new_centroids = [np.mean(group, axis=0) for group in groups]

        # ステップ5: 新しい中心点が以前の中心点と同じであれば終了
        if np.array_equal(centroids, new_centroids):
            break

        centroids = new_centroids

    # ステップ6: クラスタリングした結果を出力
    # 出力形式
    # [{'centroid': 'クラスタ1の重心', 'points': ['データ', ...]}, {'centroid': 'クラスタ2の重心', 'points': ['データ', ...]},{'centroid': 'クラスタ3の重心', 'points': ['データ', ...]}]
    clusters = []
    for i, group in enumerate(groups):
        centroid_time = convert_seconds_to_hms(centroids[i])
        cluster_points = [convert_seconds_to_hms(point) for point in group]

        clusters.append({
            "centroid": centroid_time,
            "points": cluster_points
        })

    return clusters
こちらがk-meansを実装した関数になります。
ではこの関数を使って実際にデータをクラスタリングしていきます。
今回k=3として行っていきます。
import numpy as np

def convert_seconds_to_hms(seconds):
    hours, remainder = divmod(seconds, 3600)
    minutes, seconds = divmod(remainder, 60)
    return f"{int(hours):02d}:{int(minutes):02d}:{int(seconds):02d}"

def k_means_clustering(data, k):
    # ステップ1: ランダムな点をk個設置
    centroids = np.random.choice(data, size=k, replace=False)

    while True:
        # ステップ2: 最も近い点が同じデータでグループ化
        groups = [[] for _ in range(k)]
        for point in data:
            distances = [np.linalg.norm(point - centroid) for centroid in centroids]
            closest_centroid_index = np.argmin(distances)
            groups[closest_centroid_index].append(point)

        # ステップ3: グループごとの平均を求めてそれを新たな点とする
        new_centroids = [np.mean(group, axis=0) for group in groups]

        # ステップ5: 新しい中心点が以前の中心点と同じであれば終了
        if np.array_equal(centroids, new_centroids):
            break

        centroids = new_centroids

    # ステップ6: クラスタリングした結果を出力
    clusters = []
    for i, group in enumerate(groups):
        centroid_time = convert_seconds_to_hms(centroids[i])
        cluster_points = [convert_seconds_to_hms(point) for point in group]

        clusters.append({
            "centroid": centroid_time,
            "points": cluster_points
        })

    return clusters

# 入力データのパース
time_data = ["10:52:13", "16:53:21", "7:11:54", "16:15:06", "10:41:12", "11:17:41",
            "15:09:04", "20:24:24", "19:40:37", "2:52:34", "17:22:43", "12:06:51",
            "9:21:12", "12:19:20", "12:15:01", "16:18:51", "8:59:50", "11:31:42",
            "12:11:35"]

# 時間データを秒単位に変換
data_seconds = [sum(x * int(t) for x, t in zip([3600, 60, 1], point.split(":"))) for point in time_data]

# クラスタリングの実行
k = 3  # クラスタの数
result = k_means_clustering(np.array(data_seconds), k)

# 結果の出力
for i, cluster in enumerate(result):
    centroid_time = cluster["centroid"]
    cluster_points = cluster["points"]

    print(f"Cluster {i + 1}: Centroid = {centroid_time}, Points = {cluster_points}")
実行、そして問題発生
できたので実際に動かしてみます。

ちゃんとクラスタリングできているのがわかりますね。
しかし、このプログラムを何度も実行すると...
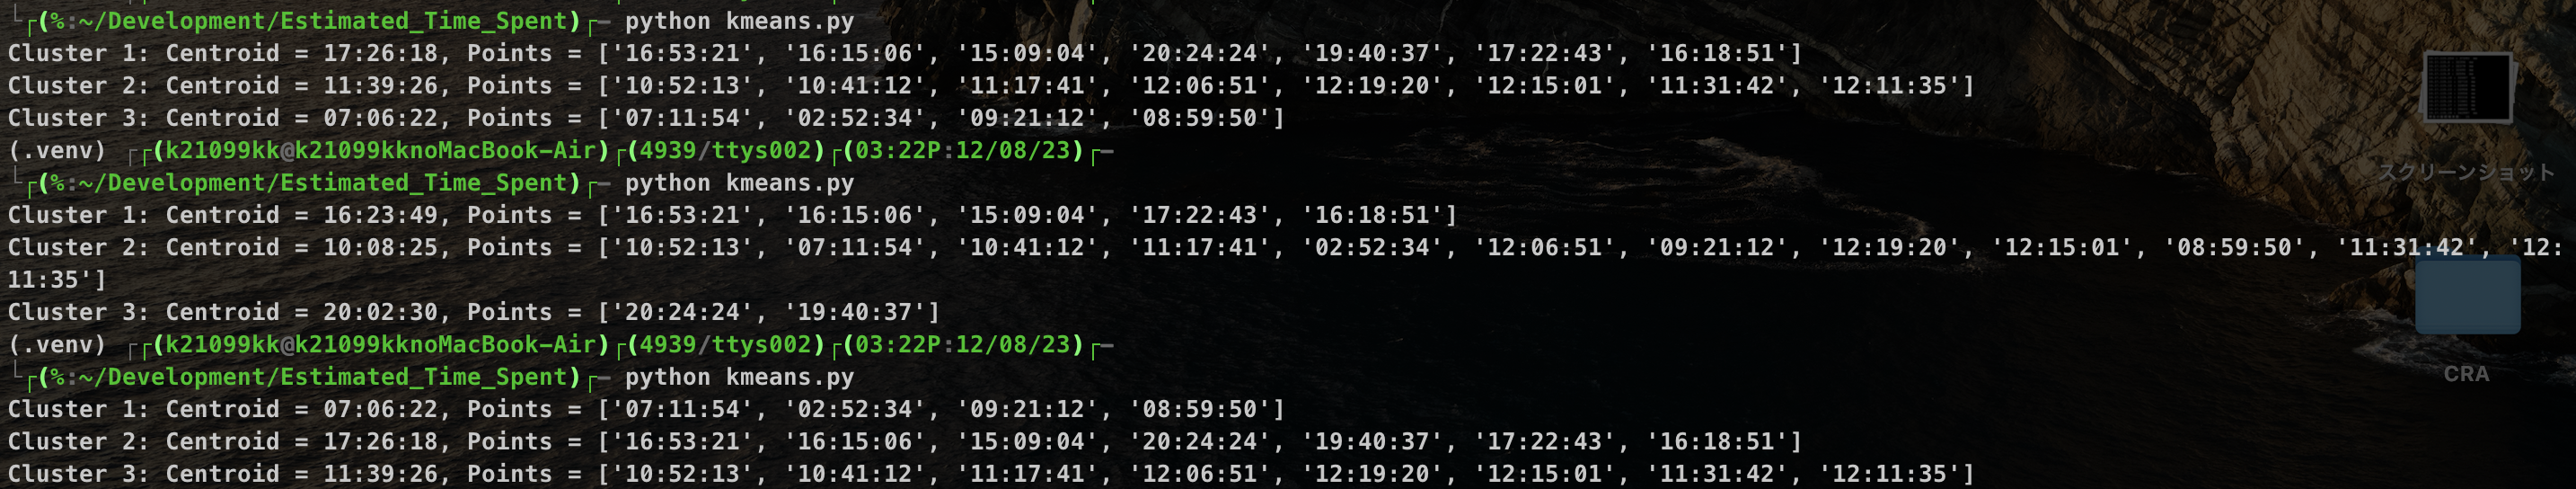
詳しいことは今回の趣旨と外れてしまうので割愛しますが、最初に3つの点をランダムに取っていることが原因です。なので、今回は3つ点の初期値を6:00、12:00、18:00にしちゃいます。
初期値の設定
修正点は次の3点です
def k_means_clustering(data, k):
#  ↓
def k_means_clustering(data, k, centroids):
centroids = np.random.choice(data, size=k, replace=False)の削除
# クラスタリングの実行
k = 3  # クラスタの数
result = k_means_clustering(np.array(data_seconds), k)
#      ↓
# クラスタリングの実行
k = 3  # クラスタの数
# 初期値を設定
initial_centroids = ["6:00", "12:00", "18:00"]
# 初期値を秒単位に変換
centroids = np.array([sum(x * int(t) for x, t in zip([3600, 60], point.split(":"))) for point in initial_centroids])
result = k_means_clustering(data_seconds, k, centroids)
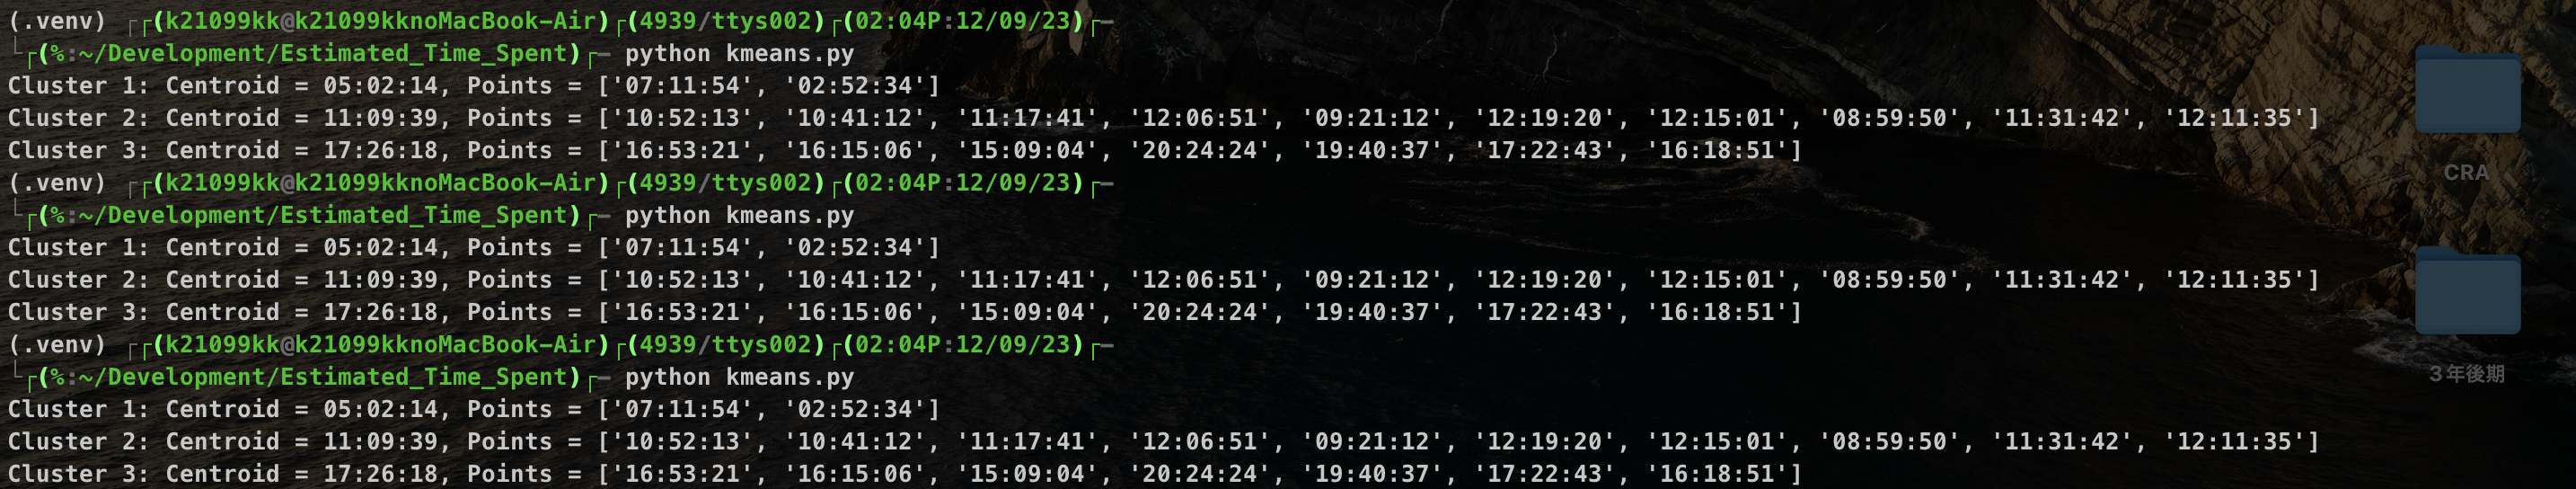
これで何度実行しても同じ結果を得られるようになりました。
グラフ表示
ここまででデータのクラスタリングは完了です。
最後にこれらのデータを視覚的にわかりやすくするためにグラフとして表示させます。
こちらのmake_graph関数をkmeans.pyに追記します。
import matplotlib.pyplot as plt
import japanize_matplotlib
from datetime import datetime
import matplotlib.dates as mdates

def make_graph(clusters):
    # データを日時オブジェクトに変換
    data = [datetime.strptime(time, "%H:%M:%S.%f") if '.' in time else datetime.strptime(time, "%H:%M:%S") for time in time_data]

    # クラスタのデータを日時オブジェクトに変換(ミリ秒を含む)
    cluster_data = {cluster['centroid']: [datetime.strptime(time, "%H:%M:%S.%f") if '.' in time else datetime.strptime(time, "%H:%M:%S") for time in cluster['points']] for cluster in clusters}

    # グラフの作成
    fig, ax = plt.subplots(figsize=(12, 6))
    for cluster, times in cluster_data.items():
        ax.scatter(times, [1] * len(times), label=f"Cluster {list(cluster_data.keys()).index(cluster) + 1}")

    # クラスタのセントロイドをプロット
    for cluster in clusters:
        centroid_time = datetime.strptime(cluster['centroid'], "%H:%M:%S")
        ax.scatter(centroid_time, 1, c='black', marker='x', s=100, label=f"Centroid {clusters.index(cluster) + 1} ")

    # グラフの設定
    ax.yaxis.set_visible(False)  # y軸を非表示にする
    ax.xaxis.set_major_formatter(mdates.DateFormatter('%H:%M'))
    # x軸のフォーマットを設定
    plt.xlabel('時間')
    plt.title('入室した時間')
    plt.legend()

    # グラフを表示
    plt.show()
プログラムの最後に
make_graph(result)
と呼び出すことでグラフを表示させることができます。
実行
それでは実行しましょう。
表示されるグラフは画像のようになります。

きちんと3つのグループにクラスタリングされているのがわかりますね。
まとめ
これにて1次元k-means法の実装と結果の表示は完了になります。
ランダムな点を取得したときに結果が一意にならなかったのが心残りではありますが、まずまずの結果は得られたのではないかなと思います。
それでは、ありがとうございました!