はじめに
累積分布(Cumulative Distribution)を求める必要があったので作成.
matplotlib.pyplotを使って直接グラフを出力するのではなくテキスト形式に保存.
実行に必要なもの
- Python 3.6.x (3.5以下でも動作するか未確認)
- Click
ソースコード
cdf.py
import subprocess as sp
import numpy as np
import csv
import click

@click.command()
@click.argument('inputfile')
@click.option('-o', '--outputfile', default='result.csv') #出力ファイル名
@click.option('-b', '--binum', default=10)                #binの数
@click.option('-c', '--command')                          #追加コマンド
def main(inputfile, outputfile, binum, command):
    with open(inputfile, 'r') as csvfile:
        data = np.array([float(l.strip()) for l in csvfile])
        hist = np.histogram(data, bins=binum)
        hist = [{'x':x, 'y':y} for x, y in zip(hist[1], [a/len(data) for a in np.cumsum(hist[0])])]

        with open(outputfile, 'w') as output:
            writer = csv.DictWriter(output, fieldnames=['x','y'])
            writer.writeheader()
            [writer.writerow(row) for row in hist]

        if command:
            sp.call(f'{command} {outputfile}', shell=True)

if __name__ == '__main__':
    main()
使い方
ヘルプ
$ python cdf.py --help
Usage: cdf.py [OPTIONS] INPUTFILE

Options:
  -o, --outputfile TEXT
  -b, --binum INTEGER
  -c, --command TEXT
  --help                 Show this message and exit.
オプションを使わない場合,瓶の数は10,出力ファイル名はresult.csvとなります.
例として,平均0,分散1の正規分布に従う乱数を10000個生成しnd.csvに出力するnd.pyを作成します1.
nd.py
import subprocess as sp
import random

for _ in range(10000):
    sp.call(f'echo {random.normalvariate(0,1)} >> nd.csv', shell=True)
基本動作
入力ファイルnd.csvを指定してCDFを導出し,catで結果を表示を表示してみます.
cdf.pyの動作
$ python cdf.py nd.csv
$ cat result.csv
x,y
-3.8091214342198714,0.0013
-3.0808555313436097,0.0099
-2.3525896284673484,0.052
-1.6243237255910867,0.1838
-0.8960578227148255,0.4392
-0.16779191983856423,0.7162
0.5604739830376979,0.9021
1.2887398859139592,0.9771
2.0170057887902204,0.9966
2.7452716916664817,1.0
コマンド実行
catなどのコマンドは-c catをつけると一緒に実行してくれます.
cdf.pyの動作
$ python cdf.py nd.csv -c cat
x,y
-3.8091214342198714,0.0013
-3.0808555313436097,0.0099
-2.3525896284673484,0.052
-1.6243237255910867,0.1838
-0.8960578227148255,0.4392
-0.16779191983856423,0.7162
0.5604739830376979,0.9021
1.2887398859139592,0.9771
2.0170057887902204,0.9966
2.7452716916664817,1.0
瓶の個数を変更
オプションを-b 20とすると瓶の個数(細かさ)を指定することができます.
cdf.pyの動作
$ python cdf.py nd.csv -c cat -b 20
x,y
-1.821497471272796,0.05
-1.598424401733297,0.08
-1.3753513321937978,0.11
-1.1522782626542987,0.18
-0.9292051931147995,0.26
-0.7061321235753004,0.37
-0.4830590540358013,0.47
-0.25998598449630217,0.52
-0.036912914956803045,0.57
0.18616015458269586,0.65
0.4092332241221952,0.71
0.6323062936616946,0.74
0.8553793632011935,0.83
1.0784524327406924,0.88
1.3015255022801917,0.93
1.524598571819691,0.95
1.74767164135919,0.98
1.9707447108986889,0.99
2.193817780438188,0.99
2.4168908499776878,1.0
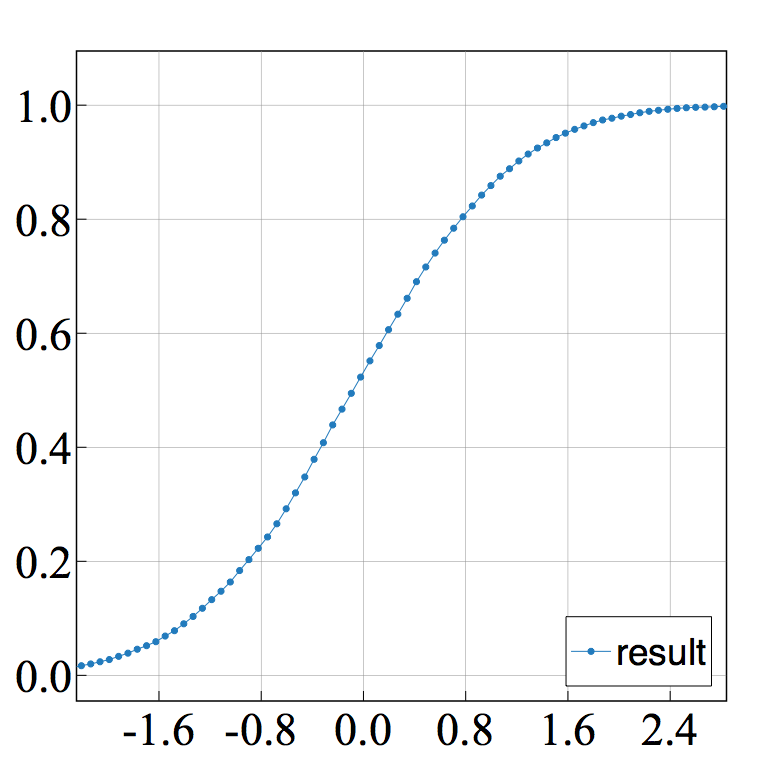
オプションを-b 100 として結果を出力しグラフを作ってみます.
グラフの作成にはSuper Mjograph (http://www.mjograph.net/indexj.html) を用いました.
出力ファイル名変更
オプションを-o result2.csvとし,出力ファイル名を指定することができます.
os.path.exists()などでチェックなどしてないので,すでに指定したファイル名が存在する場合は上書きされるので注意.
cdf.pyの動作
$ python cdf.py nd.csv -o result2.csv
$ cat result2.csv
x,y
-3.8091214342198714,0.0013
-3.0808555313436097,0.0099
-2.3525896284673484,0.052
...
-
本来は
numpyやwith open()などを使うべきです. ↩