はじめに
AutoMLのPyCaretやっていきまーす
開発環境
- Windows 10 PC
- Python 3.8
導入
conda create -n py38 python=3.8
conda activate py38
pip install pycaret[full]
Classification
1.ワインのクオリティデータセットをダウンロード(winequality-white.csv, winequality-red.csv)
2.モデルを作成する
wine_classification_train.py
import pandas as pd
from sklearn.model_selection import train_test_split
from pycaret.classification import *

white_wine = pd.read_csv("./winequality-white.csv", sep=';')
red_wine = pd.read_csv("./winequality-red.csv", sep=';')
white_wine['is_red'] = 0.0
red_wine['is_red'] = 1.0
data_df = pd.concat([white_wine, red_wine], axis=0)
data_labels = data_df['quality'] >= 7
data_df = data_df.drop(['quality'], axis=1)
print(data_df.head())

train, test = train_test_split(data_df)
s = setup(train, target='is_red')
best = compare_models()
evaluate_model(best)
predictions = predict_model(best, data=test)
save_model(best, 'wine_classification')
3.モデル(wine_classification.pkl)が保存される
4.保存したモデルを読み込み推論する
wine_classification_prediction.py
import pandas as pd
from sklearn.model_selection import train_test_split
from pycaret.classification import *

white_wine = pd.read_csv("./winequality-white.csv", sep=';')
red_wine = pd.read_csv("./winequality-red.csv", sep=';')
white_wine['is_red'] = 0.0
red_wine['is_red'] = 1.0
data_df = pd.concat([white_wine, red_wine], axis=0)
data_labels = data_df['quality'] >= 7
data_df = data_df.drop(['quality'], axis=1)

train, test = train_test_split(data_df)
saved_model = load_model('wine_classification')
new_prediction = predict_model(saved_model, data=test)
print(new_prediction.head())
Regression
1.ダイアモンドのデータセットを用いて学習する
diamond_regression_train.py
import pandas as pd
from sklearn.model_selection import train_test_split
from pycaret.regression import *
from pycaret.datasets import get_data

data_df = get_data('diamond')
train, test = train_test_split(data_df)
s = setup(train, target = 'Price')
best = compare_models()
evaluate_model(best)
predictions = predict_model(best, data=test)
save_model(best, 'diamond_regression')
2.学習したモデルを読み込み推論する
diamond_regression_prediction.py
import pandas as pd
from sklearn.model_selection import train_test_split
from pycaret.regression import *
from pycaret.datasets import get_data

data_df = get_data('diamond')
train, test = train_test_split(data_df)
saved_model = load_model('diamond_regression')
new_prediction = predict_model(saved_model, data=test)
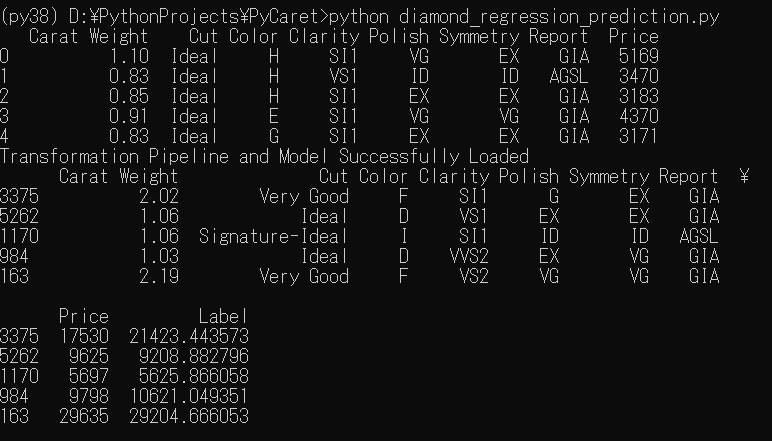
print(new_prediction.head())
Clustering
保留
Anomaly Detection
保留
Time Series Forecasting App with PyCaret and Streamlit
EDA with PyCaret
1.pycaretのインストール
pip install pycaret[full]
もしくは
pip install pycaret
pip install autoviz
2.jupyter notebook上でやる
jupyter notebook
3.irisデータセットの読み込み
from pycaret.datasets import get_data
data = get_data('iris')
4.セットアップ
from pycaret.classification import *
s = setup(data, target = 'species', session_id = 123)
5.EDA
eda()
Alert! from version 0.1.39, fter importing, you must do '%matplotlib inline' to display charts in Jupyter Notebooks.
    AV = AutoViz_Class()
    dfte = AV.AutoViz(filename, sep=',', depVar='', dfte=None, header=0, verbose=0, lowess=False,
               chart_format='svg',max_rows_analyzed=150000,max_cols_analyzed=30, save_plot_dir=None)
Note: verbose=0 or 1 generates charts and displays them in your local Jupyter notebook.
      verbose=2 does not display plots but saves them in AutoViz_Plots folder in local machine.
Updated: chart_format='bokeh' generates and displays charts in your local Jupyter notebook.
      chart_format='server' generates and displays charts in the browser - one tab for each chart.
      chart_format='html' silently saves charts HTML format - they are also interactive!

Shape of your Data Set loaded: (150, 5)
#######################################################################################
######################## C L A S S I F Y I N G  V A R I A B L E S  ####################
#######################################################################################
Classifying variables in data set...
    4 Predictors classified...
        No variables removed since no ID or low-information variables found in data set

################ Multi_Classification problem #####################
 |
 |
 |
 |
 |
 |
 |
 |
 |
Databricksではsetupのところを下記にする必要がある
s = setup(data, target = 'species', session_id = 123, silent = True, html = False)
DatabricksだとEDAの表示はできなさそう、だれかできる人いたら教えてください。

参考文献
Tutorials
Examples
Videos
Cheat sheet


