はじめに
Distributed Data Systems with Azure Databricksやっていきます
開発環境
Chapter06.ipynb
%fs
ls /databricks-datasets/structured-streaming/events/
path,name,size,modificationTime
dbfs:/databricks-datasets/structured-streaming/events/file-0.json,file-0.json,72530,1469673865000
dbfs:/databricks-datasets/structured-streaming/events/file-1.json,file-1.json,72961,1469673866000
dbfs:/databricks-datasets/structured-streaming/events/file-10.json,file-10.json,73025,1469673878000
...
%fs head /databricks-datasets/structured-streaming/events/file-0.json
[Truncated to first 65536 bytes]
{"time":1469501107,"action":"Open"}
{"time":1469501147,"action":"Open"}
{"time":1469501202,"action":"Open"}
{"time":1469501219,"action":"Open"}
{"time":1469501225,"action":"Open"}
{"time":1469501234,"action":"Open"}
{"time":1469501245,"action":"Open"}
{"time":1469501246,"action":"Open"}
{"time":1469501248,"action":"Open"}
{"time":1469501256,"action":"Open"}
...
from pyspark.sql.types import *
input_path = "/databricks-datasets/structured-streaming/events/"
json_schema = StructType([StructField("time", TimestampType(), True),
                          StructField("action", StringType(), True)])
static_df = (
  spark
  .read
  .schema(json_schema)
  .json(input_path)
)
display(static_df)
time,action
2016-07-28T04:19:28.000+0000,Close
2016-07-28T04:19:28.000+0000,Close
2016-07-28T04:19:29.000+0000,Open
2016-07-28T04:19:31.000+0000,Close
2016-07-28T04:19:31.000+0000,Open
2016-07-28T04:19:31.000+0000,Open
2016-07-28T04:19:32.000+0000,Close
2016-07-28T04:19:33.000+0000,Close
2016-07-28T04:19:35.000+0000,Close
...
from pyspark.sql.functions import *

static_count_df = (
  static_df
  .groupBy(
    static_df.action,
    window(static_df.time, "1 hour"))
  .count()
)

static_count_df.cache()
static_count_df.createOrReplaceTempView("data_counts")
%sql
select action, sum(count) as total_count from data_counts
group by action
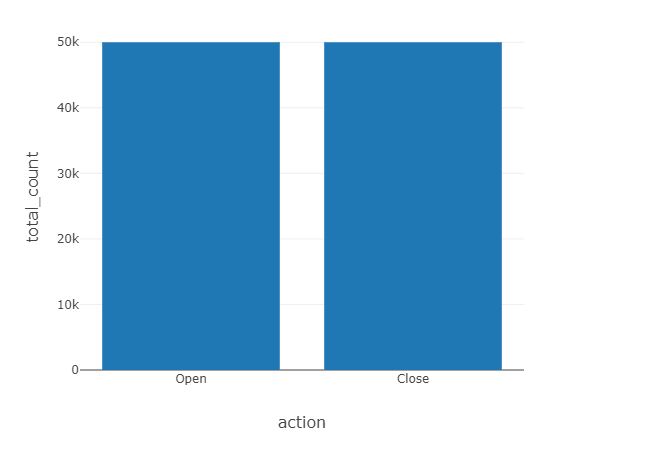
action,total_count
Open,50000
Close,50000
%sql
select action, date_format(window.end, "MMM-dd HH:mm") as time, count from data_counts order by time, action
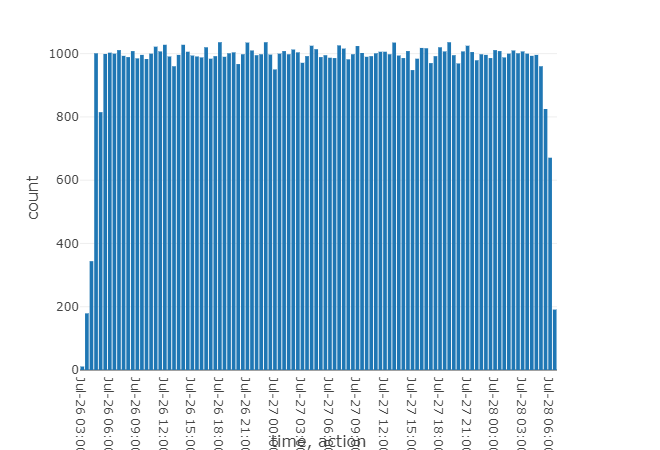
action,time,count
Close,Jul-26 03:00,11
Open,Jul-26 03:00,179
Close,Jul-26 04:00,344
Open,Jul-26 04:00,1001
Close,Jul-26 05:00,815
Open,Jul-26 05:00,999
Close,Jul-26 06:00,1003
Open,Jul-26 06:00,1000
Close,Jul-26 07:00,1011
...
from pyspark.sql.functions import *
streaming_df = (
  spark
  .readStream
  .schema(json_schema)
  .option("maxFilesPerTrigger", 1)
  .json(input_path)
)

spark.conf.set("spark.sql.shuffle.partitions", "2")
streaming_counts_df = (
  streaming_df
  .groupBy(
    streaming_df.action,
    window(streaming_df.time, "1 hour"))
  .count()
)
streaming_df.isStreaming
True
spark.conf.set("spark.sql.shuffle.partitions", "2")
query = streaming_counts_df.writeStream.format("memory").queryName("data_counts").outputMode("complete").start()
Chapter07.ipynb
from pyspark.sql.types import *
data = [(1, 'c1', 'a1'), (2, 'c2', 'a2')]
columns = ['id', 'val1', 'val2']
df = spark.createDataFrame(data, columns)
df.printSchema()
df.show(truncate=False)
root
 |-- id: long (nullable = true)
 |-- val1: string (nullable = true)
 |-- val2: string (nullable = true)

+---+----+----+
|id |val1|val2|
+---+----+----+
|1  |c1  |a1  |
|2  |c2  |a2  |
+---+----+----+
data_new = [(3, 'c2', 'a2'), (4, 'c3', 'a3')]
columns_new = ['id', 'val1', 'val2']
df_new =spark.createDataFrame(
    data_new,
    columns_new
)
df_new.printSchema()
df_new.show(truncate=False)
root
 |-- id: long (nullable = true)
 |-- val1: string (nullable = true)
 |-- val2: string (nullable = true)

+---+----+----+
|id |val1|val2|
+---+----+----+
|3  |c2  |a2  |
|4  |c3  |a3  |
+---+----+----+
union_df = df.union(df_new)
union_df.show(truncate=False)
+---+----+----+
|id |val1|val2|
+---+----+----+
|1  |c1  |a1  |
|2  |c2  |a2  |
|3  |c2  |a2  |
|4  |c3  |a3  |
+---+----+----+
union_df.select("val1").show()
+----+
|val1|
+----+
|  c1|
|  c2|
|  c2|
|  c3|
+----+
union_df.select("id", "val1").show()
+---+----+
| id|val1|
+---+----+
|  1|  c1|
|  2|  c2|
|  3|  c2|
|  4|  c3|
+---+----+
nested_df = union_df
union_df.filter(union_df.val1 == "c2").show(truncate=False)
+---+----+----+
|id |val1|val2|
+---+----+----+
|2  |c2  |a2  |
|3  |c2  |a2  |
+---+----+----+
from pyspark.sql.functions import col, asc
filter_df = union_df.filter((col("id") == "3") | (col("val1") == "c2")).sort(asc("id"))
display(filter_df)
id,val1,val2
3,c2,a2
dbutils.fs.rm("/tmp/filter_results.parquet", True)
filter_df.write.parquet("/tmp/filter_results.parquet")
dbutils.fs.rm("/tmp/filter_results.parquet", True)
filter_df.write.partitionBy("id", "val1").parquet("/tmp/filter_results.parquet")
non_nun_union = union_df.fillna("-")
non_nun_union = non_nun_union.withColumn("id",col("id").cast("Integer"))
from pyspark.sql.functions import countDistinct
count_distinct_df = non_nun_union.select("id", "val1").groupBy("id").agg(countDistinct ("val1").alias("distinct_val1"))
display(count_distinct_df)
id,distinct_val1
1,1
3,1
4,1
2,1
count_distinct_df.describe().show()
+-------+------------------+-------------+
|summary|                id|distinct_val1|
+-------+------------------+-------------+
|  count|                 4|            4|
|   mean|               2.5|          1.0|
| stddev|1.2909944487358056|          0.0|
|    min|                 1|            1|
|    max|                 4|            1|
+-------+------------------+-------------+
count_distinct_df.createOrReplaceTempView("count_distinct")
select_sql = spark.sql('''
  SELECT * FROM count_distinct
''')
count_distinct_df = table("count_distinct")
count_distinct_df.cache()
Out[28]: DataFrame[id: int, distinct_val1: bigint]
sqlContext.clearCache()
sqlContext.cacheTable("count_distinct")
sqlContext.uncacheTable("count_distinct")
import numpy as np
# import pandas as pd
import pyspark.pandas as ps
import databricks.koalas as ks
pandas_series = pd.Series([1, 10, 5, np.nan, 10, 2])
koala_series = ks.Series([1, 10, 5, np.nan, 10, 2])
koala_series = ks.Series(pandas_series)
koala_series = ks.from_pandas(pandas_series)
koala_series.sort_index()
Out[36]: 0     1.0
1    10.0
2     5.0
3     NaN
4    10.0
5     2.0
dtype: float64
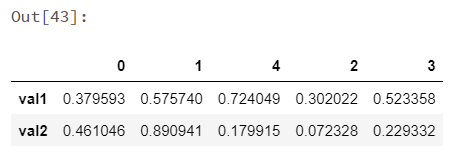
pandas_df = pd.DataFrame({'val1': np.random.rand(5), 'val2': np.random.rand(5)})
koalas_df = ks.DataFrame({'val1': np.random.rand(5), 'val2': np.random.rand(5)})
koalas_df = ks.DataFrame(pandas_df)
koalas_df = ks.from_pandas(pandas_df)
koalas_df.head(10)
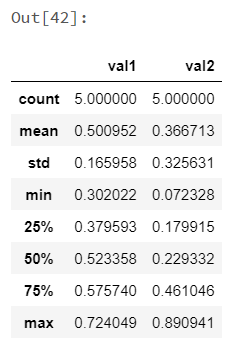
koalas_df.describe()
koalas_df.transpose()
from databricks.koalas.config import set_option, get_option
ks.get_option('compute.max_rows')
ks.set_option('compute.max_rows', 2000)
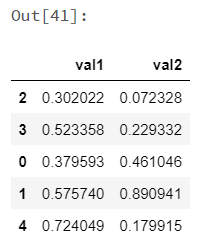
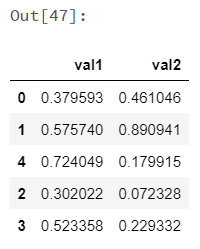
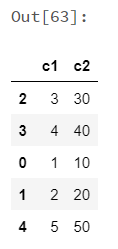
koalas_df['val1']
Out[45]: 2    0.302022
3    0.523358
0    0.379593
1    0.575740
4    0.724049
Name: val1, dtype: float64
koalas_df.val1
Out[46]: 2    0.302022
3    0.523358
0    0.379593
1    0.575740
4    0.724049
Name: val1, dtype: float64
koalas_df[['val1', 'val2']]
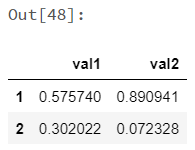
koalas_df.loc[1:2]
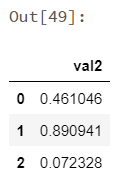
koalas_df.iloc[:3, 1:2]
ks.set_option('compute.ops_on_diff_frames', True)
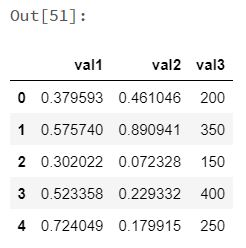
koalas_series = ks.Series([200, 350, 150, 400, 250], index=[0, 1, 2, 3, 4])
koalas_df['val3'] = koalas_series
koalas_df.head(10)
ks.reset_option("compute.ops_on_diff_frames")
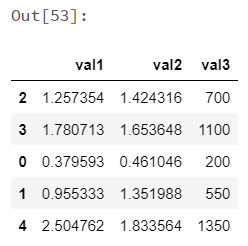
koalas_df.apply(np.cumsum)
koalas_df.apply(np.cumsum, axis=1)
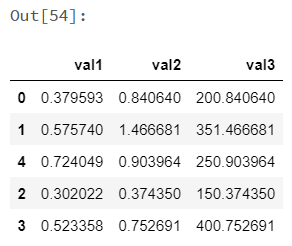
def square_root(x) -> ks.Series[np.float64]:
  return x ** .5
koalas_df.apply(square_root)
ks.set_option('compute.shortcut_limit', 5000)
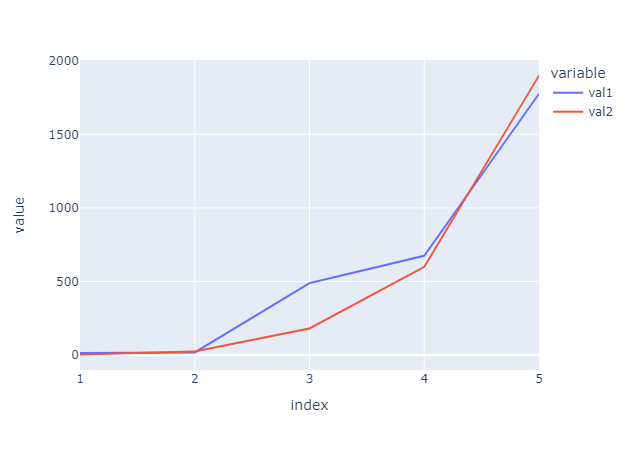
koalas_df = ks.DataFrame({'val1': [15, 18, 489, 675, 1776], 'val2': [4, 25, 181, 600, 1900]}, index=[1, 2, 3, 4, 5])
koalas_df.plot.line()
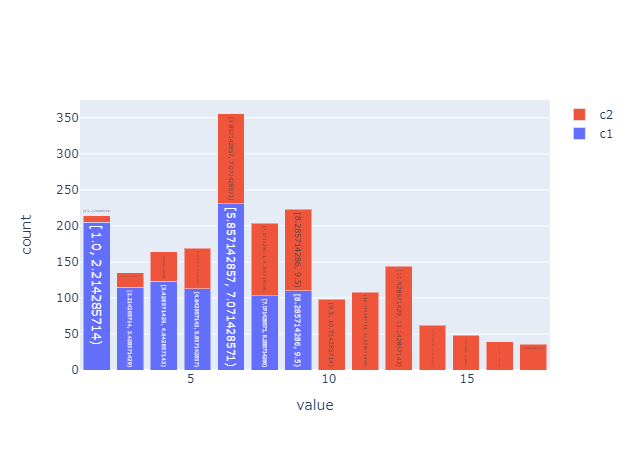
koalas_df = pd.DataFrame(np.random.randint(1, 10, 1000), columns=['c1'])
koalas_df ['c2'] = koalas_df ['c1'] + np.random.randint(1, 10, 1000)
koalas_df = ks.from_pandas(koalas_df)
koalas_df.plot.hist(bins=14, alpha=0.5)
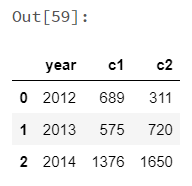
koalas_df = ks.DataFrame({'year': [2010, 2011, 2012, 2013, 2014],
                          'c1': [15, 24, 689, 575, 1376],
                          'c2': [4, 27, 311, 720, 1650]})
ks.sql("SELECT * FROM {koalas_df} WHERE c1 > 100")
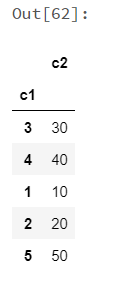
koalas_df = ks.DataFrame({'c1': [1, 2, 3, 4, 5], 'c2': [10, 20, 30, 40, 50]})
spark_df = koalas_df.to_spark()
type(spark_df)
spark_df.show()
+---+---+
| c1| c2|
+---+---+
|  1| 10|
|  2| 20|
|  3| 30|
|  4| 40|
|  5| 50|
+---+---+
from databricks.koalas import option_context
with option_context("compute.default_index_type", "distributed-sequence"):
  koalas_df = spark_df.to_koalas()
spark_df.to_koalas(index_col='c1')
koalas_df.cache()
/databricks/python/lib/python3.8/site-packages/databricks/koalas/frame.py:4600: FutureWarning:

DataFrame.cache is deprecated as of DataFrame.spark.cache. Please use the API instead.
%pip install bokeh
from bokeh.plotting import figure
from bokeh.embed import components, file_html
from bokeh.resources import CDN
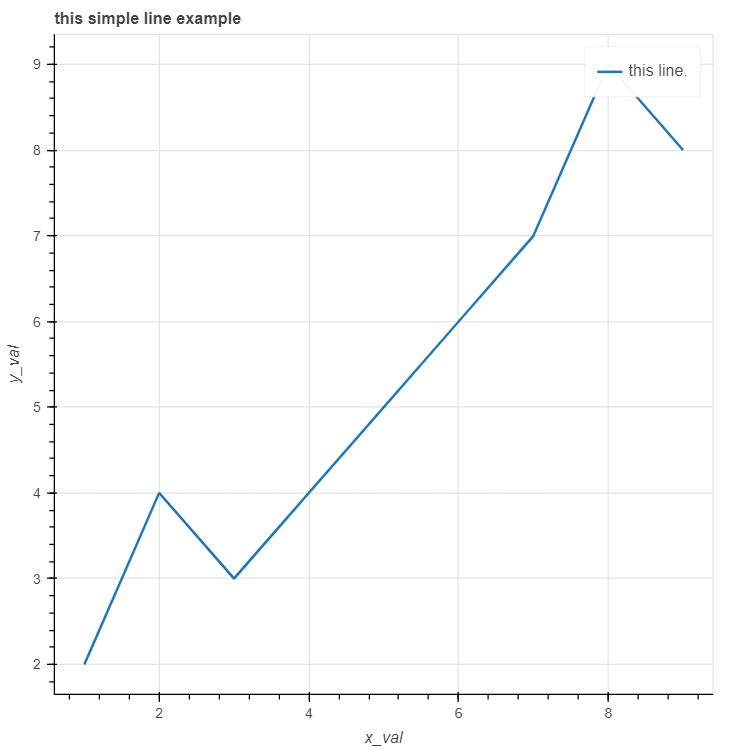
x = [1, 2, 3, 4, 5, 6, 7, 8, 9]
y = [2, 4, 3, 4, 5, 6, 7, 9, 8]
p = figure(title="this simple line example", x_axis_label='x_val', y_axis_label='y_val')
p.line(x, y, legend_label="this line.", line_width=2)
Out[4]:
GlyphRenderer(id = '1039', ‹‹‹
              coordinates = None,
              data_source = ColumnDataSource(id='1035', ...),
              glyph = Line(id='1036', ...),
              group = None,
              hover_glyph = None,
              js_event_callbacks = {},
              js_property_callbacks = {},
              level = 'glyph',
              muted = False,
              muted_glyph = Line(id='1038', ...),
              name = None,
              nonselection_glyph = Line(id='1037', ...),
              selection_glyph = 'auto',
              subscribed_events = [],
              syncable = True,
              tags = [],
              view = CDSView(id='1040', ...),
              visible = True,
              x_range_name = 'default',
              y_range_name = 'default')
html = file_html(p, CDN, "my_plot")
displayHTML(html)
import numpy as np
import matplotlib.pyplot as plt
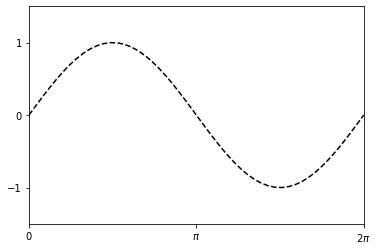
x = np.linspace(0, 2*np.pi, 50)
y = np.sin(x)

fig, ax = plt.subplots()
ax.plot(x, y, 'k--')

ax.set_xlim((0, 2*np.pi))
ax.set_xticks([0, np.pi, 2*np.pi])
ax.set_xticklabels(['0', '$\pi$','2$\pi$'])
ax.set_ylim((-1.5, 1.5))
ax.set_yticks([-1, 0, 1])

display(fig)
from plotly.offline import plot
from plotly.graph_objs import *
import numpy as np

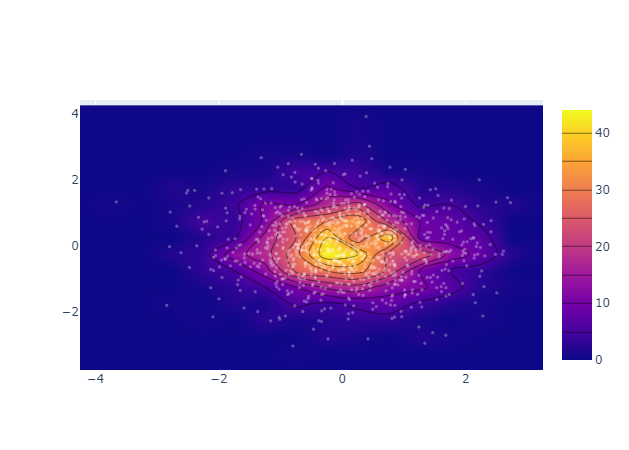
x = np.random.randn(1000)
y = np.random.randn(1000)

p = plot(
  [Histogram2dContour(x=x, y=y, contours=Contours(coloring='heatmap')),
   Scatter(x=x, y=y, mode='markers', marker=Marker(color='white', size=3, opacity=0.3))
  ],
  output_type='div'
)

displayHTML(p)
/databricks/python/lib/python3.8/site-packages/plotly/graph_objs/_deprecations.py:204: DeprecationWarning:

plotly.graph_objs.Contours is deprecated.
Please replace it with one of the following more specific types
  - plotly.graph_objs.contour.Contours
  - plotly.graph_objs.surface.Contours
  - etc.


/databricks/python/lib/python3.8/site-packages/plotly/graph_objs/_deprecations.py:434: DeprecationWarning:

plotly.graph_objs.Marker is deprecated.
Please replace it with one of the following more specific types
  - plotly.graph_objs.scatter.Marker
  - plotly.graph_objs.histogram.selected.Marker
  - etc.
