ポアソン回帰
ポアソン回帰は次のように、x軸の値に応じて誤差分布のパラメータが変化するデータをモデル化する際に使います。
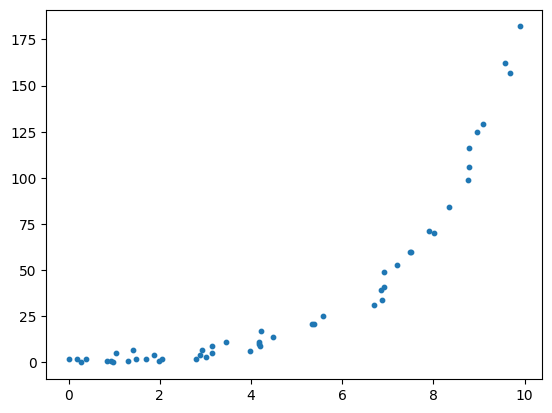
このデータの生成プログラム
import numpy as np
import pandas as pd
import matplotlib.pyplot as plt
from scipy import stats
sample
# 真のパラメータ
true_w0 = 0.3
true_w1 = 0.5

# 人工データ(観測データ)
#乱数生成の初期化をしてからxに代入
rng = np.random.RandomState(1)
x = 10 * rng.rand(50)
#計算した平均値μを持つポアソン分布から乱数を生成し、目的変数yに代入
y = stats.poisson(mu = np.exp(true_w0 + true_w1 * x)).rvs()

plt.scatter(x, y, s=10)
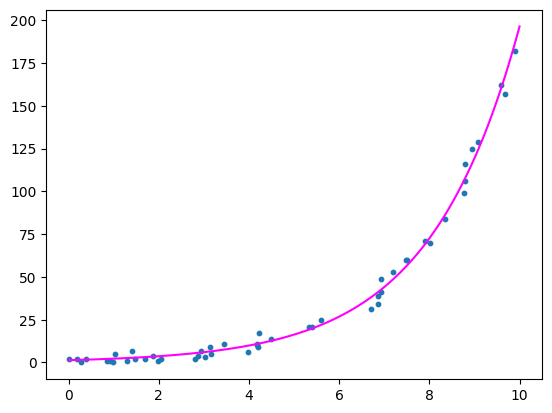
回帰
リンク関数を対数関数(y=log(x))(つまり,逆リンク関数を指数関数(y=exp(x)))に設定した場合のポアソン回帰モデルを作ります。
sample.py
# scikit-learnのTweedieRegressorクラスからインスタンスを呼び出す
model = TweedieRegressor(fit_intercept=True, power=1, link='log')

# 過去のデータを最もよく説明する最適なパラメータを探索
# y = w0 + w1x  の w0~w1 を算出
model.fit(x[:, np.newaxis], y)

# モデルが推定したパラメータ値を確認
# 切片(バイアス) w0
print(model.intercept_)
# 係数パラメータ w1
print(model.coef_)

# 最適なパラメータを使って出力の予測値を生成
xfit = np.linspace(0, 10, 1000)
yfit = model.predict(xfit[:, np.newaxis])

plt.scatter(x, y, s=10)
plt.plot(xfit, yfit, color='magenta')
結果
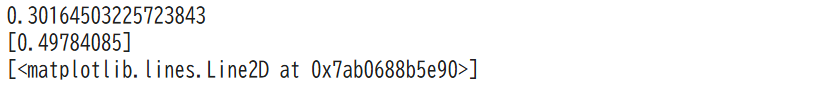
真のパラメータに近い値を出せています。
ここまで読んでくださりありがとうございました!