はじめに
Aさんが、5つの能力を可視化したいと考えました。
5つの能力は、下記の値です。
specs1 = [1, 2, 3, 4, 5]
レーダーチャートの表示
Matplotlibでレーダーチャートを表示してみましょう。
from itertools import pairwise
import numpy as np
from matplotlib import pyplot as plt

def area(angles, values):
    px = np.sin(angles) * values
    py = np.cos(angles) * values
    return abs(sum(
        p2[0] * p1[1] - p2[1] * p1[0]
        for p1, p2 in pairwise(zip(px, py))
    )) / 2

def rader_chart(specs):
    angles = np.linspace(np.pi * 0.5, np.pi * -1.5, len(specs1) + 1)
    values = specs + [specs[0]]
    _, ax = plt.subplots(figsize=(3, 3), subplot_kw={'projection': 'polar'})
    ax.plot(angles, values, 'o-')
    ax.fill(angles, values, alpha=0.4)
    ax.set_title(f"area = {area(angles, values):.2f}")
    ax.set_rlim(0, 8)

rader_chart(specs1)
タイトルは面積です。
さて、レーダーチャートは、順番によって面積が変わります。
Aさんは、順番を変えて面積を最大にしたいと思いました。
PyVRPで面積の最大化
隣同士で面積が決まりますので、TSPを解いて面積を最大化できます。
PyVRPでTSPを解いてみましょう。
from itertools import permutations
from pyvrp import Model
from pyvrp.stop import MaxIterations

m = Model()
m.add_depot(0, 0)
for _ in specs1[1:]:
    m.add_client(0, 0)
coe = np.sin(72 / 180 * np.pi) / 2
for frm, to in permutations(zip(specs1, m.locations), 2):
    area1 = round(coe * frm[0] * to[0] * 1000)
    m.add_edge(frm[1], to[1], 100_000 - area1)
m.add_vehicle_type(1)

result = m.solve(MaxIterations(100), display=False)
routes = [0] + result.best.routes()[0].visits()
print(routes)
>>>
[0, 1, 3, 4, 2]
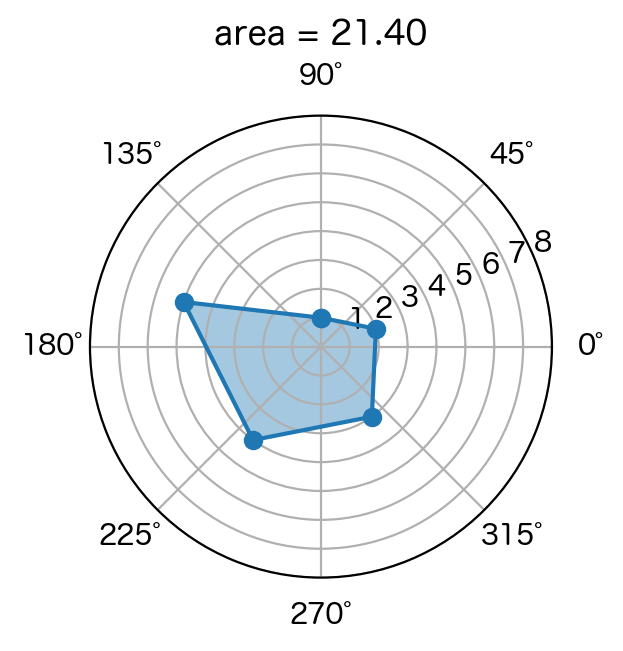
面積が最大になる順番が求まりました。
レーダーチャートにしてみましょう。
rader_chart([specs1[i] for i in routes])

ちょっと広くなりました。
ライバルのレーダーチャート
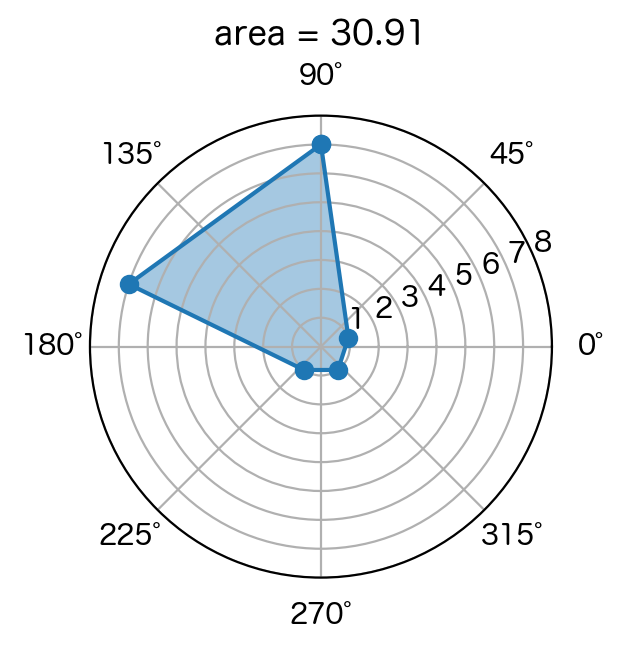
Aさんには、Bさんというライバルがあります。
Bさんのレーダーチャート
specs2 = [7, 1, 7, 1, 1]
rader_chart(specs2)

Bさんの合計能力は、Aさんより少し良いですが、面積は狭いです。
2人の表示順が違うと不自然です。揃えてみましょう。
rader_chart([specs2[i] for i in routes])
順番を変えたらAさんが負けてしまいました。
差を最大化しよう
Aさんの面積からBさんの面積を引いたものを最大化してみましょう。
m = Model()
m.add_depot(0, 0)
for _ in specs1[1:]:
    m.add_client(0, 0)
coe = np.sin(72 / 180 * np.pi) / 2
for frm, to in permutations(zip(specs1, specs2, m.locations), 2):
    area1 = round(coe * frm[0] * to[0] * 1000)
    area2 = round(coe * frm[1] * to[1] * 1000)
    m.add_edge(frm[2], to[2], 100_000 - area1 + area2)
m.add_vehicle_type(1)

result = m.solve(MaxIterations(100), display=False)
routes = [0] + result.best.routes()[0].visits()
print(routes)
>>>
[0, 3, 4, 2, 1]
Bさんの面積はそのままで、Aさんの面積が少し広くなりました。
rader_chart([specs1[i] for i in routes])
rader_chart([specs2[i] for i in routes])


さいごに
レーダーチャートは、わかりにくいですね。
能力は、棒グラフで可視化しましょう。
以上