はじめに
Chartの折れ線グラフの目盛りに関して調べたので記事にしておきます。
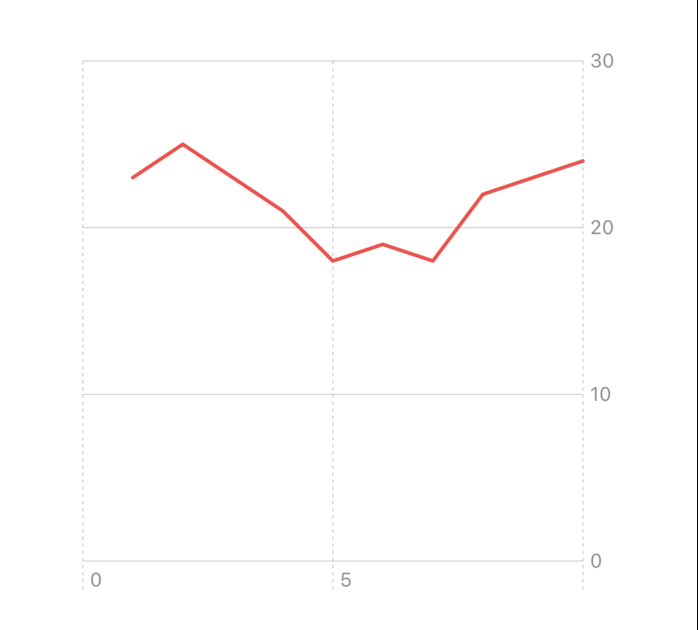
デフォルト実装
本記事で使用する実装です。
この実装をベースに機能を追加していきます。
import SwiftUI
import Charts

struct Temperature {
    let day: Int
    let max: Double
    let min: Double
}

struct ContentView: View {
    @State private var temperatures: [Temperature] = [
        .init(day: 1, max: 23, min: 13),
        .init(day: 2, max: 25, min: 10),
        .init(day: 3, max: 23, min: 11),
        .init(day: 4, max: 21, min: 11),
        .init(day: 5, max: 18, min: 12),
        .init(day: 6, max: 19, min: 13),
        .init(day: 7, max: 18, min: 15),
        .init(day: 8, max: 22, min: 9),
        .init(day: 9, max: 23, min: 10),
        .init(day: 10, max: 24, min: 13),
    ]

    var body: some View {
        Chart {
            ForEach(temperatures, id: \.day) { temperature in
                LineMark(
                    x: .value("day", temperature.day),
                    y: .value("max", temperature.max)
                )
            }
        }
        .frame(width: 300, height: 500)
    }
}
X軸の目盛りの間隔を編集したい
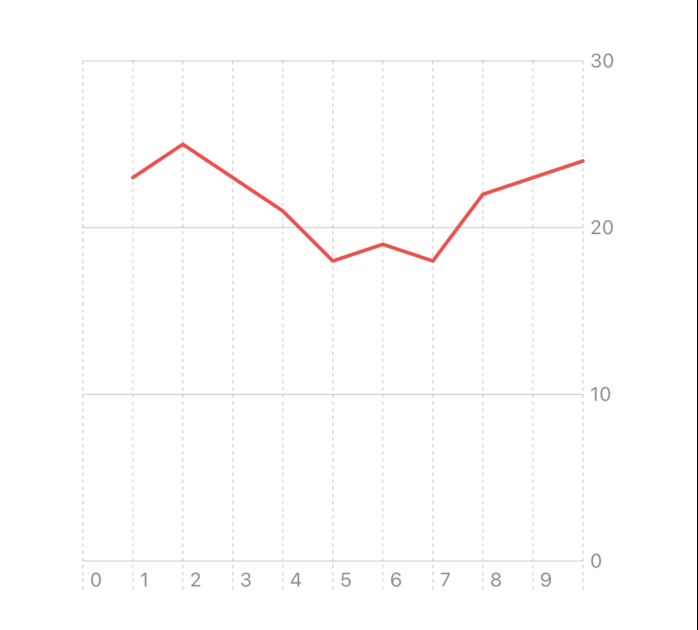
.automatic(minimumStride: 増加数, desiredCount: 目盛りの数)です。
minimumStrideを1、desiredCountを10にすると以下のようになります。
    Chart {
        ForEach(temperatures, id: \.day) { temperature in
            LineMark(
                x: .value("day", temperature.day),
                y: .value("max", temperature.max)
            )
        }
    }
+   .chartXAxis {
+       AxisMarks(values: .automatic(minimumStride: 1, desiredCount: 10))
+   }
    .frame(width: 300, height: 500)
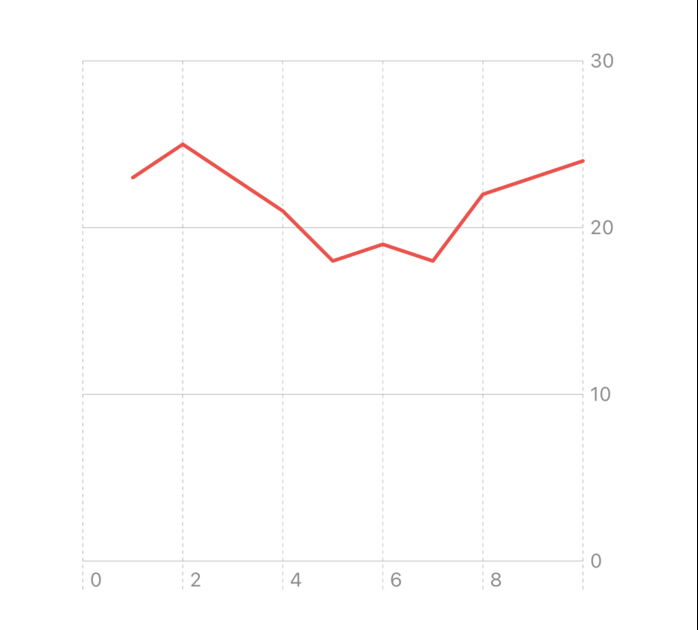
minimumStrideを2にすると目盛りが2ずつ増えていきます。
    Chart {
        ForEach(temperatures, id: \.day) { temperature in
            LineMark(
                x: .value("day", temperature.day),
                y: .value("max", temperature.max)
            )
        }
    }
+   .chartXAxis {
+       AxisMarks(values: .automatic(minimumStride: 2, desiredCount: 10))
+   }
    .frame(width: 300, height: 300)
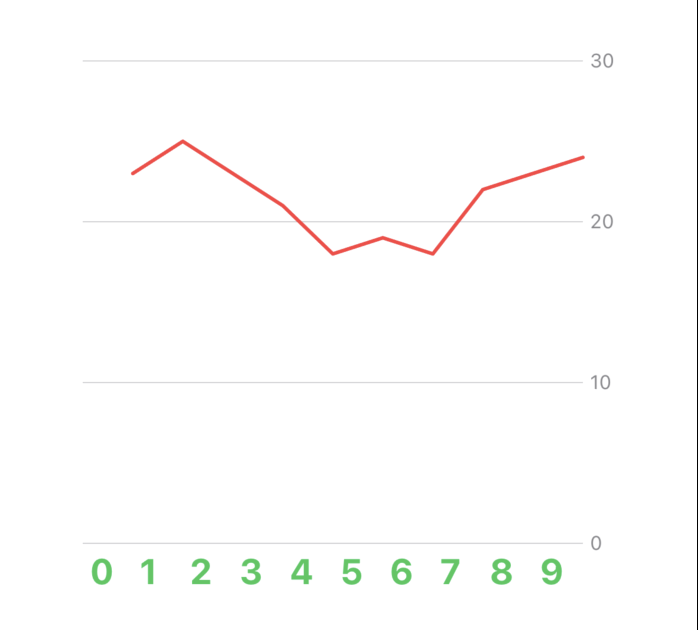
X軸の目盛りのテキストを編集したい
    Chart {
        ForEach(temperatures, id: \.day) { temperature in
            LineMark(
                x: .value("day", temperature.day),
                y: .value("max", temperature.max)
            )
        }
    }
    .chartXAxis {
+       AxisMarks(values: .automatic(minimumStride: 1, desiredCount: 10)) { axisValue in
+           AxisValueLabel {
+               Text(axisValue.index.description)
+                   .font(.system(size: 20, weight: .bold))
+                   .foregroundStyle(.green)
+           }
+       }
    }
    .frame(width: 300, height: 300)
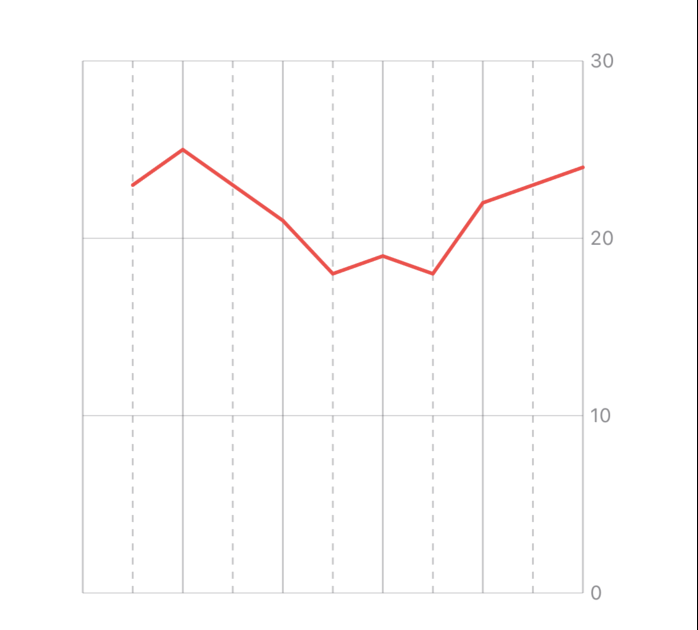
X軸の目盛りを実線と点線で交互に描画したい
    Chart {
        ForEach(temperatures, id: \.day) { temperature in
            LineMark(
                x: .value("day", temperature.day),
                y: .value("max", temperature.max)
            )
        }
    }
+   .chartXAxis {
+       AxisMarks(values: .automatic(minimumStride: 1, desiredCount: 10)) { axisValue in
+           AxisGridLine(stroke: .init(dash: axisValue.index.isMultiple(of: 2) ? [] : [4, 4]))
+       }
+   }
    .frame(width: 300, height: 300)
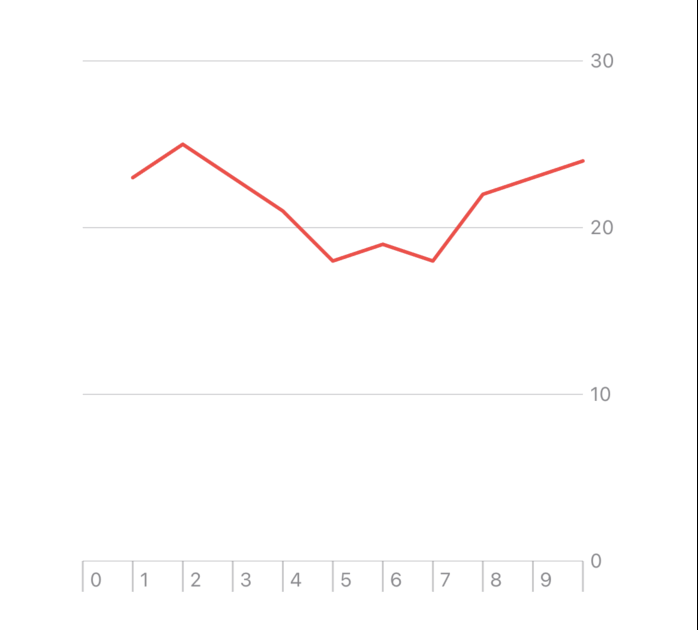
X軸の目盛りと目盛りの間に区切り線を表示したい
    Chart {
        ForEach(temperatures, id: \.day) { temperature in
            LineMark(
                x: .value("day", temperature.day),
                y: .value("max", temperature.max)
            )
        }
    }
+   .chartXAxis {
+       AxisMarks(values: .automatic(minimumStride: 1, desiredCount: 10)) { axisValue in
+           AxisTick(stroke: .init(lineWidth: 1))
+           AxisValueLabel() // 目盛りの値を表示するために必要
+       }
+   }
    .frame(width: 300, height: 300)
おわり
Y軸を編集したい時はchartXAxisをchartYAxisにするだけです。
