はじめに
Qiitaのネタも尽きてきたので新シリーズを開始しようと思います。
題して「UIKitで書かれたライブラリをSwiftUIで使うシリーズ」
本シリーズ最初のライブラリは「Charts」です!
Chartsはグラフの描写ライブラリです
実装
Line Chart

LineChart1.swift
import SwiftUI
import Charts

struct LineChart1: UIViewRepresentable {
    @Environment(\.colorScheme) var colorScheme
    func makeUIView(context: Context) -> LineChartView {
        let chartView = LineChartView()

        chartView.chartDescription?.enabled = false
        chartView.dragEnabled = true
        chartView.setScaleEnabled(true)
        chartView.pinchZoomEnabled = true

        let llXAxis = ChartLimitLine(limit: 10, label: "Index 10")
        llXAxis.lineWidth = 4
        llXAxis.lineDashLengths = [10, 10, 0]
        llXAxis.labelPosition = .bottomRight
        llXAxis.valueFont = .systemFont(ofSize: 10)

        chartView.xAxis.gridLineDashLengths = [10, 10]
        chartView.xAxis.gridLineDashPhase = 0

        let ll1 = ChartLimitLine(limit: 150, label: "Upper Limit")
        ll1.lineWidth = 4
        ll1.lineDashLengths = [5, 5]
        ll1.labelPosition = .topRight
        ll1.valueFont = .systemFont(ofSize: 10)

        let ll2 = ChartLimitLine(limit: -30, label: "Lower Limit")
        ll2.lineWidth = 4
        ll2.lineDashLengths = [5,5]
        ll2.labelPosition = .bottomRight
        ll2.valueFont = .systemFont(ofSize: 10)

        let leftAxis = chartView.leftAxis
        leftAxis.removeAllLimitLines()
        leftAxis.addLimitLine(ll1)
        leftAxis.addLimitLine(ll2)
        leftAxis.axisMaximum = 200
        leftAxis.axisMinimum = -50
        leftAxis.gridLineDashLengths = [5, 5]
        leftAxis.drawLimitLinesBehindDataEnabled = true

        chartView.rightAxis.enabled = false

        chartView.legend.form = .line

        chartView.data = setDataCount(40, range: 100)

        chartView.animate(xAxisDuration: 2.5)

        return chartView
    }
    func updateUIView(_ uiView: LineChartView, context: Context) {
    }
    func setDataCount(_ count: Int, range: UInt32) -> LineChartData {
        let values = (0..<count).map { (i) -> ChartDataEntry in
            let val = Double(arc4random_uniform(range) + 3)
            return ChartDataEntry(x: Double(i), y: val)
        }

        let set1 = LineChartDataSet(entries: values, label: "DataSet 1")
        set1.drawIconsEnabled = false

        setup(set1)

        let gradientColors = [
            ChartColorTemplates.colorFromString("#00ff0000").cgColor,
            ChartColorTemplates.colorFromString("#ffff0000").cgColor
        ]

        let gradient = CGGradient(colorsSpace: nil, colors: gradientColors as CFArray, locations: nil)!

        set1.fillAlpha = 1
        set1.fill = Fill(linearGradient: gradient, angle: 90)

        set1.drawFilledEnabled = true

        let data = LineChartData(dataSet: set1)

        return data
    }
    private func setup(_ dataSet: LineChartDataSet) {
        if dataSet.isDrawFilledEnabled {
            dataSet.lineDashLengths = nil
            dataSet.highlightLineDashLengths = nil
            dataSet.setColors(colorScheme == .dark ? .white : .black, .red, colorScheme == .dark ? .black : .white)
            dataSet.setCircleColor(colorScheme == .dark ? .white : .black)
            dataSet.lineWidth = 1
            dataSet.circleRadius = 3
            dataSet.drawCircleHoleEnabled = false
            dataSet.valueFont = .systemFont(ofSize: 9)
            dataSet.formLineDashLengths = nil
            dataSet.formLineWidth = 1
            dataSet.formSize = 15
        } else {
            dataSet.lineDashLengths = [5, 2.5]
            dataSet.highlightLineDashLengths = [5, 2.5]
            dataSet.setColor(colorScheme == .dark ? .white : .black)
            dataSet.setCircleColor(colorScheme == .dark ? .white : .black)
            dataSet.lineWidth = 1
            dataSet.circleRadius = 3
            dataSet.drawCircleHoleEnabled = false
            dataSet.valueFont = .systemFont(ofSize: 9)
            dataSet.formLineDashLengths = [5, 2.5]
            dataSet.formLineWidth = 1
            dataSet.formSize = 15
        }
    }
}
Line Chart (Dual YAxis)

LineChart2.swift
import SwiftUI
import Charts

struct LineChart2: UIViewRepresentable {
    @Environment(\.colorScheme) var colorScheme
    func makeUIView(context: Context) -> LineChartView {
        let chartView = LineChartView()

        chartView.chartDescription?.enabled = false
        chartView.dragEnabled = true
        chartView.setScaleEnabled(true)
        chartView.pinchZoomEnabled = true

        let l = chartView.legend
        l.form = .line
        l.font = UIFont(name: "HelveticaNeue-Light", size: 11)!
        l.textColor = colorScheme == .dark ? .white : .black
        l.horizontalAlignment = .left
        l.verticalAlignment = .bottom
        l.orientation = .horizontal
        l.drawInside = false

        let xAxis = chartView.xAxis
        xAxis.labelFont = .systemFont(ofSize: 11)
        xAxis.labelTextColor = colorScheme == .dark ? .white : .black
        xAxis.drawAxisLineEnabled = false

        let leftAxis = chartView.leftAxis
        leftAxis.labelTextColor = UIColor(red: 51/255, green: 181/255, blue: 229/255, alpha: 1)
        leftAxis.axisMaximum = 200
        leftAxis.axisMinimum = 0
        leftAxis.drawGridLinesEnabled = true
        leftAxis.granularityEnabled = true

        let rightAxis = chartView.rightAxis
        rightAxis.labelTextColor = .red
        rightAxis.axisMaximum = 900
        rightAxis.axisMinimum = -200
        rightAxis.granularityEnabled = false

        chartView.data = setDataCount(20, range: 30)

        chartView.animate(xAxisDuration: 2.5)

        return chartView
    }
    func updateUIView(_ uiView: LineChartView, context: Context) {
    }

    func setDataCount(_ count: Int, range: UInt32) -> LineChartData {
        let yVals1 = (0..<count).map { (i) -> ChartDataEntry in
            let mult = range / 2
            let val = Double(arc4random_uniform(mult) + 50)
            return ChartDataEntry(x: Double(i), y: val)
        }
        let yVals2 = (0..<count).map { (i) -> ChartDataEntry in
            let val = Double(arc4random_uniform(range) + 450)
            return ChartDataEntry(x: Double(i), y: val)
        }
        let yVals3 = (0..<count).map { (i) -> ChartDataEntry in
            let val = Double(arc4random_uniform(range) + 500)
            return ChartDataEntry(x: Double(i), y: val)
        }

        let set1 = LineChartDataSet(entries: yVals1, label: "DataSet 1")
        set1.axisDependency = .left
        set1.setColor(UIColor(red: 51/255, green: 181/255, blue: 229/255, alpha: 1))
        set1.setCircleColor(colorScheme == .dark ? .white : .black)
        set1.lineWidth = 2
        set1.circleRadius = 3
        set1.fillAlpha = 65/255
        set1.fillColor = UIColor(red: 51/255, green: 181/255, blue: 229/255, alpha: 1)
        set1.highlightColor = UIColor(red: 244/255, green: 117/255, blue: 117/255, alpha: 1)
        set1.drawCircleHoleEnabled = false

        let set2 = LineChartDataSet(entries: yVals2, label: "DataSet 2")
        set2.axisDependency = .right
        set2.setColor(.red)
        set2.setCircleColor(colorScheme == .dark ? .white : .black)
        set2.lineWidth = 2
        set2.circleRadius = 3
        set2.fillAlpha = 65/255
        set2.fillColor = .red
        set2.highlightColor = UIColor(red: 244/255, green: 117/255, blue: 117/255, alpha: 1)
        set2.drawCircleHoleEnabled = false

        let set3 = LineChartDataSet(entries: yVals3, label: "DataSet 3")
        set3.axisDependency = .right
        set3.setColor(.yellow)
        set3.setCircleColor(colorScheme == .dark ? .white : .black)
        set3.lineWidth = 2
        set3.circleRadius = 3
        set3.fillAlpha = 65/255
        set3.fillColor = UIColor.yellow.withAlphaComponent(200/255)
        set3.highlightColor = UIColor(red: 244/255, green: 117/255, blue: 117/255, alpha: 1)
        set3.drawCircleHoleEnabled = false

        let data: LineChartData = LineChartData(dataSets: [set1, set2, set3])
        data.setValueTextColor(colorScheme == .dark ? .white : .black)
        data.setValueFont(.systemFont(ofSize: 9))

        return data
    }
}
Bar Chart
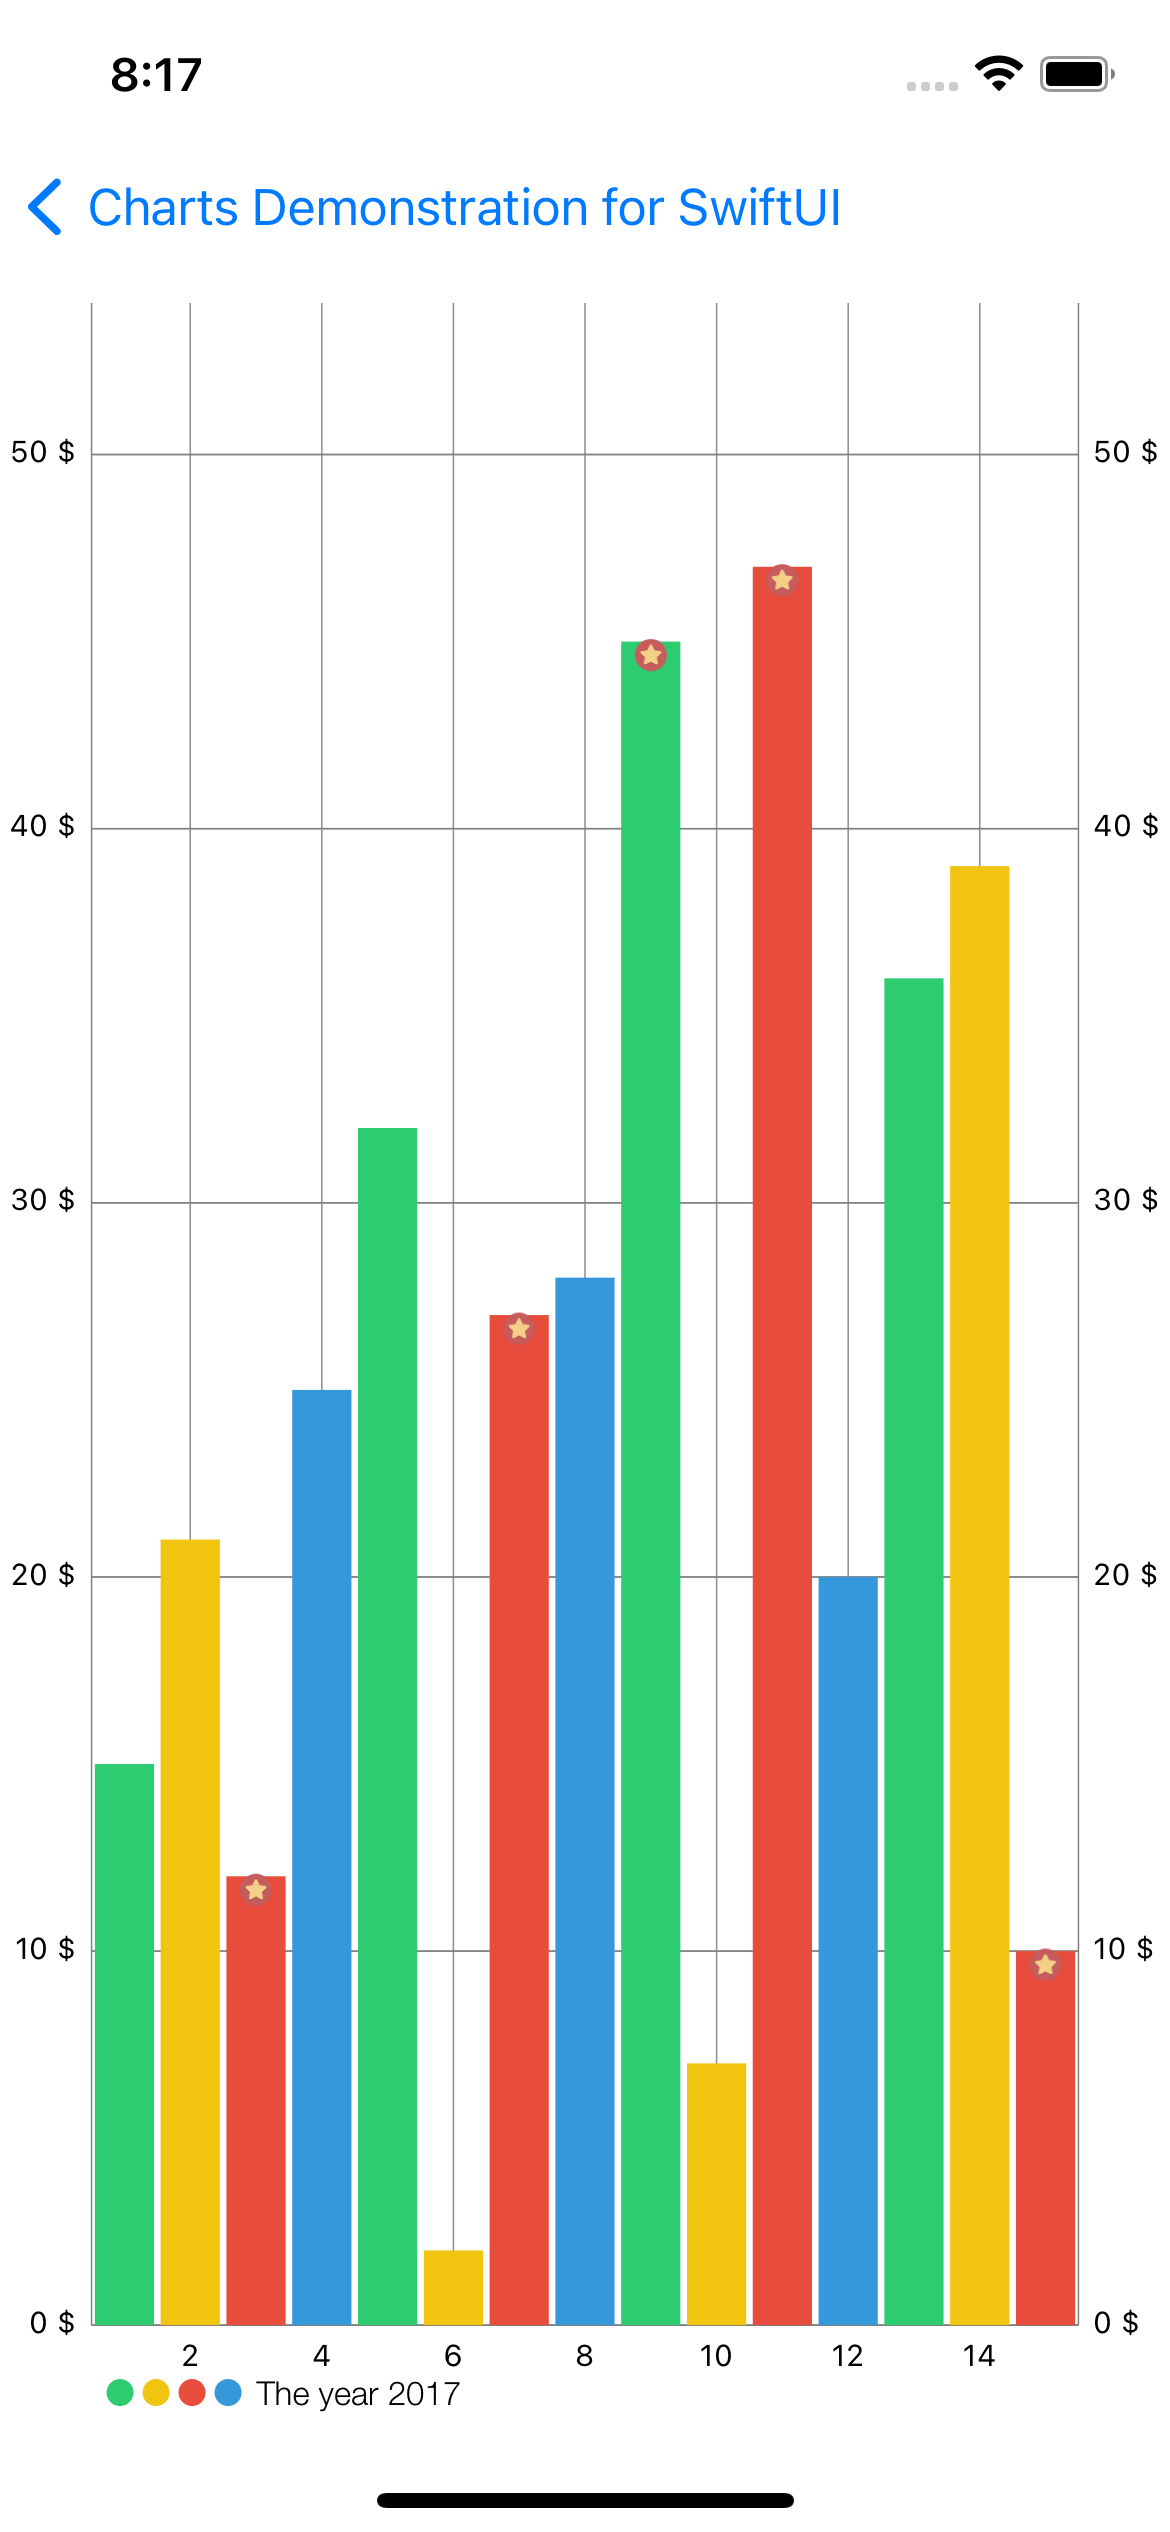
BarChart.swift
import SwiftUI
import Charts

struct BarChart: UIViewRepresentable {
    func makeUIView(context: Context) -> BarChartView {
        let chartView = BarChartView()

        chartView.drawBarShadowEnabled = false
        chartView.drawValueAboveBarEnabled = false

        chartView.maxVisibleCount = 60

        let xAxis = chartView.xAxis
        xAxis.labelPosition = .bottom
        xAxis.labelFont = .systemFont(ofSize: 10)
        xAxis.granularity = 1
        xAxis.labelCount = 7

        let leftAxisFormatter = NumberFormatter()
        leftAxisFormatter.minimumFractionDigits = 0
        leftAxisFormatter.maximumFractionDigits = 1
        leftAxisFormatter.negativeSuffix = " $"
        leftAxisFormatter.positiveSuffix = " $"

        let leftAxis = chartView.leftAxis
        leftAxis.labelFont = .systemFont(ofSize: 10)
        leftAxis.labelCount = 8
        leftAxis.valueFormatter = DefaultAxisValueFormatter(formatter: leftAxisFormatter)
        leftAxis.labelPosition = .outsideChart
        leftAxis.spaceTop = 0.15
        leftAxis.axisMinimum = 0 // FIXME: HUH?? this replaces startAtZero = YES

        let rightAxis = chartView.rightAxis
        rightAxis.enabled = true
        rightAxis.labelFont = .systemFont(ofSize: 10)
        rightAxis.labelCount = 8
        rightAxis.valueFormatter = leftAxis.valueFormatter
        rightAxis.spaceTop = 0.15
        rightAxis.axisMinimum = 0

        let l = chartView.legend
        l.horizontalAlignment = .left
        l.verticalAlignment = .bottom
        l.orientation = .horizontal
        l.drawInside = false
        l.form = .circle
        l.formSize = 9
        l.font = UIFont(name: "HelveticaNeue-Light", size: 11)!
        l.xEntrySpace = 4

        chartView.data = setDataCount(14, range: 50)

        chartView.animate(yAxisDuration: 3.0)

        return chartView
    }
    func updateUIView(_ uiView: BarChartView, context: Context) {
    }

    func setDataCount(_ count: Int, range: UInt32) -> BarChartData {
        let start = 1

        let yVals = (start..<start+count+1).map { (i) -> BarChartDataEntry in
            let mult = range + 1
            let val = Double(arc4random_uniform(mult))
            if arc4random_uniform(100) < 25 {
                return BarChartDataEntry(x: Double(i), y: val, icon: UIImage(named: "icon"))
            } else {
                return BarChartDataEntry(x: Double(i), y: val)
            }
        }

        var set1: BarChartDataSet! = nil
        set1 = BarChartDataSet(entries: yVals, label: "The year 2017")
        set1.colors = ChartColorTemplates.material()
        set1.drawValuesEnabled = false

        let data = BarChartData(dataSet: set1)
        data.setValueFont(UIFont(name: "HelveticaNeue-Light", size: 10)!)
        data.barWidth = 0.9

        return data
    }
}
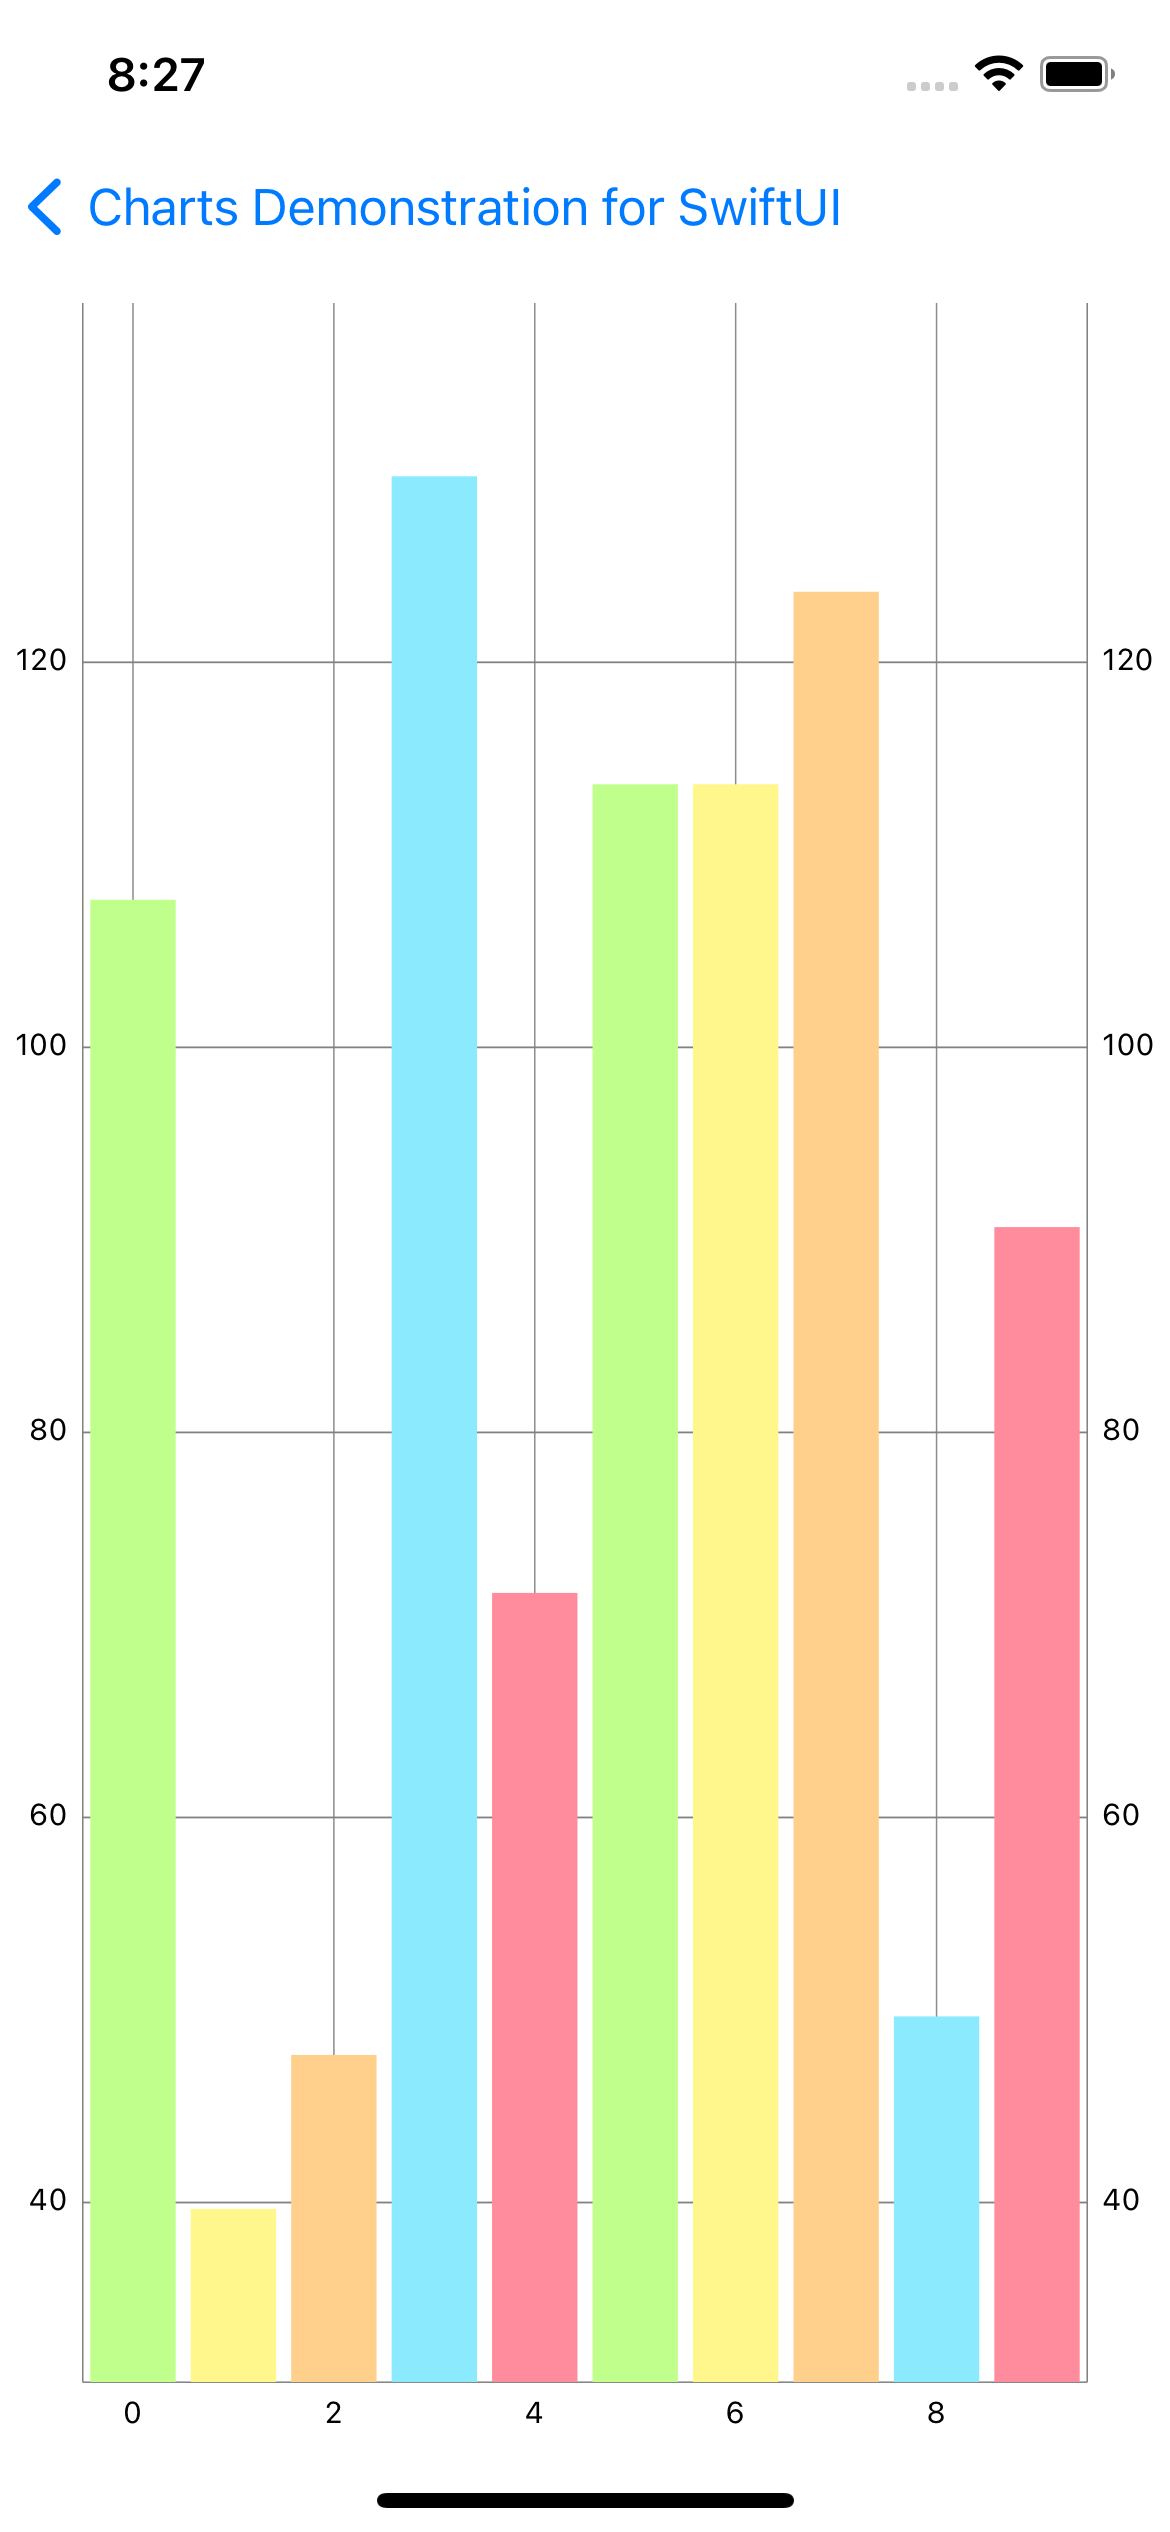
Horizontal Bar Chart
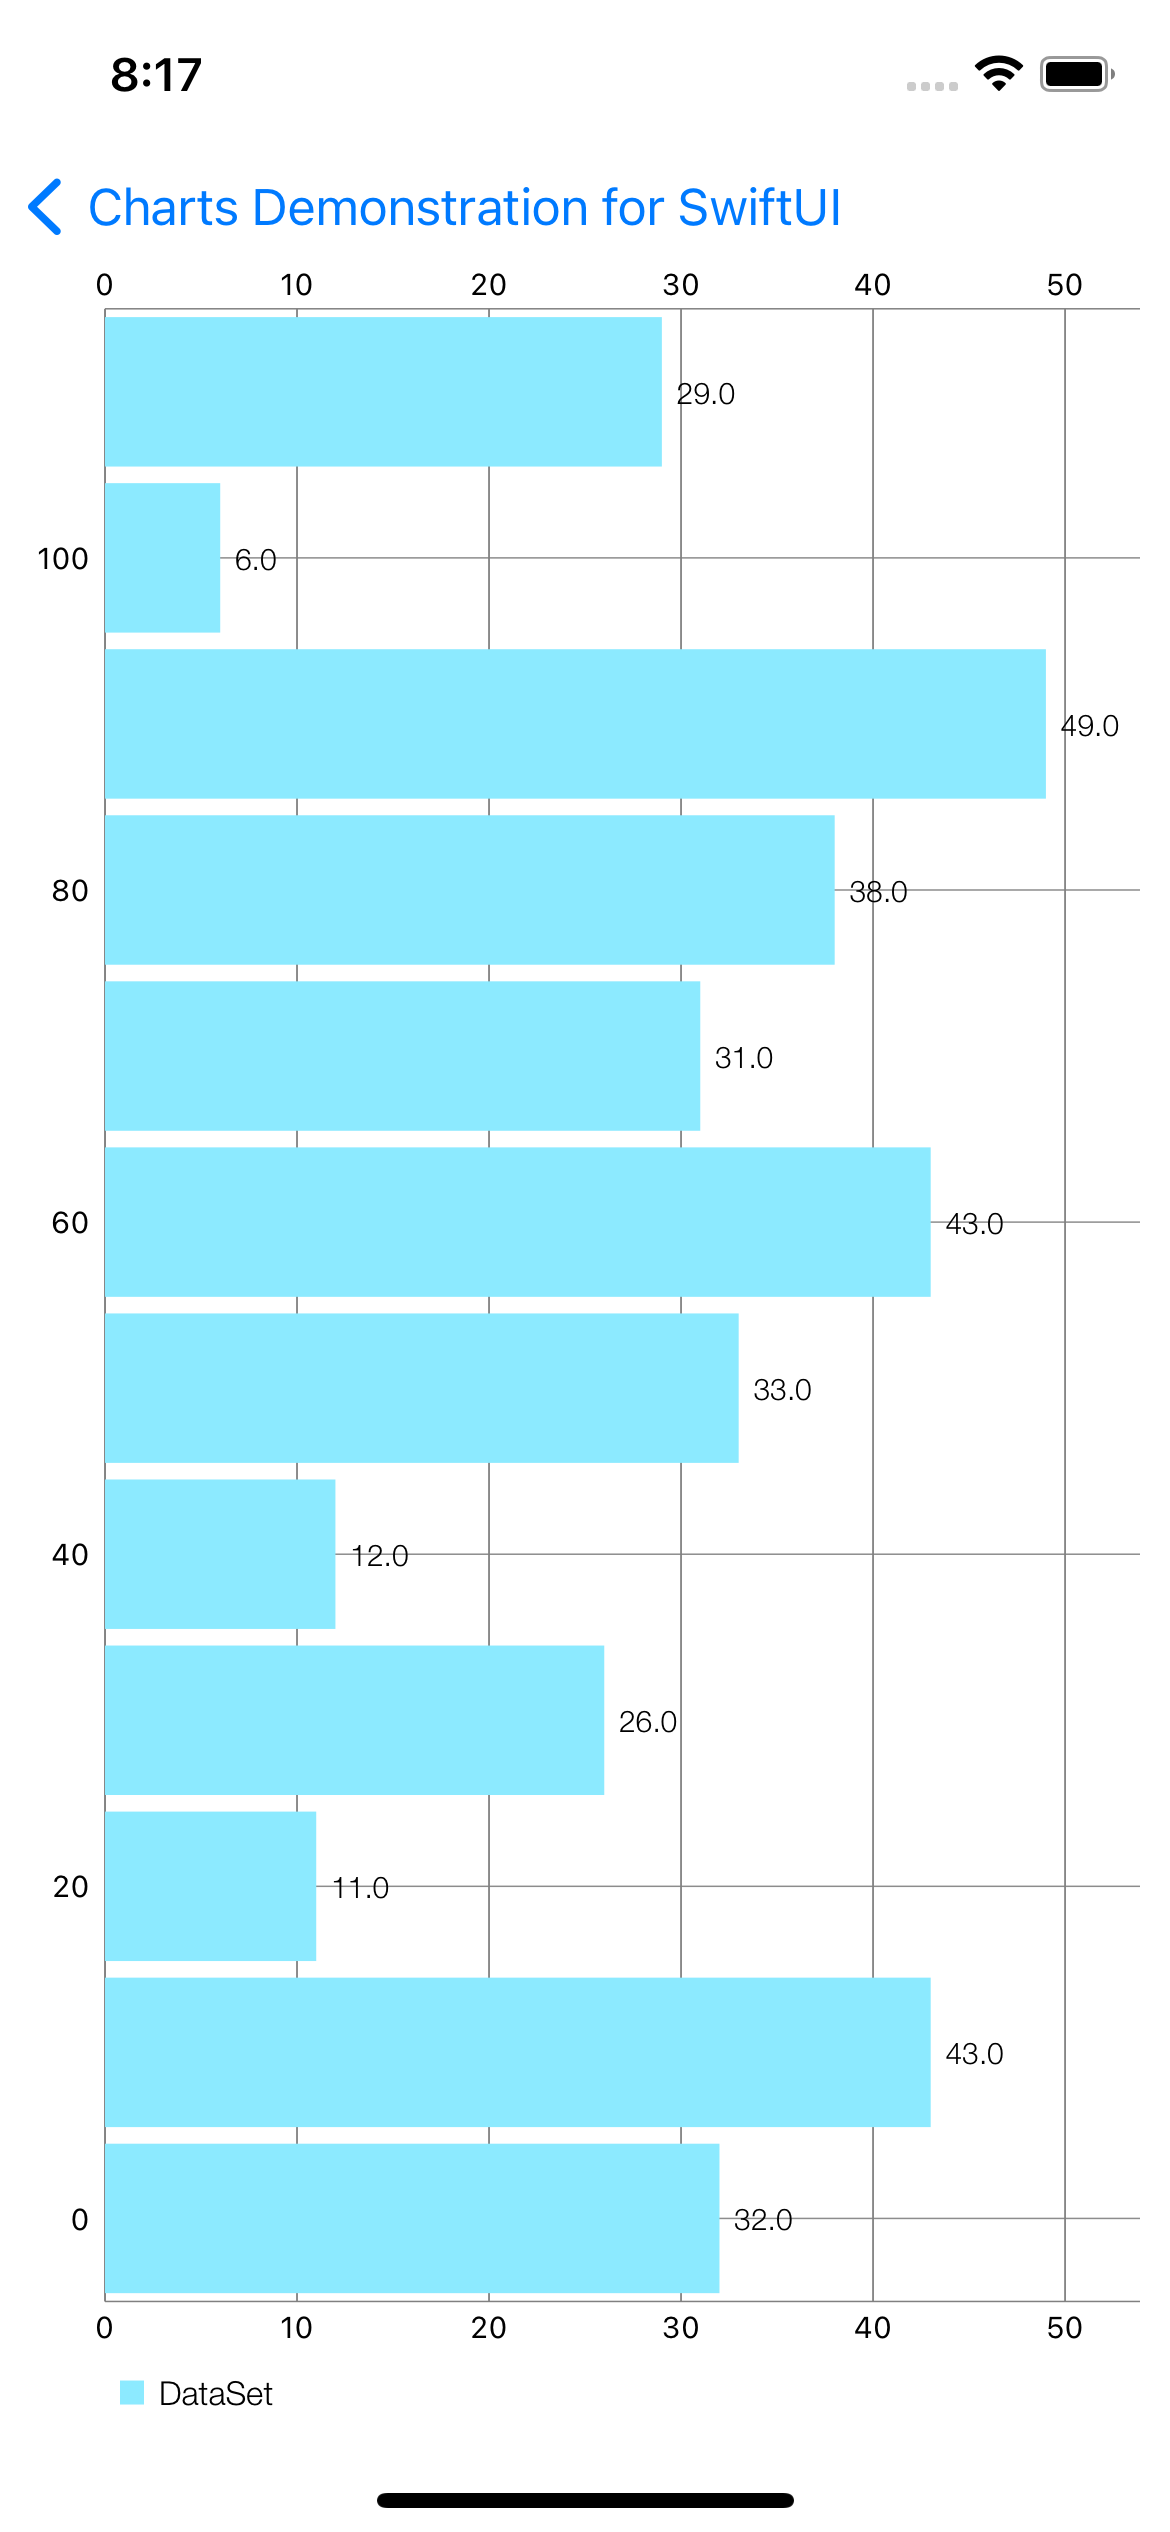
HorizontalBarChart.swift
import SwiftUI
import Charts

struct HorizontalBarChart: UIViewRepresentable {
    func makeUIView(context: Context) -> HorizontalBarChartView {
        let chartView = HorizontalBarChartView()

        chartView.drawBarShadowEnabled = false
        chartView.drawValueAboveBarEnabled = true

        chartView.maxVisibleCount = 60

        let xAxis = chartView.xAxis
        xAxis.labelPosition = .bottom
        xAxis.labelFont = .systemFont(ofSize: 10)
        xAxis.drawAxisLineEnabled = true
        xAxis.granularity = 10

        let leftAxis = chartView.leftAxis
        leftAxis.labelFont = .systemFont(ofSize: 10)
        leftAxis.drawAxisLineEnabled = true
        leftAxis.drawGridLinesEnabled = true
        leftAxis.axisMinimum = 0

        let rightAxis = chartView.rightAxis
        rightAxis.enabled = true
        rightAxis.labelFont = .systemFont(ofSize: 10)
        rightAxis.drawAxisLineEnabled = true
        rightAxis.axisMinimum = 0

        let l = chartView.legend
        l.horizontalAlignment = .left
        l.verticalAlignment = .bottom
        l.orientation = .horizontal
        l.drawInside = false
        l.form = .square
        l.formSize = 8
        l.font = UIFont(name: "HelveticaNeue-Light", size: 11)!
        l.xEntrySpace = 4

        chartView.fitBars = true

        chartView.data = setDataCount(12, range: 50)

        chartView.animate(yAxisDuration: 2.5)

        return chartView
    }
    func updateUIView(_ uiView: HorizontalBarChartView, context: Context) {
    }

    func setDataCount(_ count: Int, range: UInt32) -> BarChartData {
        let barWidth = 9.0
        let spaceForBar = 10.0

        let yVals = (0..<count).map { (i) -> BarChartDataEntry in
            let mult = range + 1
            let val = Double(arc4random_uniform(mult))
            return BarChartDataEntry(x: Double(i)*spaceForBar, y: val, icon: #imageLiteral(resourceName: "icon"))
        }

        let set1 = BarChartDataSet(entries: yVals, label: "DataSet")
        set1.drawIconsEnabled = false

        let data = BarChartData(dataSet: set1)
        data.setValueFont(UIFont(name:"HelveticaNeue-Light", size:10)!)
        data.barWidth = barWidth

        return data
    }
}
Combined Chart

CombinedChart.swift
import SwiftUI
import Charts

private let ITEM_COUNT = 12

struct CombinedChart: UIViewRepresentable {
    func makeUIView(context: Context) -> CombinedChartView {
        let chartView = CombinedChartView()

        chartView.chartDescription?.enabled = false

        chartView.drawBarShadowEnabled = false
        chartView.highlightFullBarEnabled = false

        let l = chartView.legend
        l.wordWrapEnabled = true
        l.horizontalAlignment = .center
        l.verticalAlignment = .bottom
        l.orientation = .horizontal
        l.drawInside = false

        let rightAxis = chartView.rightAxis
        rightAxis.axisMinimum = 0

        let leftAxis = chartView.leftAxis
        leftAxis.axisMinimum = 0

        let xAxis = chartView.xAxis
        xAxis.labelPosition = .bothSided
        xAxis.axisMinimum = 0
        xAxis.granularity = 1

        chartView.data = setDataCount()

        return chartView
    }
    func updateUIView(_ uiView: CombinedChartView, context: Context) {
    }

    func setDataCount() -> CombinedChartData {
        let data = CombinedChartData()
        data.lineData = generateLineData()
        data.barData = generateBarData()
        data.bubbleData = generateBubbleData()
        data.scatterData = generateScatterData()
        data.candleData = generateCandleData()

        return data
    }
    func generateLineData() -> LineChartData {
        let entries = (0..<ITEM_COUNT).map { (i) -> ChartDataEntry in
            return ChartDataEntry(x: Double(i) + 0.5, y: Double(arc4random_uniform(15) + 5))
        }

        let set = LineChartDataSet(entries: entries, label: "Line DataSet")
        set.setColor(UIColor(red: 240/255, green: 238/255, blue: 70/255, alpha: 1))
        set.lineWidth = 2.5
        set.setCircleColor(UIColor(red: 240/255, green: 238/255, blue: 70/255, alpha: 1))
        set.circleRadius = 5
        set.circleHoleRadius = 2.5
        set.fillColor = UIColor(red: 240/255, green: 238/255, blue: 70/255, alpha: 1)
        set.mode = .cubicBezier
        set.drawValuesEnabled = true
        set.valueFont = .systemFont(ofSize: 10)
        set.valueTextColor = UIColor(red: 240/255, green: 238/255, blue: 70/255, alpha: 1)

        set.axisDependency = .left

        return LineChartData(dataSet: set)
    }

    func generateBarData() -> BarChartData {
        let entries1 = (0..<ITEM_COUNT).map { _ -> BarChartDataEntry in
            return BarChartDataEntry(x: 0, y: Double(arc4random_uniform(25) + 25))
        }
        let entries2 = (0..<ITEM_COUNT).map { _ -> BarChartDataEntry in
            return BarChartDataEntry(x: 0, yValues: [Double(arc4random_uniform(13) + 12), Double(arc4random_uniform(13) + 12)])
        }

        let set1 = BarChartDataSet(entries: entries1, label: "Bar 1")
        set1.setColor(UIColor(red: 60/255, green: 220/255, blue: 78/255, alpha: 1))
        set1.valueTextColor = UIColor(red: 60/255, green: 220/255, blue: 78/255, alpha: 1)
        set1.valueFont = .systemFont(ofSize: 10)
        set1.axisDependency = .left

        let set2 = BarChartDataSet(entries: entries2, label: "")
        set2.stackLabels = ["Stack 1", "Stack 2"]
        set2.colors = [UIColor(red: 61/255, green: 165/255, blue: 255/255, alpha: 1),
                       UIColor(red: 23/255, green: 197/255, blue: 255/255, alpha: 1)
        ]
        set2.valueTextColor = UIColor(red: 61/255, green: 165/255, blue: 255/255, alpha: 1)
        set2.valueFont = .systemFont(ofSize: 10)
        set2.axisDependency = .left

        let groupSpace = 0.06
        let barSpace = 0.02 // x2 dataset
        let barWidth = 0.45 // x2 dataset
        // (0.45 + 0.02) * 2 + 0.06 = 1.00 -> interval per "group"

        let data: BarChartData = BarChartData(dataSets: [set1, set2])
        data.barWidth = barWidth

        // make this BarData object grouped
        data.groupBars(fromX: 0, groupSpace: groupSpace, barSpace: barSpace)

        return data
    }

    func generateScatterData() -> ScatterChartData {
        let entries = stride(from: 0.0, to: Double(ITEM_COUNT), by: 0.5).map { (i) -> ChartDataEntry in
            return ChartDataEntry(x: i+0.25, y: Double(arc4random_uniform(10) + 55))
        }

        let set = ScatterChartDataSet(entries: entries, label: "Scatter DataSet")
        set.colors = ChartColorTemplates.material()
        set.scatterShapeSize = 4.5
        set.drawValuesEnabled = false
        set.valueFont = .systemFont(ofSize: 10)

        return ScatterChartData(dataSet: set)
    }

    func generateCandleData() -> CandleChartData {
        let entries = stride(from: 0, to: ITEM_COUNT, by: 2).map { (i) -> CandleChartDataEntry in
            return CandleChartDataEntry(x: Double(i+1), shadowH: 90, shadowL: 70, open: 85, close: 75)
        }

        let set = CandleChartDataSet(entries: entries, label: "Candle DataSet")
        set.setColor(UIColor(red: 80/255, green: 80/255, blue: 80/255, alpha: 1))
        set.decreasingColor = UIColor(red: 142/255, green: 150/255, blue: 175/255, alpha: 1)
        set.shadowColor = .darkGray
        set.valueFont = .systemFont(ofSize: 10)
        set.drawValuesEnabled = false

        return CandleChartData(dataSet: set)
    }

    func generateBubbleData() -> BubbleChartData {
        let entries = (0..<ITEM_COUNT).map { (i) -> BubbleChartDataEntry in
            return BubbleChartDataEntry(x: Double(i) + 0.5,
                                        y: Double(arc4random_uniform(10) + 105),
                                        size: CGFloat(arc4random_uniform(50) + 105))
        }

        let set = BubbleChartDataSet(entries: entries, label: "Bubble DataSet")
        set.setColors(ChartColorTemplates.vordiplom(), alpha: 1)
        set.valueTextColor = .white
        set.valueFont = .systemFont(ofSize: 10)
        set.drawValuesEnabled = true

        return BubbleChartData(dataSet: set)
    }
}
Pie Chart
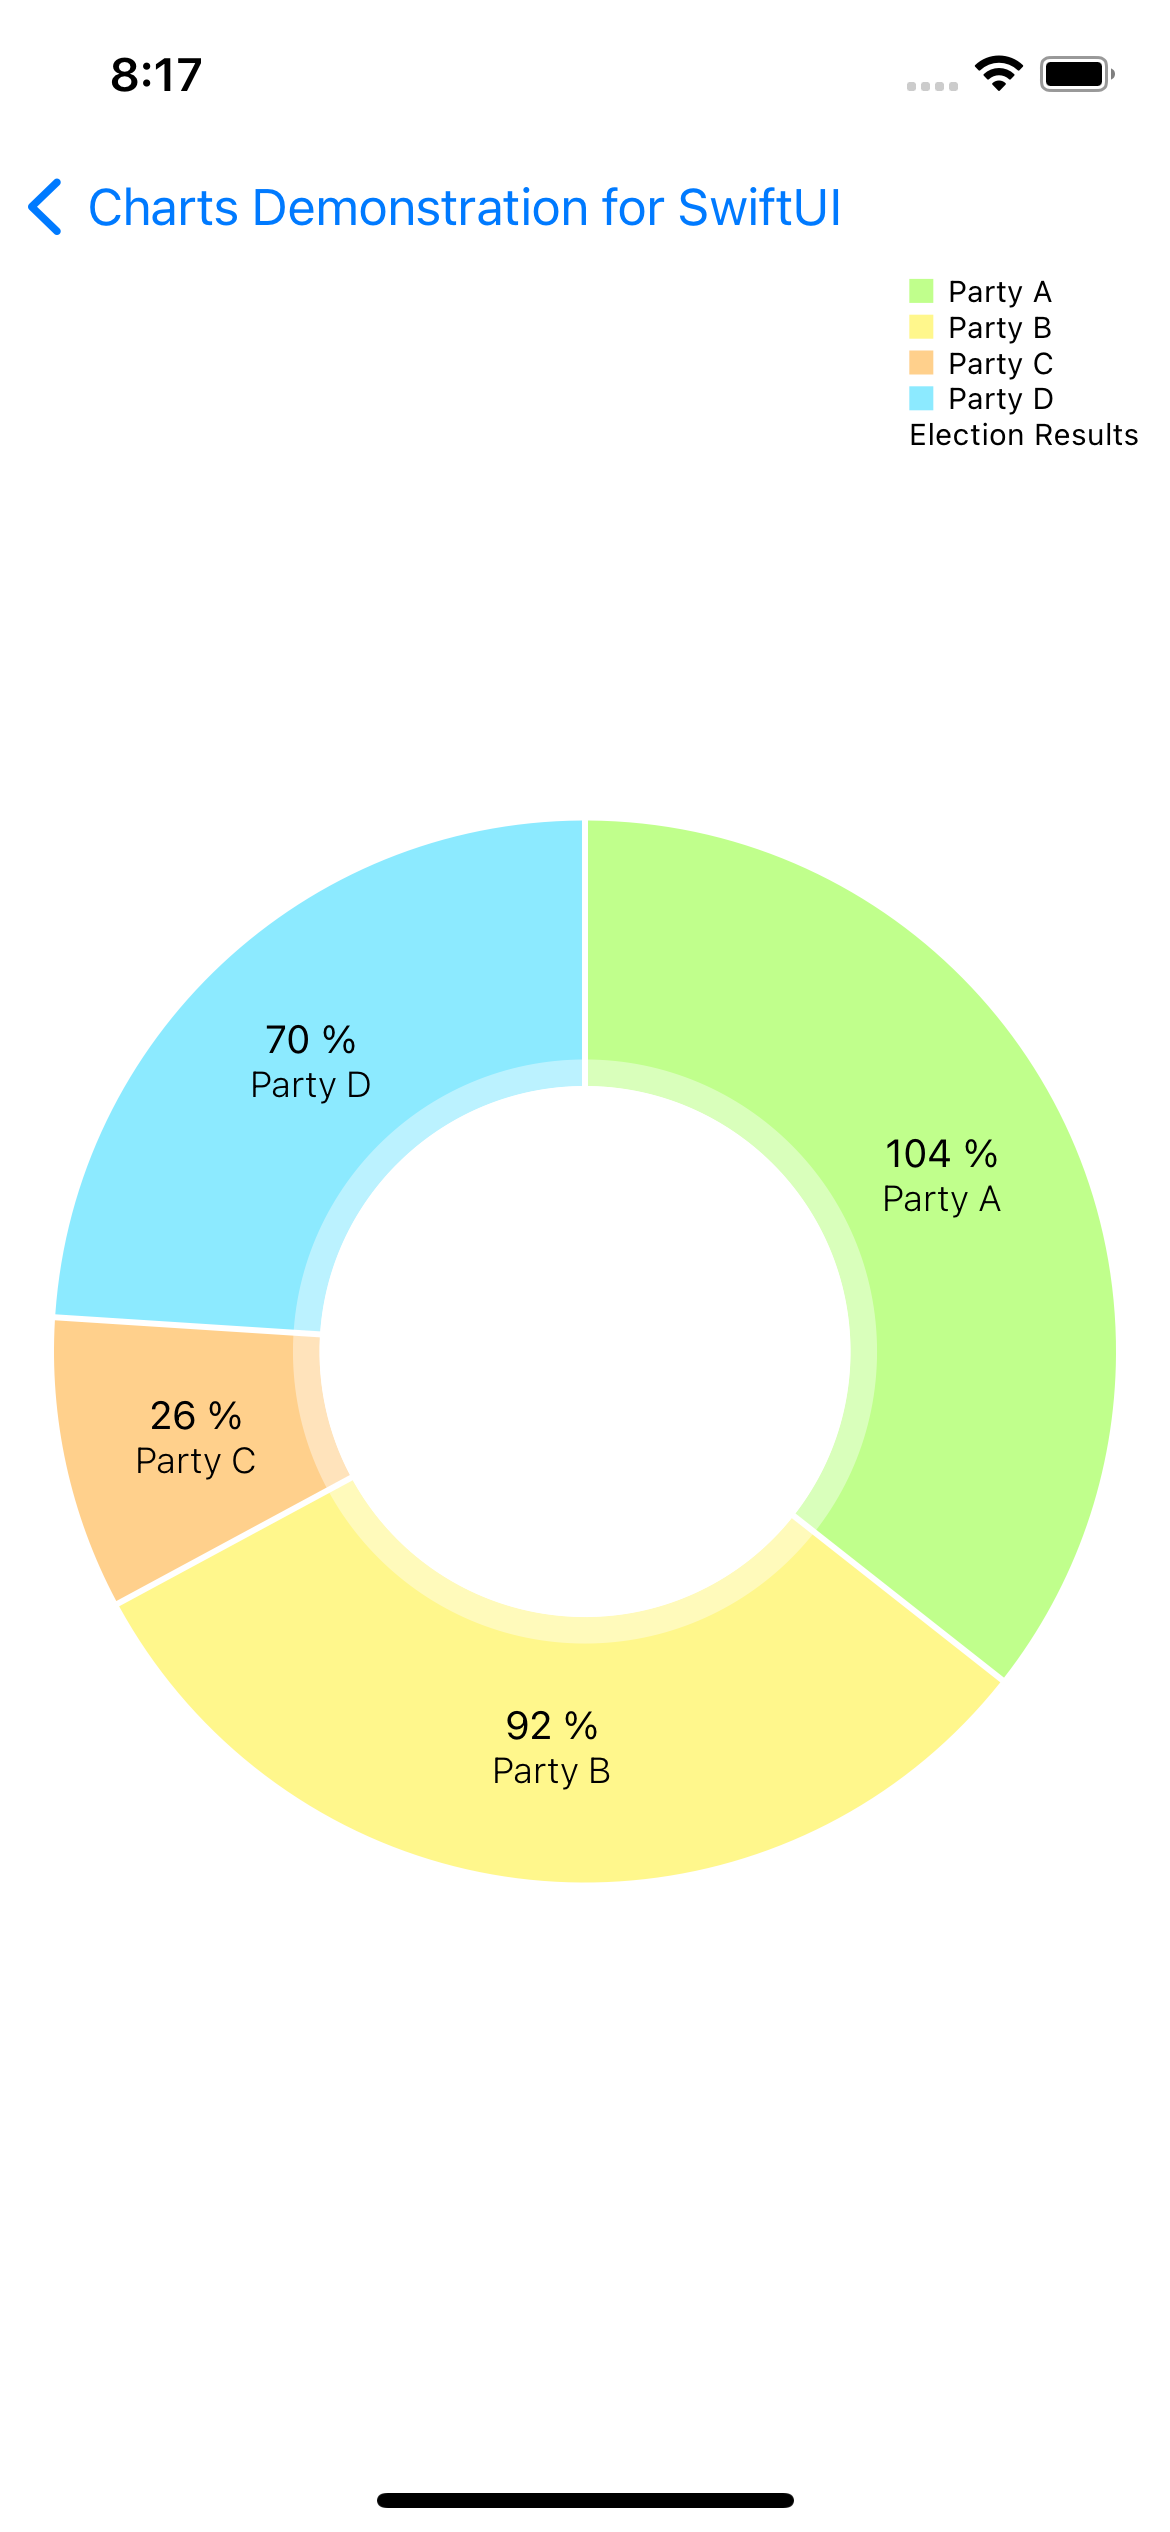
PieChart.swift
import SwiftUI
import Charts

private let parties = [
    "Party A", "Party B", "Party C", "Party D", "Party E", "Party F",
    "Party G", "Party H", "Party I", "Party J", "Party K", "Party L",
    "Party M", "Party N", "Party O", "Party P", "Party Q", "Party R",
    "Party S", "Party T", "Party U", "Party V", "Party W", "Party X",
    "Party Y", "Party Z"
]

struct PieChart: UIViewRepresentable {
    func makeUIView(context: Context) -> PieChartView {
        let chartView = PieChartView()

        let l = chartView.legend
        l.horizontalAlignment = .right
        l.verticalAlignment = .top
        l.orientation = .vertical
        l.xEntrySpace = 7
        l.yEntrySpace = 0
        l.yOffset = 0

        chartView.entryLabelColor = .black
        chartView.entryLabelFont = .systemFont(ofSize: 12, weight: .light)

        chartView.data = setDataCount(4, range: 100)

        chartView.animate(xAxisDuration: 1.4, easingOption: .easeOutBack)

        return chartView
    }
    func updateUIView(_ uiView: PieChartView, context: Context) {
    }

    func setDataCount(_ count: Int, range: UInt32) -> PieChartData {
        let entries = (0..<count).map { (i) -> PieChartDataEntry in
            // IMPORTANT: In a PieChart, no values (Entry) should have the same xIndex (even if from different DataSets), since no values can be drawn above each other.
            return PieChartDataEntry(value: Double(arc4random_uniform(range) + range / 5),
                                     label: parties[i % parties.count],
                                     icon: #imageLiteral(resourceName: "icon"))
        }

        let set = PieChartDataSet(entries: entries, label: "Election Results")
        set.drawIconsEnabled = false
        set.sliceSpace = 2


        set.colors = ChartColorTemplates.vordiplom()
            + ChartColorTemplates.joyful()
            + ChartColorTemplates.colorful()
            + ChartColorTemplates.liberty()
            + ChartColorTemplates.pastel()
            + [UIColor(red: 51/255, green: 181/255, blue: 229/255, alpha: 1)]

        let data = PieChartData(dataSet: set)

        let pFormatter = NumberFormatter()
        pFormatter.numberStyle = .percent
        pFormatter.maximumFractionDigits = 1
        pFormatter.multiplier = 1
        pFormatter.percentSymbol = " %"
        data.setValueFormatter(DefaultValueFormatter(formatter: pFormatter))
        data.setValueTextColor(.black)

        return data
    }
}
Pie Chart with value lines

PiePolylineChart.swift
import SwiftUI
import Charts

private let parties = [
    "Party A", "Party B", "Party C", "Party D", "Party E", "Party F",
    "Party G", "Party H", "Party I", "Party J", "Party K", "Party L",
    "Party M", "Party N", "Party O", "Party P", "Party Q", "Party R",
    "Party S", "Party T", "Party U", "Party V", "Party W", "Party X",
    "Party Y", "Party Z"
]

struct PiePolylineChart: UIViewRepresentable {
    @Environment(\.colorScheme) var colorScheme
    func makeUIView(context: Context) -> PieChartView {
        let chartView = PieChartView()

        chartView.legend.enabled = false
        chartView.setExtraOffsets(left: 20, top: 0, right: 20, bottom: 0)

        chartView.entryLabelColor = .black
        chartView.entryLabelFont = .systemFont(ofSize: 12, weight: .light)

        chartView.data = setDataCount(10, range: 100)

        chartView.animate(xAxisDuration: 1.4, easingOption: .easeOutBack)

        return chartView
    }
    func updateUIView(_ uiView: PieChartView, context: Context) {
    }

    func setDataCount(_ count: Int, range: UInt32) -> PieChartData {
        let entries = (0..<count).map { (i) -> PieChartDataEntry in
            // IMPORTANT: In a PieChart, no values (Entry) should have the same xIndex (even if from different DataSets), since no values can be drawn above each other.
            return PieChartDataEntry(value: Double(arc4random_uniform(range) + range / 5),
                                     label: parties[i % parties.count])
        }

        let set = PieChartDataSet(entries: entries, label: "Election Results")
        set.sliceSpace = 2


        set.colors = ChartColorTemplates.vordiplom()
            + ChartColorTemplates.joyful()
            + ChartColorTemplates.colorful()
            + ChartColorTemplates.liberty()
            + ChartColorTemplates.pastel()
            + [UIColor(red: 51/255, green: 181/255, blue: 229/255, alpha: 1)]

        set.valueLinePart1OffsetPercentage = 0.8
        set.valueLinePart1Length = 0.2
        set.valueLinePart2Length = 0.4
        set.yValuePosition = .outsideSlice

        let data = PieChartData(dataSet: set)

        let pFormatter = NumberFormatter()
        pFormatter.numberStyle = .percent
        pFormatter.maximumFractionDigits = 1
        pFormatter.multiplier = 1
        pFormatter.percentSymbol = " %"
        data.setValueFormatter(DefaultValueFormatter(formatter: pFormatter))
        data.setValueFont(.systemFont(ofSize: 11, weight: .light))
        data.setValueTextColor(colorScheme == .dark ? .white : .black)

        return data
    }
}
Scatter Chart

ScatterChart.swift
import SwiftUI
import Charts

struct ScatterChart: UIViewRepresentable {
    func makeUIView(context: Context) -> ScatterChartView {
        let chartView = ScatterChartView()

        chartView.chartDescription?.enabled = false

        chartView.dragEnabled = true
        chartView.setScaleEnabled(true)
        chartView.maxVisibleCount = 200
        chartView.pinchZoomEnabled = true

        let l = chartView.legend
        l.horizontalAlignment = .left
        l.verticalAlignment = .bottom
        l.orientation = .horizontal
        l.drawInside = false
        l.font = .systemFont(ofSize: 10, weight: .light)
        l.xOffset = 5

        let leftAxis = chartView.leftAxis
        leftAxis.labelFont = .systemFont(ofSize: 10, weight: .light)
        leftAxis.axisMinimum = 0

        chartView.rightAxis.enabled = false


        let xAxis = chartView.xAxis
        xAxis.labelFont = .systemFont(ofSize: 10, weight: .light)

        chartView.data = setDataCount(45, range: 100)

        return chartView
    }
    func updateUIView(_ uiView: ScatterChartView, context: Context) {
    }

    func setDataCount(_ count: Int, range: UInt32) -> ScatterChartData {
        let values1 = (0..<count).map { (i) -> ChartDataEntry in
            let val = Double(arc4random_uniform(range) + 3)
            return ChartDataEntry(x: Double(i), y: val)
        }
        let values2 = (0..<count).map { (i) -> ChartDataEntry in
            let val = Double(arc4random_uniform(range) + 3)
            return ChartDataEntry(x: Double(i) + 0.33, y: val)
        }
        let values3 = (0..<count).map { (i) -> ChartDataEntry in
            let val = Double(arc4random_uniform(range) + 3)
            return ChartDataEntry(x: Double(i) + 0.66, y: val)
        }


        let set1 = ScatterChartDataSet(entries: values1, label: "DS 1")
        set1.setScatterShape(.square)
        set1.setColor(ChartColorTemplates.colorful()[0])
        set1.scatterShapeSize = 8

        let set2 = ScatterChartDataSet(entries: values2, label: "DS 2")
        set2.setScatterShape(.circle)
        set2.scatterShapeHoleColor = ChartColorTemplates.colorful()[3]
        set2.scatterShapeHoleRadius = 3.5
        set2.setColor(ChartColorTemplates.colorful()[1])
        set2.scatterShapeSize = 8

        let set3 = ScatterChartDataSet(entries: values3, label: "DS 3")
        set3.setScatterShape(.cross)
        set3.setColor(ChartColorTemplates.colorful()[2])
        set3.scatterShapeSize = 8

        let data: ScatterChartData = ScatterChartData(dataSets: [set1, set2, set3])
        data.setValueFont(.systemFont(ofSize: 7, weight: .light))

        return data
    }
}
Bubble Chart

BubbleChart.swift
import SwiftUI
import Charts

struct BubbleChart: UIViewRepresentable {
    func makeUIView(context: Context) -> BubbleChartView {
        let chartView = BubbleChartView()

        chartView.chartDescription?.enabled = false

        chartView.dragEnabled = false
        chartView.setScaleEnabled(true)
        chartView.maxVisibleCount = 200
        chartView.pinchZoomEnabled = true

        chartView.legend.horizontalAlignment = .right
        chartView.legend.verticalAlignment = .top
        chartView.legend.orientation = .vertical
        chartView.legend.drawInside = false
        chartView.legend.font = UIFont(name: "HelveticaNeue-Light", size: 10)!

        chartView.leftAxis.labelFont = UIFont(name: "HelveticaNeue-Light", size: 10)!
        chartView.leftAxis.spaceTop = 0.3
        chartView.leftAxis.spaceBottom = 0.3
        chartView.leftAxis.axisMinimum = 0

        chartView.rightAxis.enabled = false

        chartView.xAxis.labelPosition = .bottom
        chartView.xAxis.labelFont = UIFont(name: "HelveticaNeue-Light", size: 10)!

        let l = chartView.legend
        l.horizontalAlignment = .left
        l.verticalAlignment = .bottom
        l.orientation = .horizontal
        l.drawInside = false
        l.font = .systemFont(ofSize: 10, weight: .light)
        l.xOffset = 5

        chartView.data = setDataCount(10, range: 50)

        return chartView
    }
    func updateUIView(_ uiView: BubbleChartView, context: Context) {
    }

    func setDataCount(_ count: Int, range: UInt32) -> BubbleChartData {
        let yVals1 = (0..<count).map { (i) -> BubbleChartDataEntry in
            let val = Double(arc4random_uniform(range))
            let size = CGFloat(arc4random_uniform(range))
            return BubbleChartDataEntry(x: Double(i), y: val, size: size, icon: UIImage(named: "icon"))
        }
        let yVals2 = (0..<count).map { (i) -> BubbleChartDataEntry in
            let val = Double(arc4random_uniform(range))
            let size = CGFloat(arc4random_uniform(range))
            return BubbleChartDataEntry(x: Double(i), y: val, size: size, icon: UIImage(named: "icon"))
        }
        let yVals3 = (0..<count).map { (i) -> BubbleChartDataEntry in
            let val = Double(arc4random_uniform(range))
            let size = CGFloat(arc4random_uniform(range))
            return BubbleChartDataEntry(x: Double(i), y: val, size: size)
        }

        let set1 = BubbleChartDataSet(entries: yVals1, label: "DS 1")
        set1.drawIconsEnabled = false
        set1.setColor(ChartColorTemplates.colorful()[0], alpha: 0.5)
        set1.drawValuesEnabled = true

        let set2 = BubbleChartDataSet(entries: yVals2, label: "DS 2")
        set2.drawIconsEnabled = false
        set2.iconsOffset = CGPoint(x: 0, y: 15)
        set2.setColor(ChartColorTemplates.colorful()[1], alpha: 0.5)
        set2.drawValuesEnabled = true

        let set3 = BubbleChartDataSet(entries: yVals3, label: "DS 3")
        set3.setColor(ChartColorTemplates.colorful()[2], alpha: 0.5)
        set3.drawValuesEnabled = true

        let data = BubbleChartData(dataSets: [set1, set2, set3])
        data.setDrawValues(false)
        data.setValueFont(UIFont(name: "HelveticaNeue-Light", size: 7)!)
        data.setHighlightCircleWidth(1.5)
        data.setValueTextColor(.white)

        return data
    }
}
Stacked Bar Chart

StackedBarChart.swift
import SwiftUI
import Charts

struct StackedBarChart: UIViewRepresentable {
    var formatter: NumberFormatter = {
        let formatter = NumberFormatter()
        formatter.maximumFractionDigits = 1
        formatter.negativeSuffix = " $"
        formatter.positiveSuffix = " $"

        return formatter
    }()

    func makeUIView(context: Context) -> BarChartView {
        let chartView = BarChartView()

        chartView.chartDescription?.enabled = false

        chartView.maxVisibleCount = 40
        chartView.drawBarShadowEnabled = false
        chartView.drawValueAboveBarEnabled = false
        chartView.highlightFullBarEnabled = false

        let leftAxis = chartView.leftAxis
        leftAxis.valueFormatter = DefaultAxisValueFormatter(formatter: self.formatter)
        leftAxis.axisMinimum = 0

        chartView.rightAxis.enabled = false

        let xAxis = chartView.xAxis
        xAxis.labelPosition = .top

        let l = chartView.legend
        l.horizontalAlignment = .right
        l.verticalAlignment = .bottom
        l.orientation = .horizontal
        l.drawInside = false
        l.form = .square
        l.formToTextSpace = 4
        l.xEntrySpace = 6

        chartView.fitBars = true

        chartView.data = setDataCount(12, range: 100)

        chartView.animate(yAxisDuration: 3.0)

        return chartView
    }
    func updateUIView(_ uiView: BarChartView, context: Context) {
    }

    func setDataCount(_ count: Int, range: UInt32) -> BarChartData {
        let yVals = (0..<count).map { (i) -> BarChartDataEntry in
            let mult = range + 1
            let val1 = Double(arc4random_uniform(mult) + mult / 3)
            let val2 = Double(arc4random_uniform(mult) + mult / 3)
            let val3 = Double(arc4random_uniform(mult) + mult / 3)

            return BarChartDataEntry(x: Double(i), yValues: [val1, val2, val3], icon: #imageLiteral(resourceName: "icon"))
        }

        let set = BarChartDataSet(entries: yVals, label: "Statistics Vienna 2014")
        set.drawIconsEnabled = false
        set.colors = [ChartColorTemplates.material()[0], ChartColorTemplates.material()[1], ChartColorTemplates.material()[2]]
        set.stackLabels = ["Births", "Divorces", "Marriages"]

        let data = BarChartData(dataSet: set)
        data.setValueFont(.systemFont(ofSize: 7, weight: .light))
        data.setValueFormatter(DefaultValueFormatter(formatter: formatter))
        data.setValueTextColor(.white)

        return data
    }
}
Stacked Bar Chart Negative
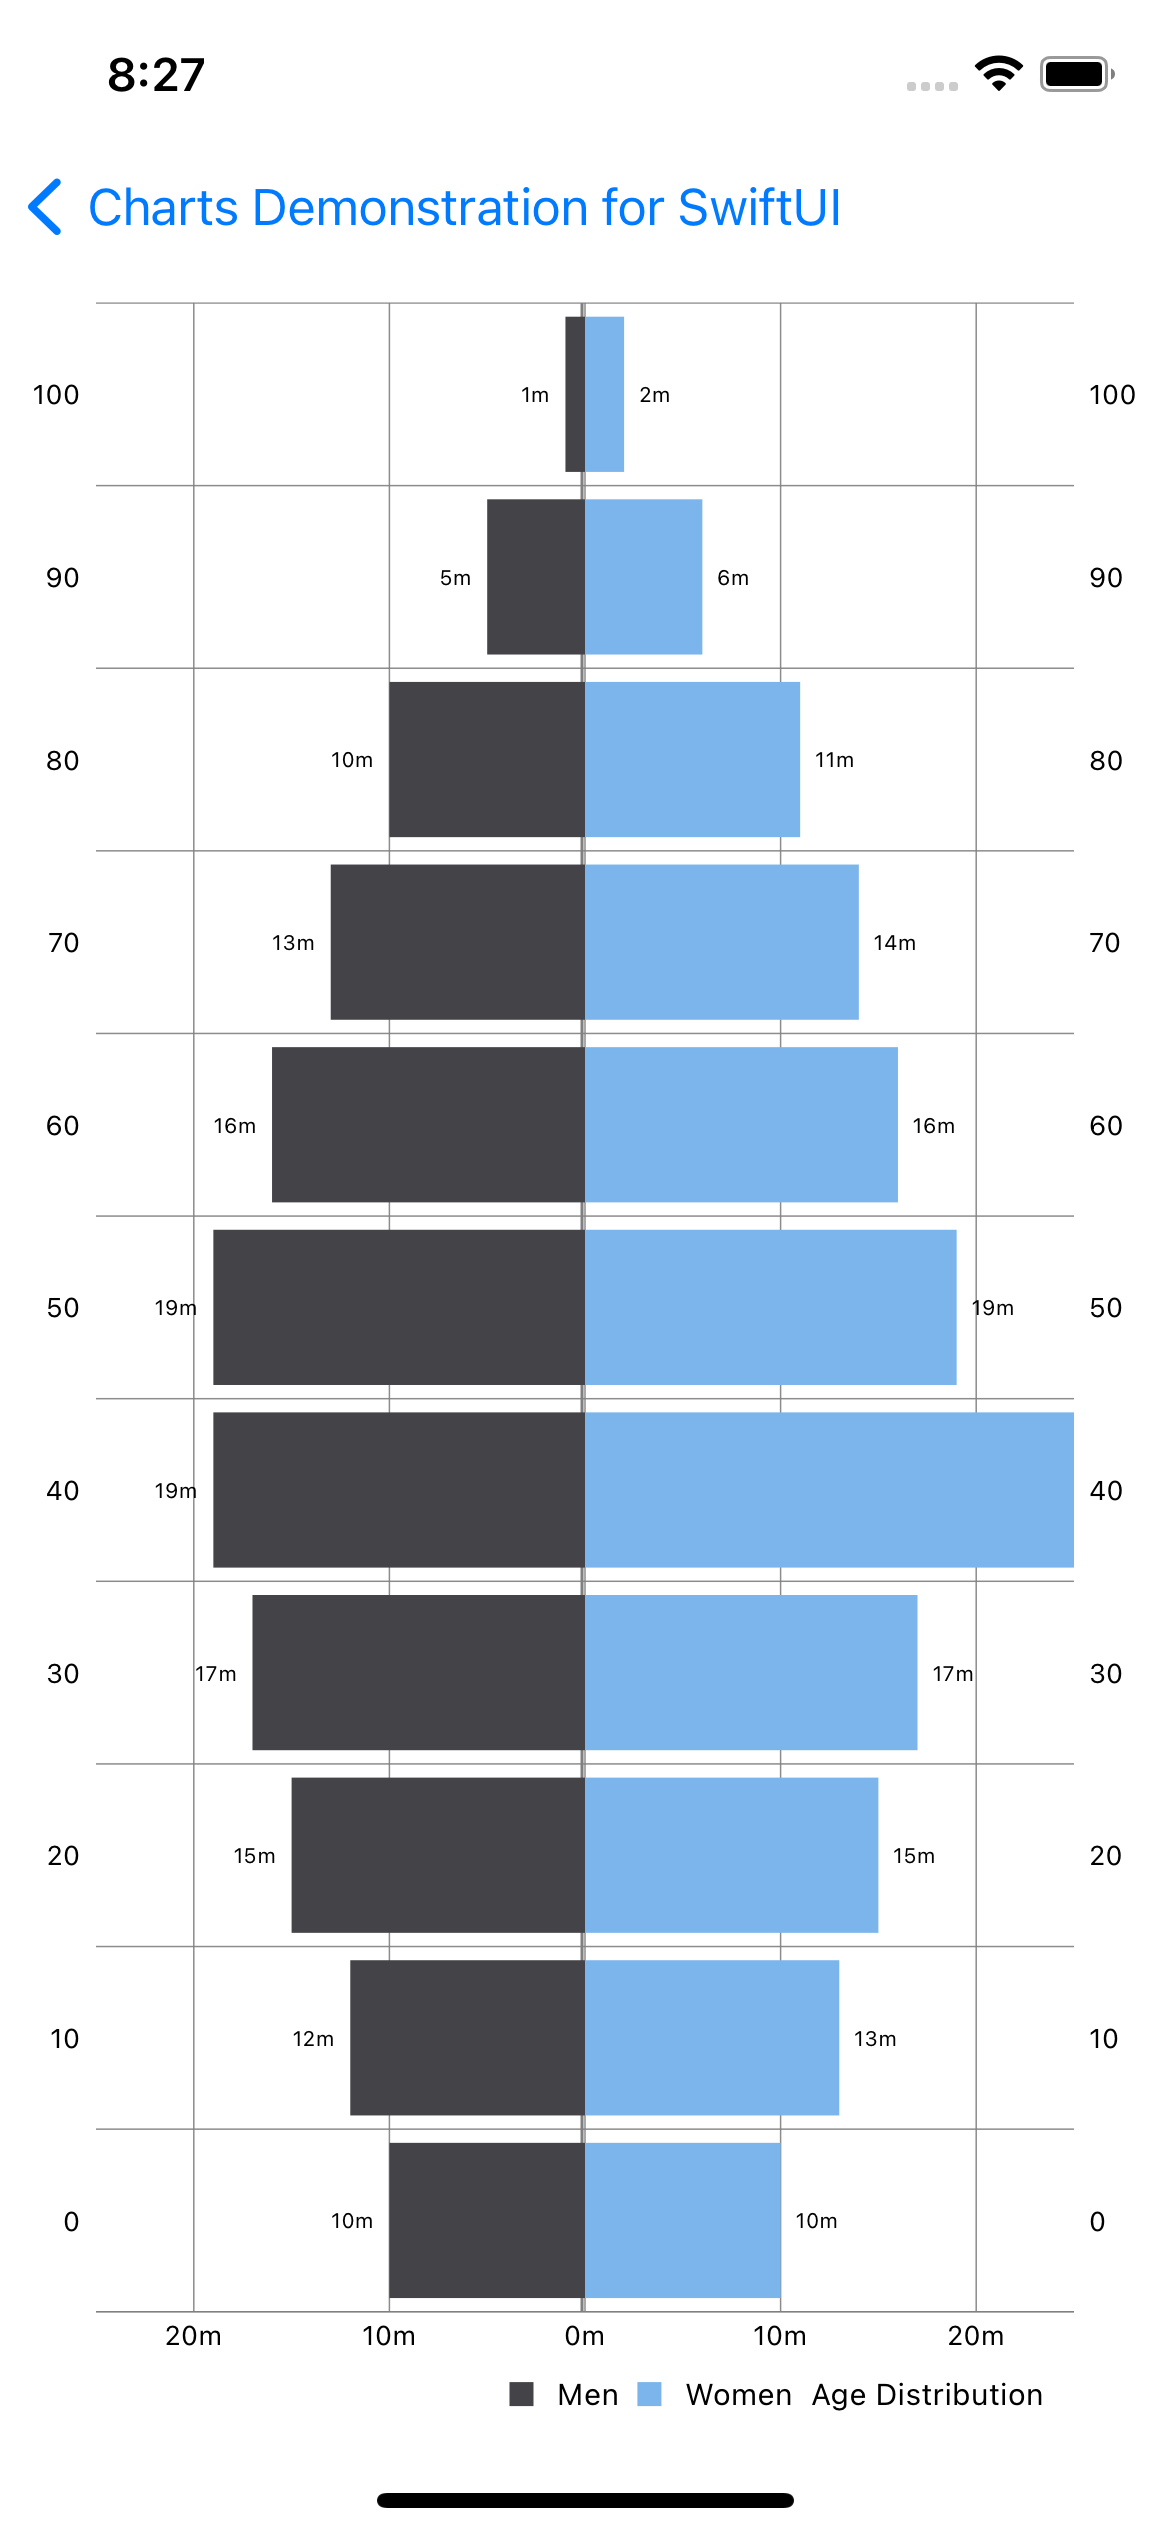
NegativeStackedBarChart.swift
import SwiftUI
import Charts

struct NegativeStackedBarChart: UIViewRepresentable {
    var customFormatter: NumberFormatter = {
        let formatter = NumberFormatter()
        formatter.negativePrefix = ""
        formatter.positiveSuffix = "m"
        formatter.negativeSuffix = "m"
        formatter.minimumSignificantDigits = 1
        formatter.minimumFractionDigits = 1
        return formatter
    }()

    func makeUIView(context: Context) -> HorizontalBarChartView {
        let chartView = HorizontalBarChartView()

        chartView.chartDescription?.enabled = false

        chartView.drawBarShadowEnabled = false
        chartView.drawValueAboveBarEnabled = true

        chartView.leftAxis.enabled = false
        let rightAxis = chartView.rightAxis
        rightAxis.axisMaximum = 25
        rightAxis.axisMinimum = -25
        rightAxis.drawZeroLineEnabled = true
        rightAxis.labelCount = 7
        rightAxis.valueFormatter = DefaultAxisValueFormatter(formatter: customFormatter)
        rightAxis.labelFont = .systemFont(ofSize: 9)

        let xAxis = chartView.xAxis
        xAxis.labelPosition = .bothSided
        xAxis.drawAxisLineEnabled = false
        xAxis.axisMinimum = 0
        xAxis.axisMaximum = 110
        xAxis.centerAxisLabelsEnabled = true
        xAxis.labelCount = 12
        xAxis.granularity = 10
        xAxis.labelFont = .systemFont(ofSize: 9)

        let l = chartView.legend
        l.horizontalAlignment = .right
        l.verticalAlignment = .bottom
        l.orientation = .horizontal
        l.formSize = 8
        l.formToTextSpace = 8
        l.xEntrySpace = 6

        chartView.data = setDataCount()

        chartView.animate(yAxisDuration: 3.0)

        return chartView
    }
    func updateUIView(_ uiView: HorizontalBarChartView, context: Context) {
    }

    func setDataCount() -> BarChartData {
        let yVals = [
            BarChartDataEntry(x: 5, yValues: [-10, 10]),
            BarChartDataEntry(x: 15, yValues: [-12, 13]),
            BarChartDataEntry(x: 25, yValues: [-15, 15]),
            BarChartDataEntry(x: 35, yValues: [-17, 17]),
            BarChartDataEntry(x: 45, yValues: [-19, 120]),
            BarChartDataEntry(x: 55, yValues: [-19, 19]),
            BarChartDataEntry(x: 65, yValues: [-16, 16]),
            BarChartDataEntry(x: 75, yValues: [-13, 14]),
            BarChartDataEntry(x: 85, yValues: [-10, 11]),
            BarChartDataEntry(x: 95, yValues: [-5, 6]),
            BarChartDataEntry(x: 105, yValues: [-1, 2])
        ]

        let set = BarChartDataSet(entries: yVals, label: "Age Distribution")
        set.drawIconsEnabled = false
        set.valueFormatter = DefaultValueFormatter(formatter: customFormatter)
        set.valueFont = .systemFont(ofSize: 7)
        set.axisDependency = .right
        set.colors = [UIColor(red: 67/255, green: 67/255, blue: 72/255, alpha: 1),
                      UIColor(red: 124/255, green: 181/255, blue: 236/255, alpha: 1)
        ]
        set.stackLabels = ["Men", "Women"]

        let data = BarChartData(dataSet: set)
        data.barWidth = 8.5

        return data
    }
}
Another Bar Chart
AnotherBarChart.swift
import SwiftUI
import Charts

struct AnotherBarChart: UIViewRepresentable {
    func makeUIView(context: Context) -> BarChartView {
        let chartView = BarChartView()

        chartView.chartDescription?.enabled = false
        chartView.maxVisibleCount = 60
        chartView.pinchZoomEnabled = false
        chartView.drawBarShadowEnabled = false

        let xAxis = chartView.xAxis
        xAxis.labelPosition = .bottom

        chartView.legend.enabled = false

        chartView.data = setDataCount(10, range: 100)

        chartView.animate(yAxisDuration: 3.0)

        return chartView
    }
    func updateUIView(_ uiView: BarChartView, context: Context) {
    }

    func setDataCount(_ count: Int, range: Double) -> BarChartData {
        let yVals = (0..<count).map { (i) -> BarChartDataEntry in
            let mult = range + 1
            let val = Double(arc4random_uniform(UInt32(mult))) + mult/3
            return BarChartDataEntry(x: Double(i), y: val)
        }

        var set1: BarChartDataSet! = nil
        set1 = BarChartDataSet(entries: yVals, label: "Data Set")
        set1.colors = ChartColorTemplates.vordiplom()
        set1.drawValuesEnabled = false

        let data = BarChartData(dataSet: set1)

        return data
    }
}
Multiple Lines Chart
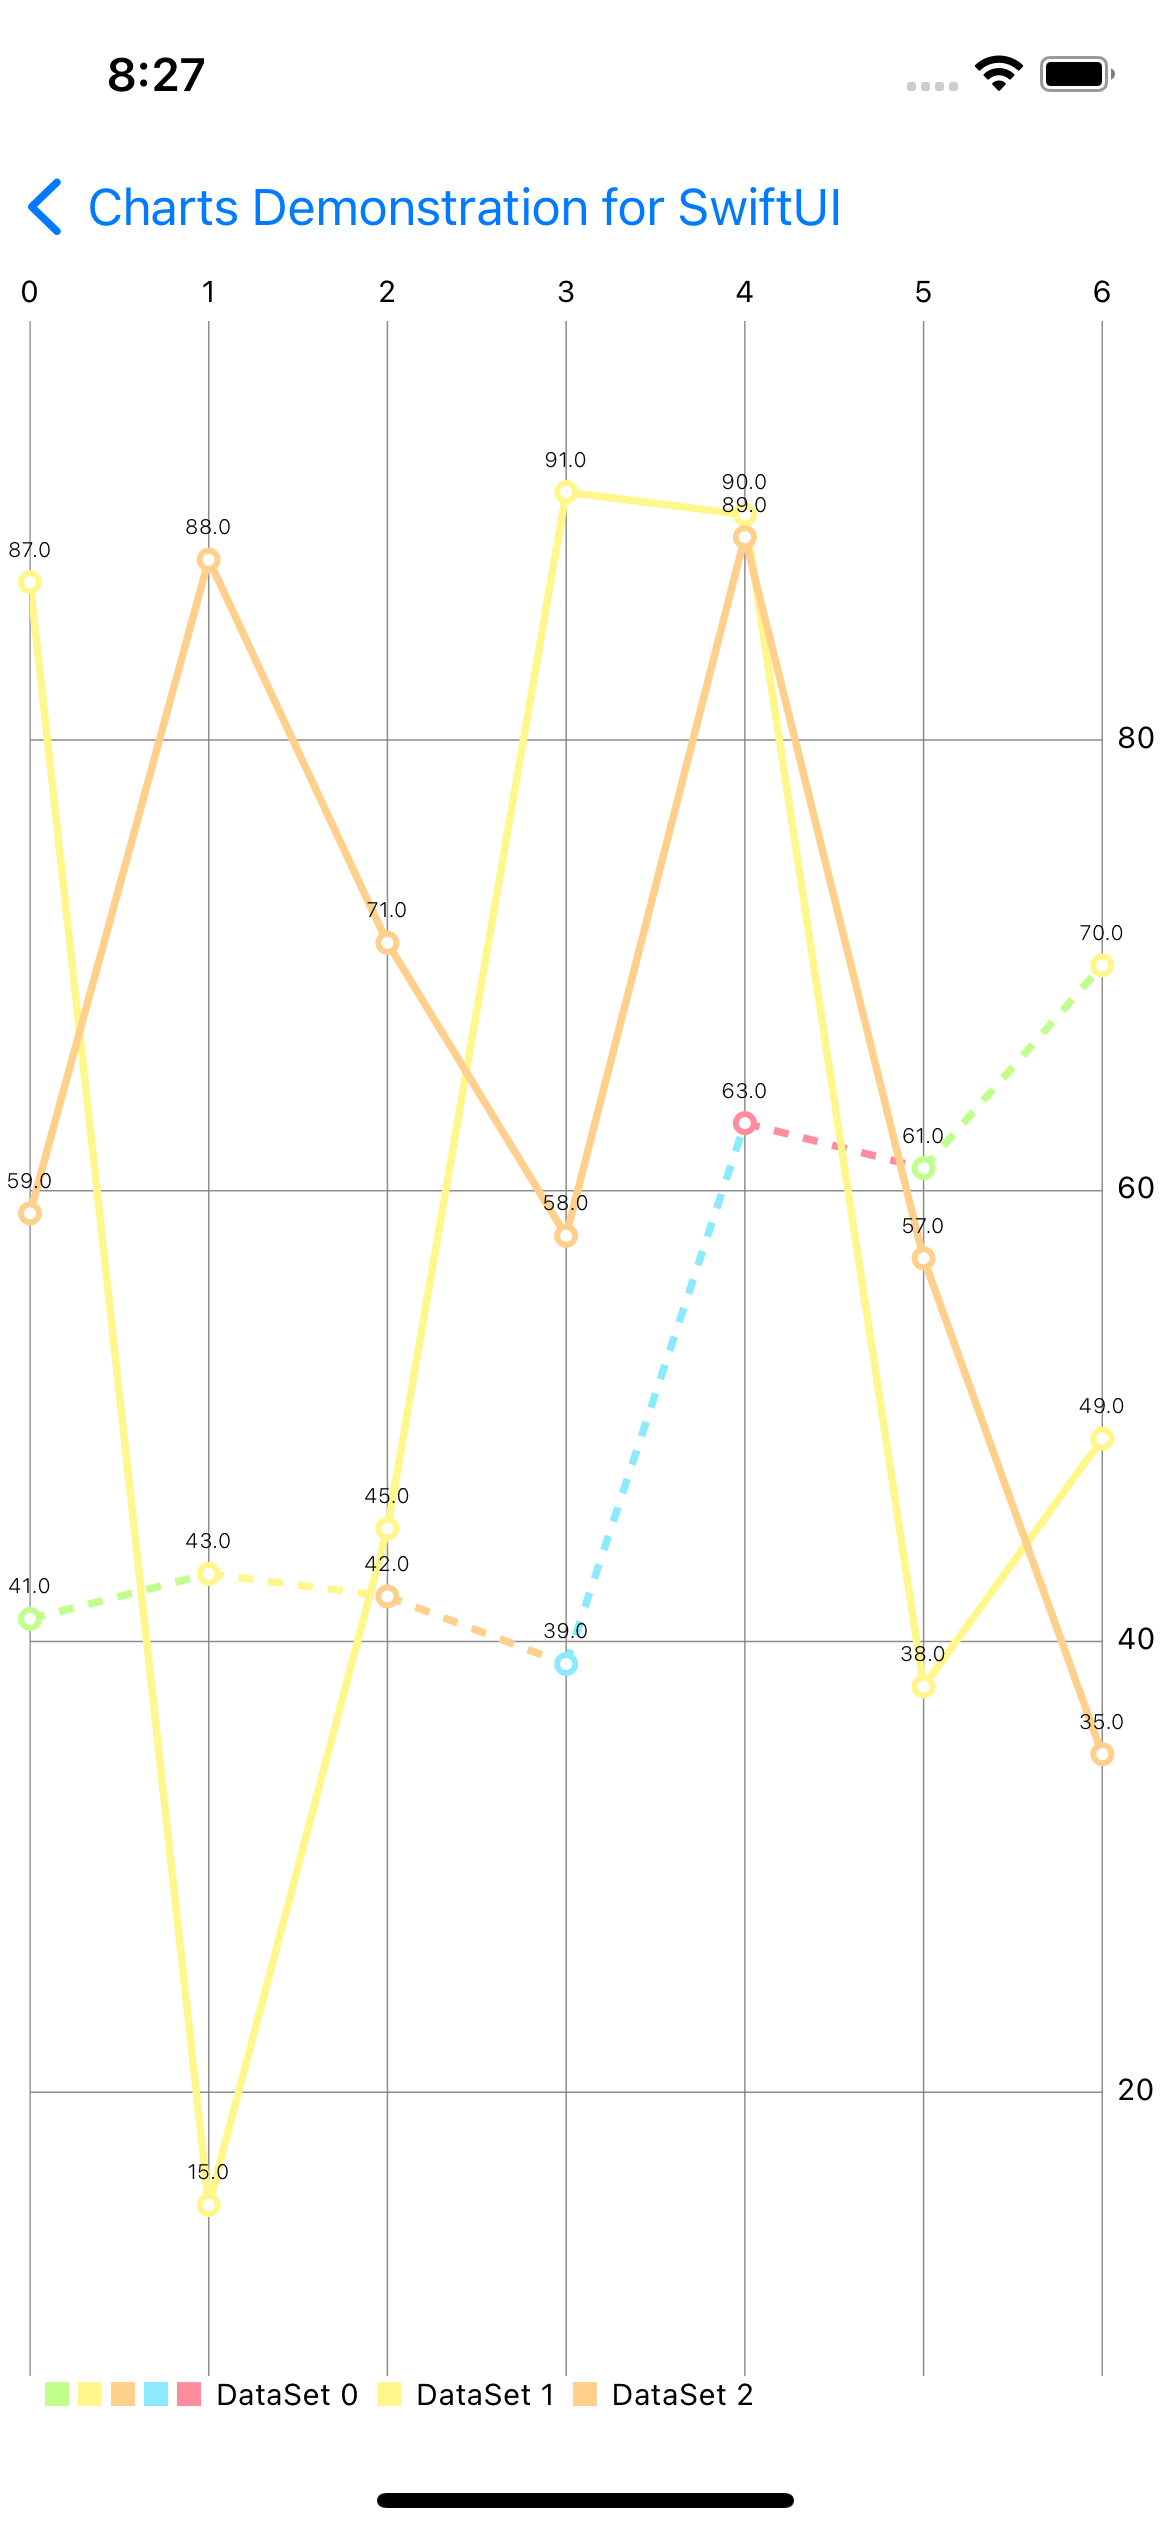
MultipleLinesChart.swift
import SwiftUI
import Charts

struct MultipleLinesChart: UIViewRepresentable {
    func makeUIView(context: Context) -> LineChartView {
        let chartView = LineChartView()

        chartView.chartDescription?.enabled = false

        chartView.leftAxis.enabled = false
        chartView.rightAxis.drawAxisLineEnabled = false
        chartView.xAxis.drawAxisLineEnabled = false

        chartView.drawBordersEnabled = false
        chartView.setScaleEnabled(true)

        let l = chartView.legend
        l.horizontalAlignment = .left
        l.verticalAlignment = .bottom
        l.orientation = .horizontal
        l.drawInside = false

        chartView.data = setDataCount(7, range: 100)

        chartView.animate(xAxisDuration: 2.5)

        return chartView
    }
    func updateUIView(_ uiView: LineChartView, context: Context) {
    }

    func setDataCount(_ count: Int, range: Double) -> LineChartData {
        let colors = ChartColorTemplates.vordiplom()[0...2]

        let block: (Int) -> ChartDataEntry = { (i) -> ChartDataEntry in
            let val = Double(arc4random_uniform(UInt32(range)) + 3)
            return ChartDataEntry(x: Double(i), y: val)
        }
        let dataSets = (0..<3).map { i -> LineChartDataSet in
            let yVals = (0..<count).map(block)
            let set = LineChartDataSet(entries: yVals, label: "DataSet \(i)")
            set.lineWidth = 2.5
            set.circleRadius = 4
            set.circleHoleRadius = 2
            let color = colors[i % colors.count]
            set.setColor(color)
            set.setCircleColor(color)

            return set
        }

        dataSets[0].lineDashLengths = [5, 5]
        dataSets[0].colors = ChartColorTemplates.vordiplom()
        dataSets[0].circleColors = ChartColorTemplates.vordiplom()

        let data = LineChartData(dataSets: dataSets)
        data.setValueFont(.systemFont(ofSize: 7, weight: .light))

        return data
    }
}
Multiple Bars Chart
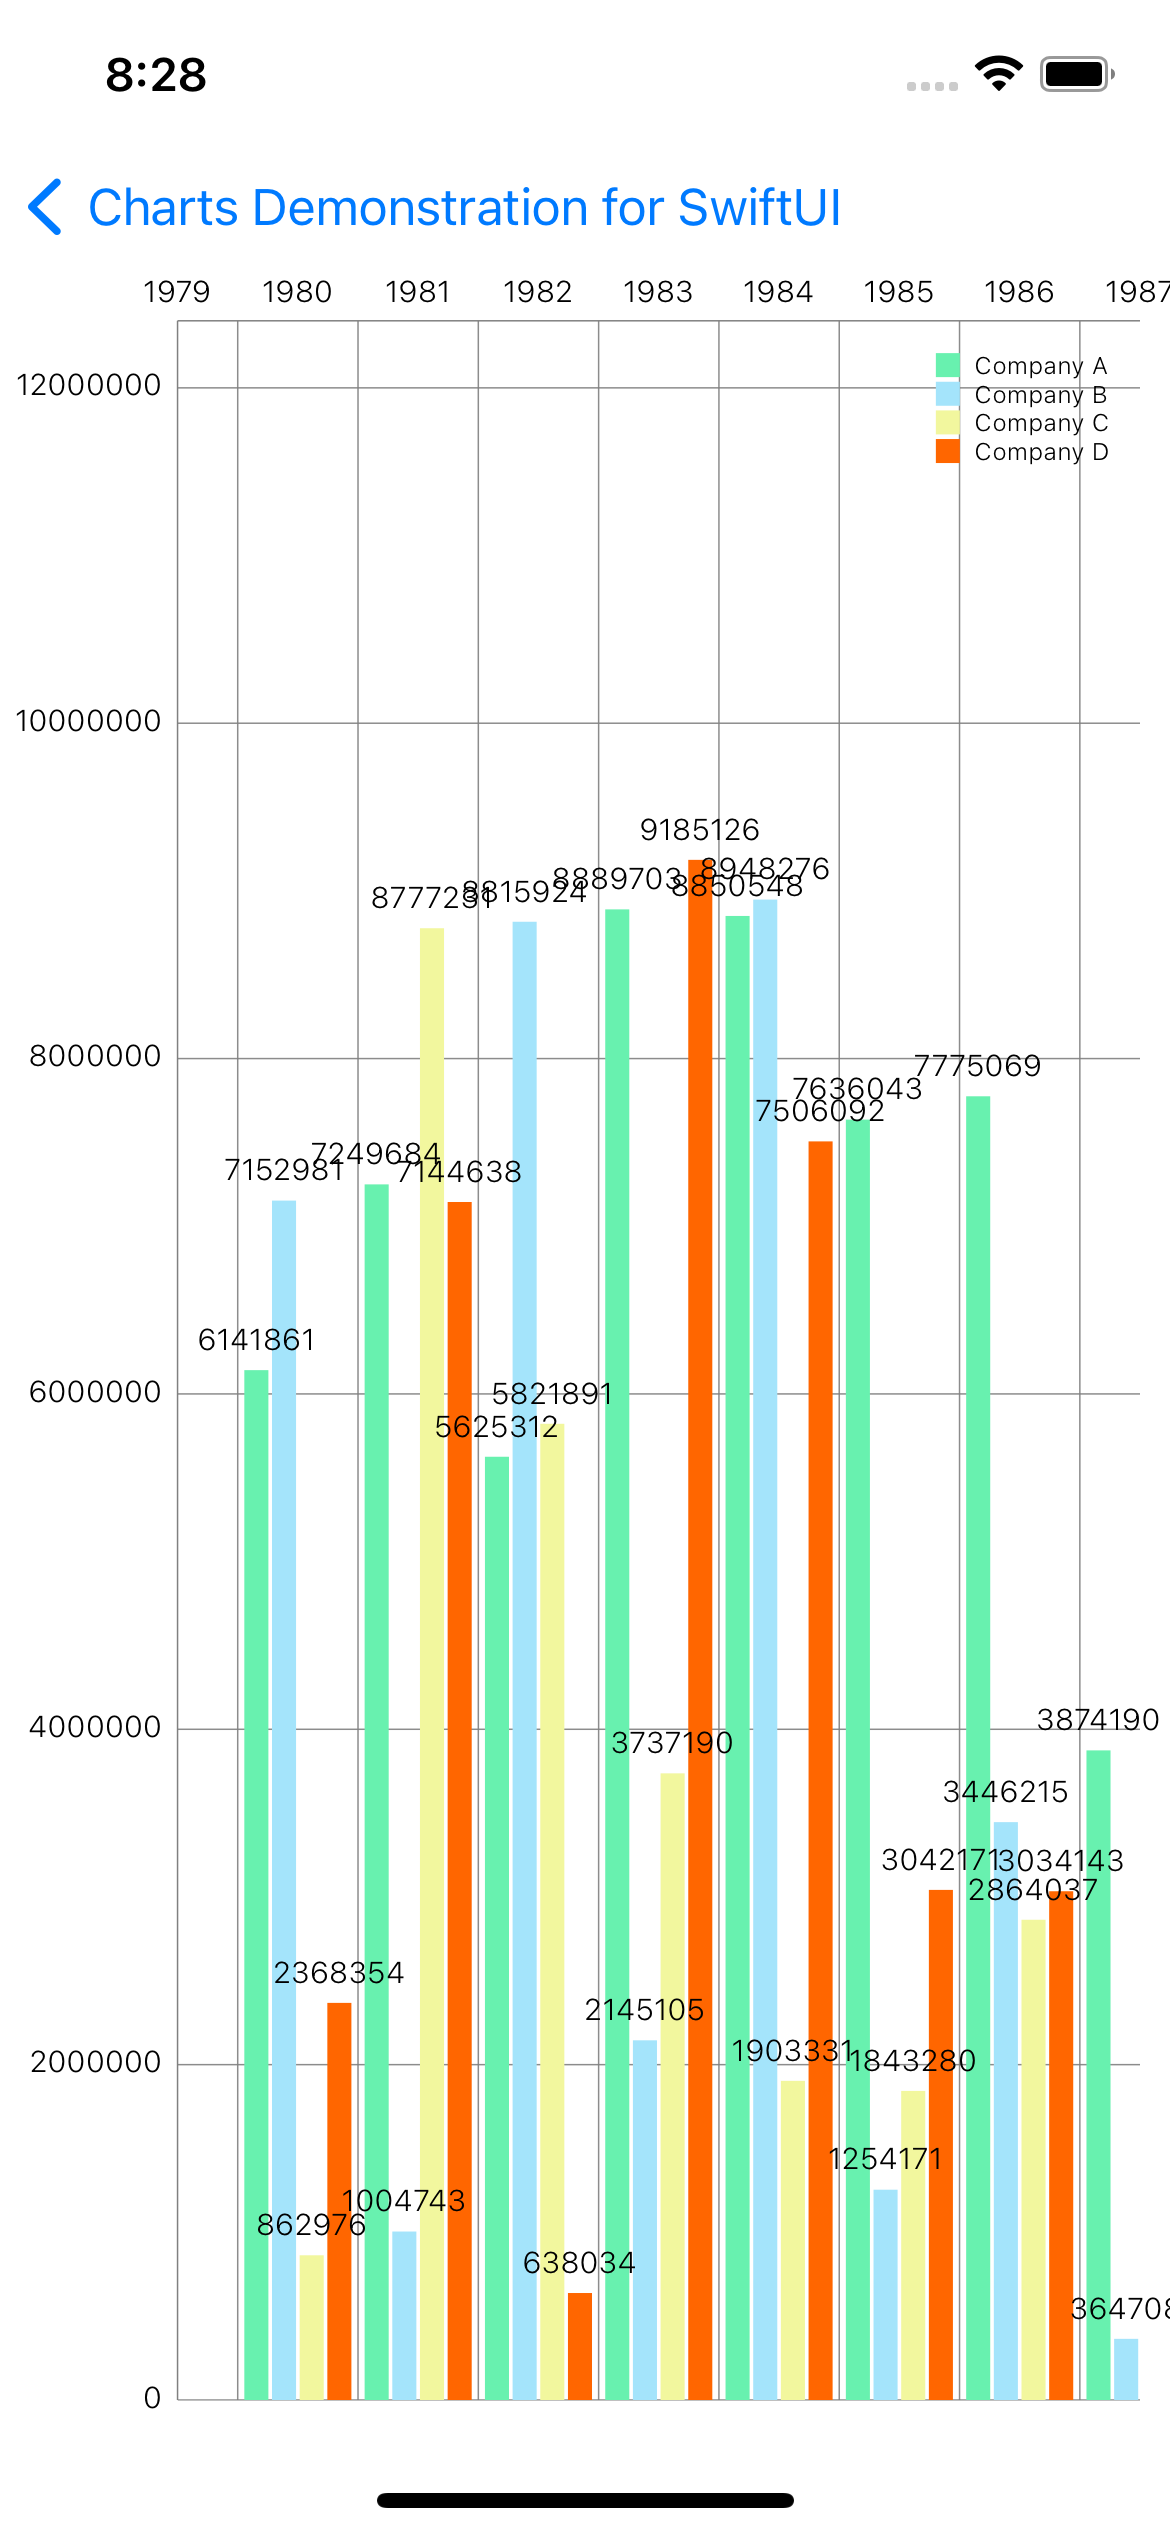
MultipleBarChart.swift
import SwiftUI
import Charts

struct MultipleBarChart: UIViewRepresentable {
    func makeUIView(context: Context) -> BarChartView {
        let chartView = BarChartView()

        chartView.chartDescription?.enabled =  false

        chartView.pinchZoomEnabled = false
        chartView.drawBarShadowEnabled = false

        let l = chartView.legend
        l.horizontalAlignment = .right
        l.verticalAlignment = .top
        l.orientation = .vertical
        l.drawInside = true
        l.font = .systemFont(ofSize: 8, weight: .light)
        l.yOffset = 10
        l.xOffset = 10
        l.yEntrySpace = 0

        let xAxis = chartView.xAxis
        xAxis.labelFont = .systemFont(ofSize: 10, weight: .light)
        xAxis.granularity = 1
        xAxis.centerAxisLabelsEnabled = true

        let leftAxisFormatter = NumberFormatter()
        leftAxisFormatter.maximumFractionDigits = 1

        let leftAxis = chartView.leftAxis
        leftAxis.labelFont = .systemFont(ofSize: 10, weight: .light)
        leftAxis.spaceTop = 0.35
        leftAxis.axisMinimum = 0

        chartView.rightAxis.enabled = false

        chartView.data = setDataCount(7, range: 100)

        chartView.animate(yAxisDuration: 2.5)

        return chartView
    }
    func updateUIView(_ uiView: BarChartView, context: Context) {
    }

    func setDataCount(_ count: Int, range: Double) -> BarChartData {
        let groupSpace = 0.08
        let barSpace = 0.03
        let barWidth = 0.2
        // (0.2 + 0.03) * 4 + 0.08 = 1.00 -> interval per "group"

        let randomMultiplier = range * 100000
        let groupCount = count + 1
        let startYear = 1980
        let endYear = startYear + groupCount

        let block: (Int) -> BarChartDataEntry = { (i) -> BarChartDataEntry in
            return BarChartDataEntry(
                x: Double(i), y: Double(arc4random_uniform(UInt32(randomMultiplier)))
            )
        }
        let yVals1 = (startYear ..< endYear).map(block)
        let yVals2 = (startYear ..< endYear).map(block)
        let yVals3 = (startYear ..< endYear).map(block)
        let yVals4 = (startYear ..< endYear).map(block)

        let set1 = BarChartDataSet(entries: yVals1, label: "Company A")
        set1.setColor(UIColor(red: 104/255, green: 241/255, blue: 175/255, alpha: 1))

        let set2 = BarChartDataSet(entries: yVals2, label: "Company B")
        set2.setColor(UIColor(red: 164/255, green: 228/255, blue: 251/255, alpha: 1))

        let set3 = BarChartDataSet(entries: yVals3, label: "Company C")
        set3.setColor(UIColor(red: 242/255, green: 247/255, blue: 158/255, alpha: 1))

        let set4 = BarChartDataSet(entries: yVals4, label: "Company D")
        set4.setColor(UIColor(red: 255/255, green: 102/255, blue: 0/255, alpha: 1))

        let data: BarChartData = BarChartData(dataSets: [set1, set2, set3, set4])
        data.setValueFont(.systemFont(ofSize: 10, weight: .light))

        // specify the width each bar should have
        data.barWidth = barWidth

        data.groupBars(fromX: Double(startYear), groupSpace: groupSpace, barSpace: barSpace)

        return data
    }
}
Candle Stick Chart
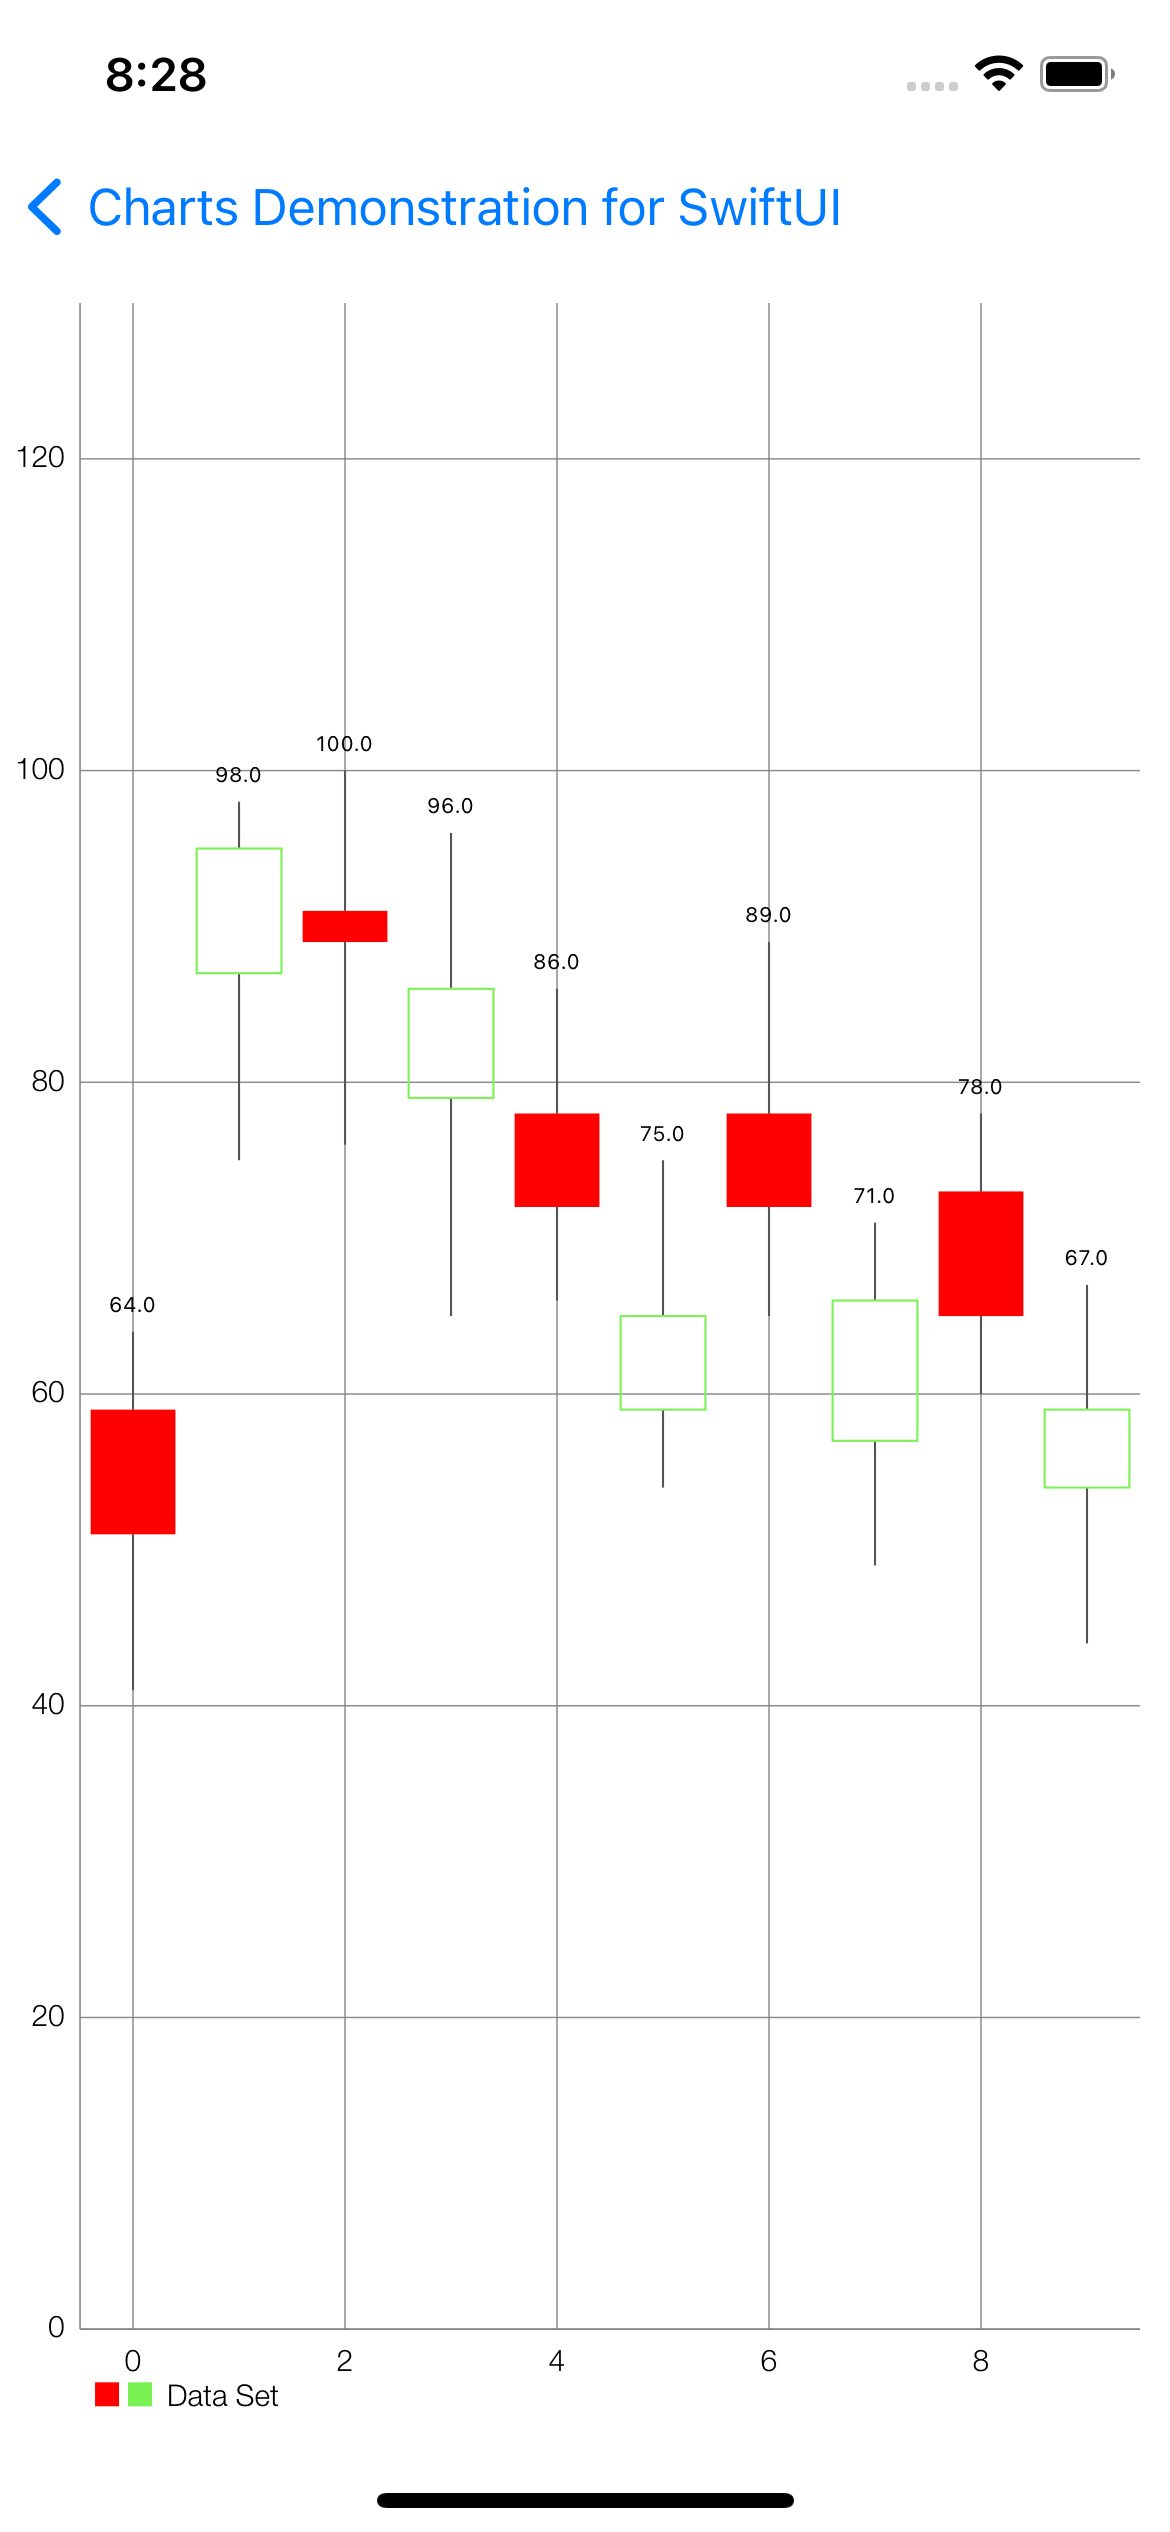
CandleStickChart.swift
import SwiftUI
import Charts

struct CandleStickChart: UIViewRepresentable {
    func makeUIView(context: Context) -> CandleStickChartView {
        let chartView = CandleStickChartView()

        chartView.chartDescription?.enabled = false

        chartView.dragEnabled = false
        chartView.setScaleEnabled(true)
        chartView.maxVisibleCount = 200
        chartView.pinchZoomEnabled = true

        chartView.legend.horizontalAlignment = .right
        chartView.legend.verticalAlignment = .top
        chartView.legend.orientation = .vertical
        chartView.legend.drawInside = false
        chartView.legend.font = UIFont(name: "HelveticaNeue-Light", size: 10)!

        chartView.leftAxis.labelFont = UIFont(name: "HelveticaNeue-Light", size: 10)!
        chartView.leftAxis.spaceTop = 0.3
        chartView.leftAxis.spaceBottom = 0.3
        chartView.leftAxis.axisMinimum = 0

        chartView.rightAxis.enabled = false

        chartView.xAxis.labelPosition = .bottom
        chartView.xAxis.labelFont = UIFont(name: "HelveticaNeue-Light", size: 10)!

        let l = chartView.legend
        l.horizontalAlignment = .left
        l.verticalAlignment = .bottom
        l.orientation = .horizontal
        l.drawInside = false

        chartView.data = setDataCount(10, range: 50)

        return chartView
    }
    func updateUIView(_ uiView: CandleStickChartView, context: Context) {
    }

    func setDataCount(_ count: Int, range: Double) -> CandleChartData {
        let yVals1 = (0..<count).map { (i) -> CandleChartDataEntry in
            let mult = range + 1
            let val = Double(Double(arc4random_uniform(40)) + mult)
            let high = Double(arc4random_uniform(9) + 8)
            let low = Double(arc4random_uniform(9) + 8)
            let open = Double(arc4random_uniform(6) + 1)
            let close = Double(arc4random_uniform(6) + 1)
            let even = i % 2 == 0

            return CandleChartDataEntry(x: Double(i), shadowH: val + high, shadowL: val - low, open: even ? val + open : val - open, close: even ? val - close : val + close, icon: UIImage(named: "icon")!)
        }

        let set1 = CandleChartDataSet(entries: yVals1, label: "Data Set")
        set1.axisDependency = .left
        set1.setColor(UIColor(white: 80/255, alpha: 1))
        set1.drawIconsEnabled = false
        set1.shadowColor = .darkGray
        set1.shadowWidth = 0.7
        set1.decreasingColor = .red
        set1.decreasingFilled = true
        set1.increasingColor = UIColor(red: 122/255, green: 242/255, blue: 84/255, alpha: 1)
        set1.increasingFilled = false
        set1.neutralColor = .blue

        let data = CandleChartData(dataSet: set1)

        return data
    }
}
Cubic Line Chart

CubicLineChart.swift
import SwiftUI
import Charts

struct CubicLineChart: UIViewRepresentable {
    func makeUIView(context: Context) -> LineChartView {
        let chartView = LineChartView()

        chartView.setViewPortOffsets(left: 0, top: 20, right: 0, bottom: 0)
        chartView.backgroundColor = UIColor(red: 30/255, green: 30/255, blue: 30/255, alpha: 1)

        chartView.dragEnabled = true
        chartView.setScaleEnabled(true)
        chartView.pinchZoomEnabled = false
        chartView.maxHighlightDistance = 300

        chartView.xAxis.enabled = false

        let yAxis = chartView.leftAxis
        yAxis.labelFont = UIFont(name: "HelveticaNeue-Light", size:12)!
        yAxis.setLabelCount(6, force: false)
        yAxis.labelTextColor = .white
        yAxis.labelPosition = .insideChart
        yAxis.axisLineColor = .white

        chartView.rightAxis.enabled = false
        chartView.legend.enabled = false

        chartView.data = setDataCount(10, range: 50)

        chartView.animate(xAxisDuration: 2, yAxisDuration: 2)

        return chartView
    }

    func updateUIView(_ uiView: LineChartView, context: Context) {
    }

    func setDataCount(_ count: Int, range: Double) -> ChartData {
        let yVals1 = (0..<count).map { (i) -> ChartDataEntry in
            let mult = range + 1
            let val = Double(arc4random_uniform(UInt32(mult)) + 20)
            return ChartDataEntry(x: Double(i), y: val)
        }

        let set1 = LineChartDataSet(entries: yVals1, label: "DataSet 1")
        set1.mode = .cubicBezier
        set1.drawCirclesEnabled = false
        set1.lineWidth = 1.8
        set1.circleRadius = 4
        set1.setCircleColor(.white)
        set1.highlightColor = UIColor(red: 244/255, green: 117/255, blue: 117/255, alpha: 1)
        set1.fillColor = .white
        set1.fillAlpha = 1
        set1.drawHorizontalHighlightIndicatorEnabled = false

        let data = LineChartData(dataSet: set1)
        data.setValueFont(UIFont(name: "HelveticaNeue-Light", size: 9)!)
        data.setDrawValues(false)

        return data
    }
}
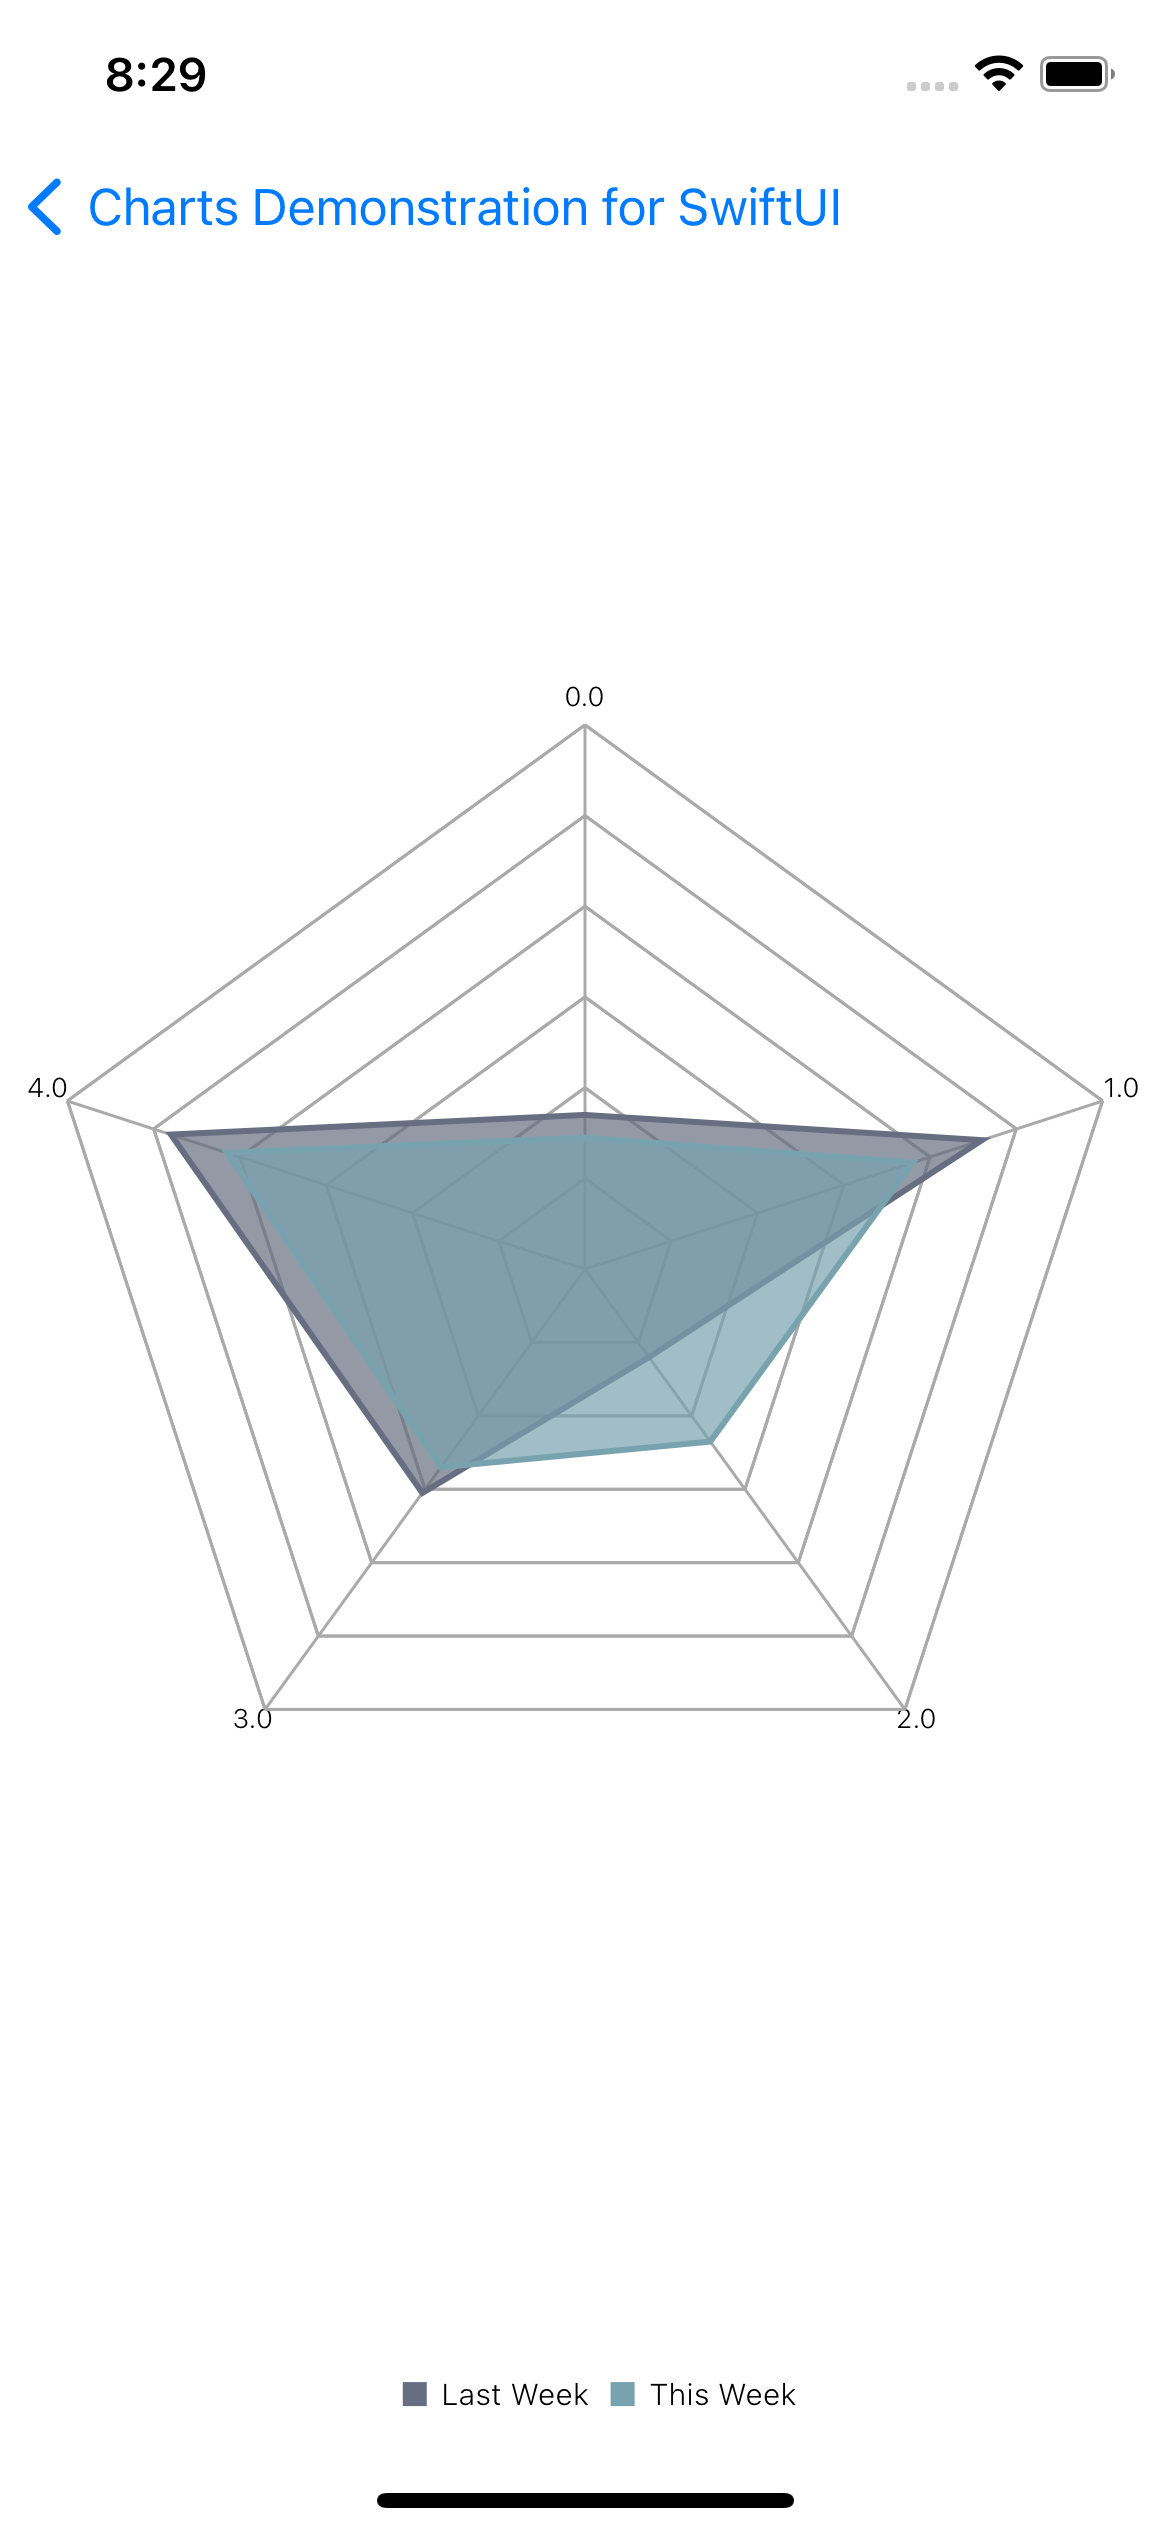
Radar Chart
RadarChart.swift
import SwiftUI
import Charts

struct RadarChart: UIViewRepresentable {
    let activities = ["Burger", "Steak", "Salad", "Pasta", "Pizza"]

    func makeUIView(context: Context) -> RadarChartView {
        let chartView = RadarChartView()

        chartView.chartDescription?.enabled = false
        chartView.webLineWidth = 1
        chartView.innerWebLineWidth = 1
        chartView.webColor = .lightGray
        chartView.innerWebColor = .lightGray
        chartView.webAlpha = 1

        let xAxis = chartView.xAxis
        xAxis.labelFont = .systemFont(ofSize: 9, weight: .light)
        xAxis.xOffset = 0
        xAxis.yOffset = 0

        let yAxis = chartView.yAxis
        yAxis.labelFont = .systemFont(ofSize: 9, weight: .light)
        yAxis.labelCount = 5
        yAxis.axisMinimum = 0
        yAxis.axisMaximum = 80
        yAxis.drawLabelsEnabled = false

        let l = chartView.legend
        l.horizontalAlignment = .center
        l.verticalAlignment = .bottom
        l.orientation = .horizontal
        l.drawInside = false
        l.font = .systemFont(ofSize: 10, weight: .light)
        l.xEntrySpace = 7
        l.yEntrySpace = 5

        chartView.data = setDataCount()

        chartView.animate(xAxisDuration: 1.4, yAxisDuration: 1.4, easingOption: .easeOutBack)

        return chartView
    }

    func updateUIView(_ uiView: RadarChartView, context: Context) {
    }

    func setDataCount() -> ChartData {
        let mult: UInt32 = 80
        let min: UInt32 = 20
        let cnt = 5

        let block: (Int) -> RadarChartDataEntry = { _ in return RadarChartDataEntry(value: Double(arc4random_uniform(mult) + min))}
        let entries1 = (0..<cnt).map(block)
        let entries2 = (0..<cnt).map(block)

        let set1 = RadarChartDataSet(entries: entries1, label: "Last Week")
        set1.setColor(UIColor(red: 103/255, green: 110/255, blue: 129/255, alpha: 1))
        set1.fillColor = UIColor(red: 103/255, green: 110/255, blue: 129/255, alpha: 1)
        set1.drawFilledEnabled = true
        set1.fillAlpha = 0.7
        set1.lineWidth = 2
        set1.drawHighlightCircleEnabled = true
        set1.setDrawHighlightIndicators(false)

        let set2 = RadarChartDataSet(entries: entries2, label: "This Week")
        set2.setColor(UIColor(red: 121/255, green: 162/255, blue: 175/255, alpha: 1))
        set2.fillColor = UIColor(red: 121/255, green: 162/255, blue: 175/255, alpha: 1)
        set2.drawFilledEnabled = true
        set2.fillAlpha = 0.7
        set2.lineWidth = 2
        set2.drawHighlightCircleEnabled = true
        set2.setDrawHighlightIndicators(false)

        let data: RadarChartData = RadarChartData(dataSets: [set1, set2])
        data.setValueFont(.systemFont(ofSize: 8, weight: .light))
        data.setDrawValues(false)

        return data
    }
}
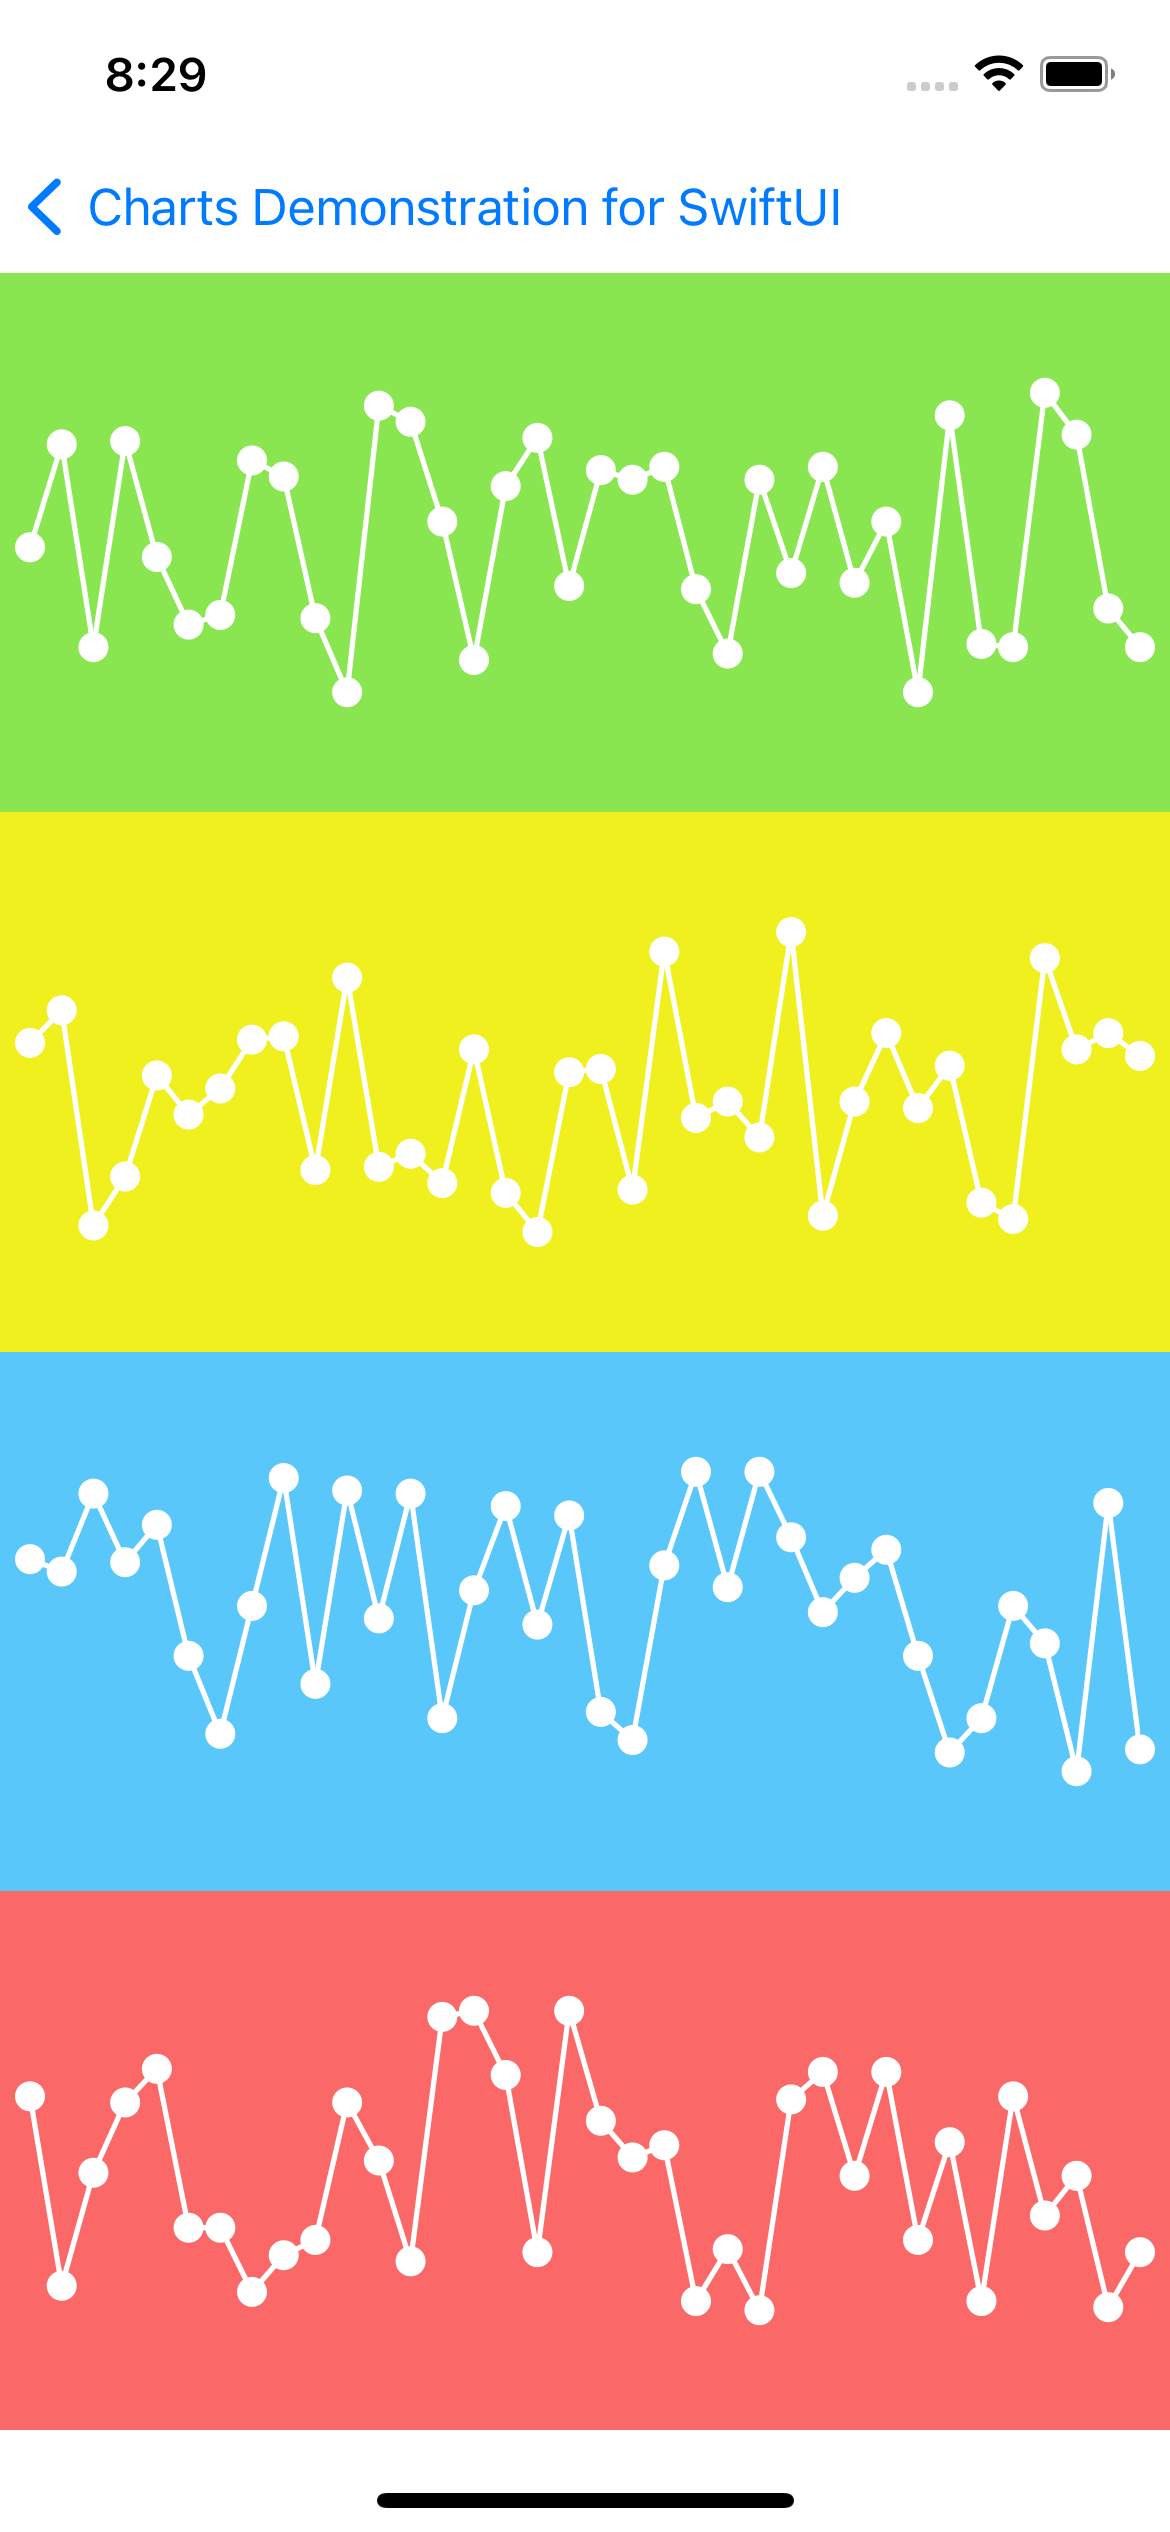
Colored Line Chart
ColoredLineChart.swift
import SwiftUI
import Charts

struct ColoredLineChart: UIViewRepresentable {
    var color: UIColor
    func makeUIView(context: Context) -> LineChartView {
        let chartViews = LineChartView()

        chartViews.backgroundColor = color

        chartViews.chartDescription?.enabled = false

        chartViews.dragEnabled = true
        chartViews.setScaleEnabled(true)
        chartViews.pinchZoomEnabled = false
        chartViews.setViewPortOffsets(left: 10, top: 0, right: 10, bottom: 0)

        chartViews.legend.enabled = false

        chartViews.leftAxis.enabled = false
        chartViews.leftAxis.spaceTop = 0.4
        chartViews.leftAxis.spaceBottom = 0.4
        chartViews.rightAxis.enabled = false
        chartViews.xAxis.enabled = false

        let data = setDataCount(36, range: 100)
        data.setValueFont(UIFont(name: "HelveticaNeue", size: 7)!)

        chartViews.data = data

        chartViews.animate(xAxisDuration: 2.5)

        return chartViews
    }

    func updateUIView(_ uiView: LineChartView, context: Context) {
    }

    func setDataCount(_ count: Int, range: UInt32) -> LineChartData {
        let yVals = (0..<count).map { i -> ChartDataEntry in
            let val = Double(arc4random_uniform(range)) + 3
            return ChartDataEntry(x: Double(i), y: val)
        }

        let set1 = LineChartDataSet(entries: yVals, label: "DataSet 1")

        set1.lineWidth = 1.75
        set1.circleRadius = 5.0
        set1.circleHoleRadius = 2.5
        set1.setColor(.white)
        set1.setCircleColor(.white)
        set1.highlightColor = .white
        set1.drawValuesEnabled = false

        return LineChartData(dataSet: set1)
    }
}
Sinus Bar Chart

SinusBarChart.swift
import SwiftUI
import Charts

struct SinusBarChart: UIViewRepresentable {
    func makeUIView(context: Context) -> BarChartView {
        let chartView = BarChartView()

        chartView.chartDescription?.enabled = false

        chartView.drawBarShadowEnabled = false
        chartView.drawValueAboveBarEnabled = false
        chartView.maxVisibleCount = 60

        let xAxis = chartView.xAxis
        xAxis.labelPosition = .bottom
        xAxis.enabled = false

        let leftAxis = chartView.leftAxis
        leftAxis.labelCount = 6
        leftAxis.axisMinimum = -2.5
        leftAxis.axisMaximum = 2.5
        leftAxis.granularityEnabled = true
        leftAxis.granularity = 0.1

        let rightAxis = chartView.rightAxis
        rightAxis.labelCount = 6
        rightAxis.axisMinimum = -2.5
        rightAxis.axisMaximum = 2.5
        rightAxis.granularity = 0.1

        let l = chartView.legend
        l.horizontalAlignment = .left
        l.verticalAlignment = .bottom
        l.orientation = .horizontal
        l.drawInside = false
        l.form = .square
        l.formSize = 9
        l.font = .systemFont(ofSize: 11)
        l.xEntrySpace = 4

        chartView.data = setDataCount(150)

        chartView.animate(xAxisDuration: 2, yAxisDuration: 2)

        return chartView
    }

    func updateUIView(_ uiView: BarChartView, context: Context) {
    }

    func setDataCount(_ count: Int) -> BarChartData {
        let entries = (0..<count).map {
            BarChartDataEntry(x: Double($0), y: sin(.pi * Double($0%128) / 64))
        }

        let set = BarChartDataSet(entries: entries, label: "Sinus Function")
        set.setColor(UIColor(red: 240/255, green: 120/255, blue: 123/255, alpha: 1))

        let data = BarChartData(dataSet: set)
        data.setValueFont(.systemFont(ofSize: 10, weight: .light))
        data.setDrawValues(false)
        data.barWidth = 0.8

        return data
    }
}
BarChart positive / negative

PositiveNegativeBarChart.swift
import SwiftUI
import Charts

struct PositiveNegativeBarChart: UIViewRepresentable {
    func makeUIView(context: Context) -> BarChartView {
        let chartView = BarChartView()

        chartView.setExtraOffsets(left: 70, top: -30, right: 70, bottom: 10)

        chartView.drawBarShadowEnabled = false
        chartView.drawValueAboveBarEnabled = true

        chartView.chartDescription?.enabled = false

        chartView.rightAxis.enabled = false

        let xAxis = chartView.xAxis
        xAxis.labelPosition = .bottom
        xAxis.labelFont = .systemFont(ofSize: 13)
        xAxis.drawAxisLineEnabled = false
        xAxis.labelTextColor = .lightGray
        xAxis.labelCount = 5
        xAxis.centerAxisLabelsEnabled = true
        xAxis.granularity = 1

        let leftAxis = chartView.leftAxis
        leftAxis.drawLabelsEnabled = false
        leftAxis.spaceTop = 0.25
        leftAxis.spaceBottom = 0.25
        leftAxis.drawAxisLineEnabled = false
        leftAxis.drawZeroLineEnabled = true
        leftAxis.zeroLineColor = .gray
        leftAxis.zeroLineWidth = 0.7

        chartView.data = setDataCount()

        chartView.animate(yAxisDuration: 2.5)

        return chartView
    }

    func updateUIView(_ uiView: BarChartView, context: Context) {
    }

    func setDataCount() -> BarChartData {
        let yVals = [
            BarChartDataEntry(x: 0, y: -224.1),
            BarChartDataEntry(x: 1, y: 238.5),
            BarChartDataEntry(x: 2, y: 1280.1),
            BarChartDataEntry(x: 3, y: -442.3),
            BarChartDataEntry(x: 4, y: -2280.1)
        ]

        let red = UIColor(red: 211/255, green: 74/255, blue: 88/255, alpha: 1)
        let green = UIColor(red: 110/255, green: 190/255, blue: 102/255, alpha: 1)
        let colors = yVals.map { (entry) -> NSUIColor in
            return entry.y > 0 ? red : green
        }

        let set = BarChartDataSet(entries: yVals, label: "Values")
        set.colors = colors
        set.valueColors = colors

        let data = BarChartData(dataSet: set)
        data.setValueFont(.systemFont(ofSize: 13))

        let formatter = NumberFormatter()
        formatter.maximumFractionDigits = 1
        data.setValueFormatter(DefaultValueFormatter(formatter: formatter))
        data.barWidth = 0.8

        return data
    }
}
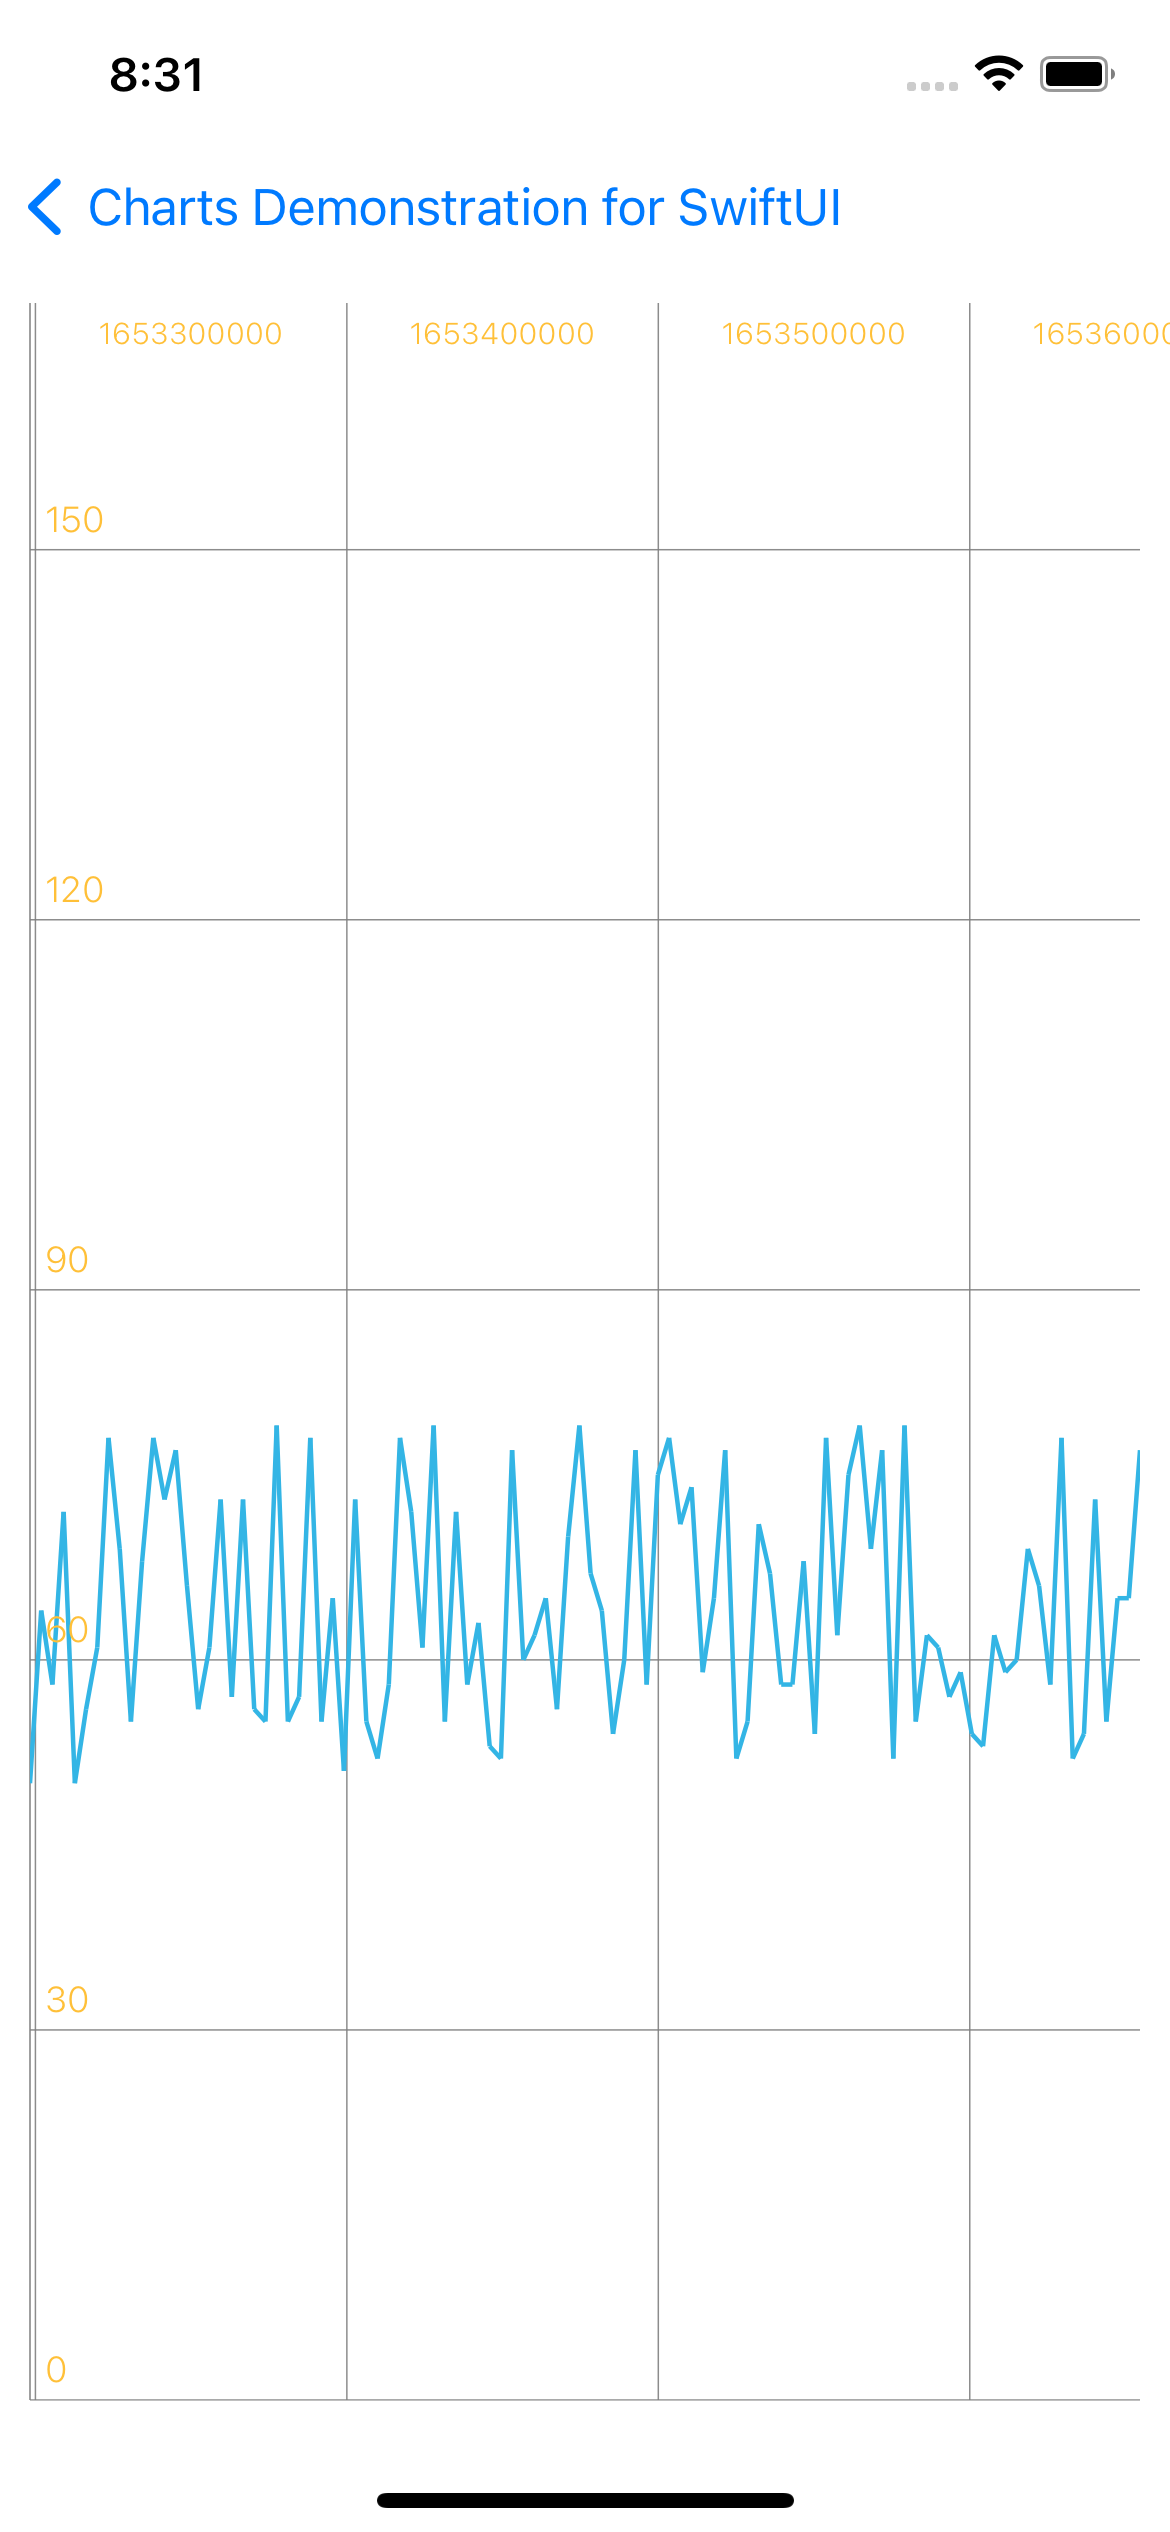
Time Line Chart
LineChartTime.swift
import SwiftUI
import Charts

struct LineChartTime: UIViewRepresentable {
    func makeUIView(context: Context) -> LineChartView {
        let chartView = LineChartView()

        chartView.chartDescription?.enabled = false

        chartView.dragEnabled = true
        chartView.setScaleEnabled(true)
        chartView.pinchZoomEnabled = false
        chartView.highlightPerDragEnabled = true

        chartView.backgroundColor = .white

        chartView.legend.enabled = false

        let xAxis = chartView.xAxis
        xAxis.labelPosition = .topInside
        xAxis.labelFont = .systemFont(ofSize: 10, weight: .light)
        xAxis.labelTextColor = UIColor(red: 255/255, green: 192/255, blue: 56/255, alpha: 1)
        xAxis.drawAxisLineEnabled = false
        xAxis.drawGridLinesEnabled = true
        xAxis.centerAxisLabelsEnabled = true
        xAxis.granularity = 3600

        let leftAxis = chartView.leftAxis
        leftAxis.labelPosition = .insideChart
        leftAxis.labelFont = .systemFont(ofSize: 12, weight: .light)
        leftAxis.drawGridLinesEnabled = true
        leftAxis.granularityEnabled = true
        leftAxis.axisMinimum = 0
        leftAxis.axisMaximum = 170
        leftAxis.yOffset = -9
        leftAxis.labelTextColor = UIColor(red: 255/255, green: 192/255, blue: 56/255, alpha: 1)


        chartView.rightAxis.enabled = false

        chartView.legend.form = .line

        chartView.data = setDataCount(100, range: 30)

        chartView.animate(xAxisDuration: 2.5)

        return chartView
    }

    func updateUIView(_ uiView: LineChartView, context: Context) {
    }

    func setDataCount(_ count: Int, range: UInt32) -> LineChartData {
        let now = Date().timeIntervalSince1970
        let hourSeconds: TimeInterval = 3600

        let from = now - (Double(count) / 2) * hourSeconds
        let to = now + (Double(count) / 2) * hourSeconds

        let values = stride(from: from, to: to, by: hourSeconds).map { (x) -> ChartDataEntry in
            let y = arc4random_uniform(range) + 50
            return ChartDataEntry(x: x, y: Double(y))
        }

        let set1 = LineChartDataSet(entries: values, label: "DataSet 1")
        set1.axisDependency = .left
        set1.setColor(UIColor(red: 51/255, green: 181/255, blue: 229/255, alpha: 1))
        set1.lineWidth = 1.5
        set1.drawCirclesEnabled = false
        set1.drawValuesEnabled = false
        set1.fillAlpha = 0.26
        set1.fillColor = UIColor(red: 51/255, green: 181/255, blue: 229/255, alpha: 1)
        set1.highlightColor = UIColor(red: 244/255, green: 117/255, blue: 117/255, alpha: 1)
        set1.drawCircleHoleEnabled = false

        let data = LineChartData(dataSet: set1)
        data.setValueTextColor(.white)
        data.setValueFont(.systemFont(ofSize: 9, weight: .light))

        return data
    }
}
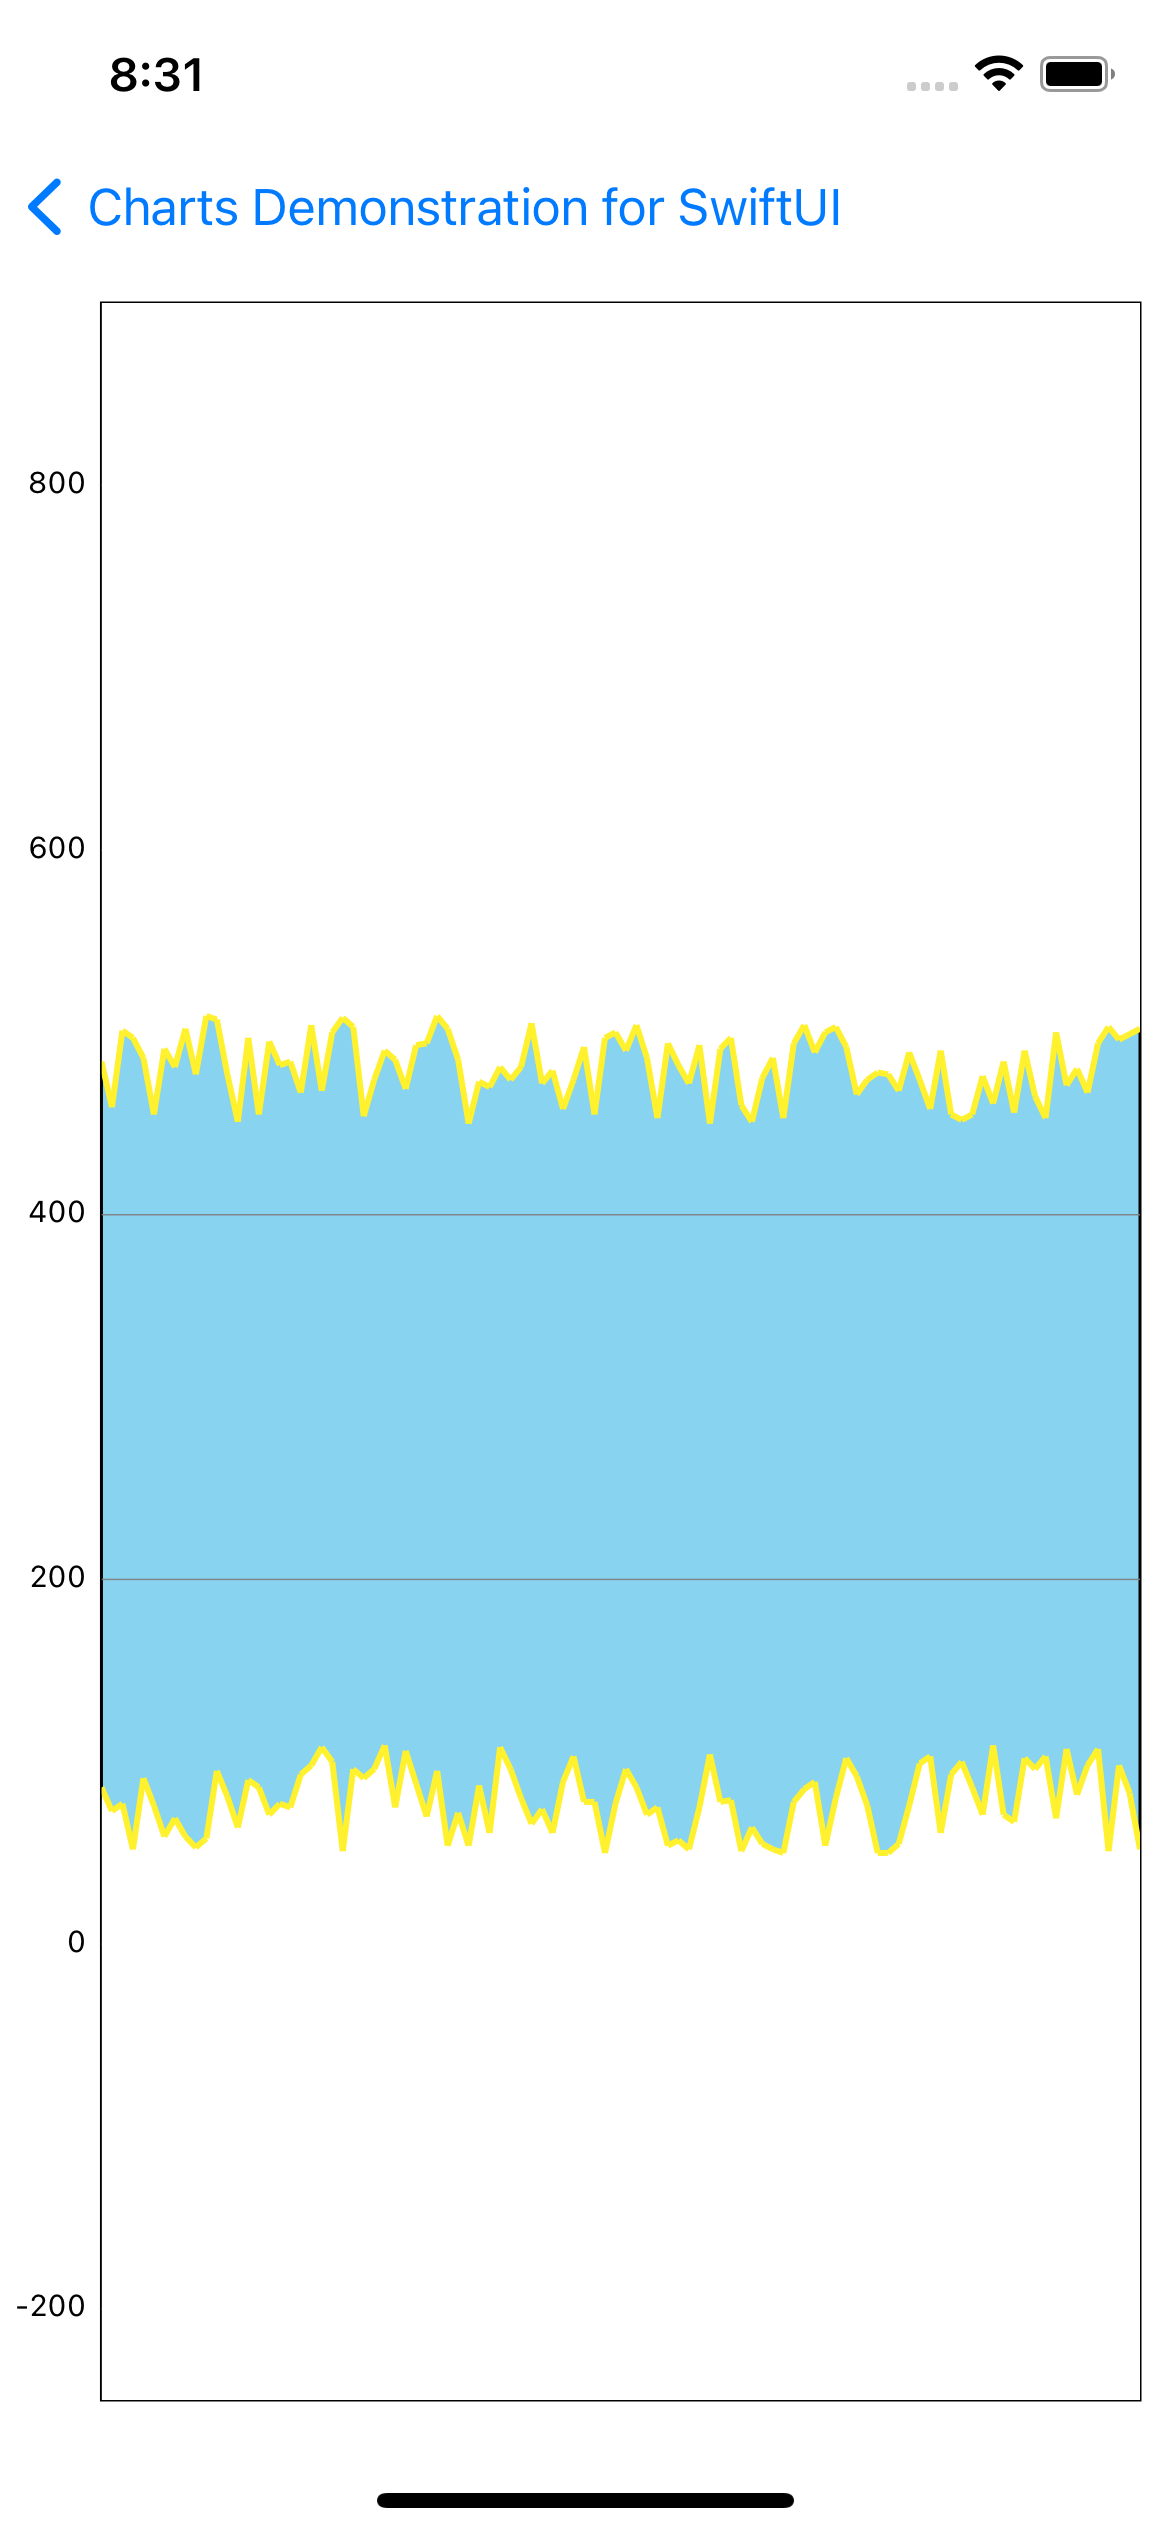
Filled Line Chart
LineChartFilled.swift
import SwiftUI
import Charts

struct LineChartFilled: UIViewRepresentable {
    func makeUIView(context: Context) -> LineChartView {
        let chartView = LineChartView()

        chartView.backgroundColor = .white
        chartView.gridBackgroundColor = UIColor(red: 51/255, green: 181/255, blue: 229/255, alpha: 150/255)
        chartView.drawGridBackgroundEnabled = true

        chartView.drawBordersEnabled = true

        chartView.chartDescription?.enabled = false

        chartView.pinchZoomEnabled = false
        chartView.dragEnabled = true
        chartView.setScaleEnabled(true)

        chartView.legend.enabled = false

        chartView.xAxis.enabled = false

        let leftAxis = chartView.leftAxis
        leftAxis.axisMaximum = 900
        leftAxis.axisMinimum = -250
        leftAxis.drawAxisLineEnabled = false

        chartView.rightAxis.enabled = false

        chartView.data = setDataCount(100, range: 60, chartView: chartView)

        return chartView
    }

    func updateUIView(_ uiView: LineChartView, context: Context) {
    }

    func setDataCount(_ count: Int, range: UInt32, chartView: LineChartView) -> LineChartData {
        let yVals1 = (0..<count).map { (i) -> ChartDataEntry in
            let val = Double(arc4random_uniform(range) + 50)
            return ChartDataEntry(x: Double(i), y: val)
        }
        let yVals2 = (0..<count).map { (i) -> ChartDataEntry in
            let val = Double(arc4random_uniform(range) + 450)
            return ChartDataEntry(x: Double(i), y: val)
        }

        let set1 = LineChartDataSet(entries: yVals1, label: "DataSet 1")
        set1.axisDependency = .left
        set1.setColor(UIColor(red: 255/255, green: 241/255, blue: 46/255, alpha: 1))
        set1.drawCirclesEnabled = false
        set1.lineWidth = 2
        set1.circleRadius = 3
        set1.fillAlpha = 1
        set1.drawFilledEnabled = true
        set1.fillColor = .white
        set1.highlightColor = UIColor(red: 244/255, green: 117/255, blue: 117/255, alpha: 1)
        set1.drawCircleHoleEnabled = false
        set1.fillFormatter = DefaultFillFormatter { _,_  -> CGFloat in
            return CGFloat(chartView.leftAxis.axisMinimum)
        }

        let set2 = LineChartDataSet(entries: yVals2, label: "DataSet 2")
        set2.axisDependency = .left
        set2.setColor(UIColor(red: 255/255, green: 241/255, blue: 46/255, alpha: 1))
        set2.drawCirclesEnabled = false
        set2.lineWidth = 2
        set2.circleRadius = 3
        set2.fillAlpha = 1
        set2.drawFilledEnabled = true
        set2.fillColor = .white
        set2.highlightColor = UIColor(red: 244/255, green: 117/255, blue: 117/255, alpha: 1)
        set2.drawCircleHoleEnabled = false
        set2.fillFormatter = DefaultFillFormatter { _,_  -> CGFloat in
            return CGFloat(chartView.leftAxis.axisMaximum)
        }

        let data: LineChartData = LineChartData(dataSets: [set1, set2])
        data.setDrawValues(false)

        return data
    }
}
Half Pie Chart

HalfPieChart.swift
import SwiftUI
import Charts

private let parties = [
    "Party A", "Party B", "Party C", "Party D", "Party E", "Party F",
    "Party G", "Party H", "Party I", "Party J", "Party K", "Party L",
    "Party M", "Party N", "Party O", "Party P", "Party Q", "Party R",
    "Party S", "Party T", "Party U", "Party V", "Party W", "Party X",
    "Party Y", "Party Z"
]

struct HalfPieChart: UIViewRepresentable {
    func makeUIView(context: Context) -> PieChartView {
        let chartView = PieChartView()

        chartView.holeColor = .white
        chartView.transparentCircleColor = NSUIColor.white.withAlphaComponent(0.43)
        chartView.holeRadiusPercent = 0.58
        chartView.rotationEnabled = false
        chartView.highlightPerTapEnabled = true

        chartView.maxAngle = 180 // Half chart
        chartView.rotationAngle = 180 // Rotate to make the half on the upper side
        chartView.centerTextOffset = CGPoint(x: 0, y: -20)

        let l = chartView.legend
        l.horizontalAlignment = .center
        l.verticalAlignment = .top
        l.orientation = .horizontal
        l.drawInside = false
        l.xEntrySpace = 7
        l.yEntrySpace = 0
        l.yOffset = 0

        chartView.holeColor = .clear
        chartView.entryLabelColor = .white
        chartView.entryLabelFont = UIFont(name:"HelveticaNeue-Light", size:12)!

        chartView.data = setDataCount(4, range: 100)

        chartView.animate(xAxisDuration: 1.4, easingOption: .easeOutBack)

        return chartView
    }

    func updateUIView(_ uiView: PieChartView, context: Context) {
    }

    func setDataCount(_ count: Int, range: UInt32) -> PieChartData {
        let entries = (0..<count).map { (i) -> PieChartDataEntry in
            // IMPORTANT: In a PieChart, no values (Entry) should have the same xIndex (even if from different DataSets), since no values can be drawn above each other.
            return PieChartDataEntry(value: Double(arc4random_uniform(range) + range / 5),
                                     label: parties[i % parties.count])
        }

        let set = PieChartDataSet(entries: entries, label: "Election Results")
        set.sliceSpace = 3
        set.selectionShift = 5
        set.colors = ChartColorTemplates.material()

        let data = PieChartData(dataSet: set)

        let pFormatter = NumberFormatter()
        pFormatter.numberStyle = .percent
        pFormatter.maximumFractionDigits = 1
        pFormatter.multiplier = 1
        pFormatter.percentSymbol = " %"
        data.setValueFormatter(DefaultValueFormatter(formatter: pFormatter))

        data.setValueFont(UIFont(name: "HelveticaNeue-Light", size: 11)!)
        data.setValueTextColor(.white)

        return data
    }
}
おわり
デモの完成形を置いときます