グラフ(折れ線グラフ、棒グラフ、レーダチャートなど)を書くのに優れているrubyライブラリを学習しましたので、記録のために残します。
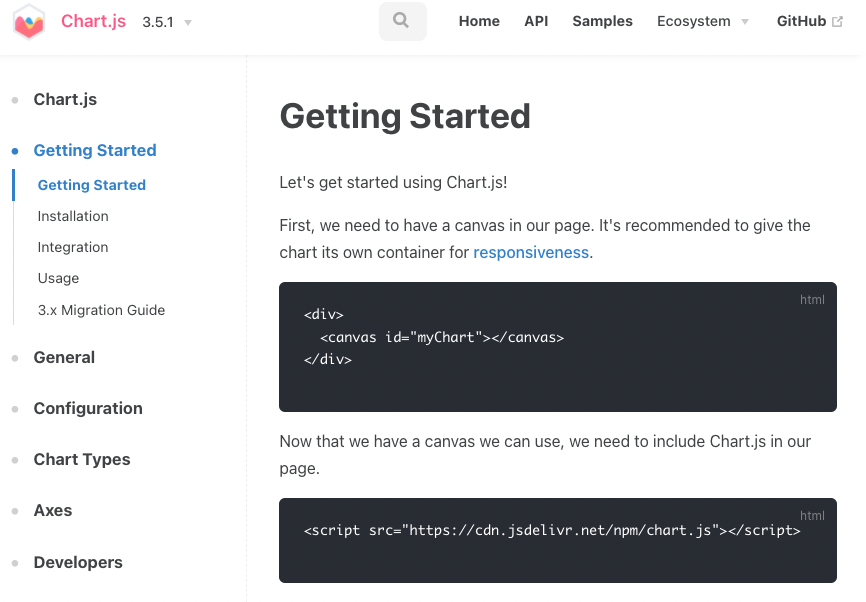
公式ドキュメント
使い方
① rails newしてアプリ作成
% rails new chart
まず学習用のファイルを作成します。
② controllerとroutesの設定
コントローラーを作成します。
% rails g controller home
続いてコントローラーにindexメソッドを作成します。
class HomeController < ApplicationController
 def index  # 追記
 end
end
コントローラーの記述が終わったらルーティングを作成します。
Rails.application.routes.draw do
 root 'home#index'  # 追記
end
これで完了です。
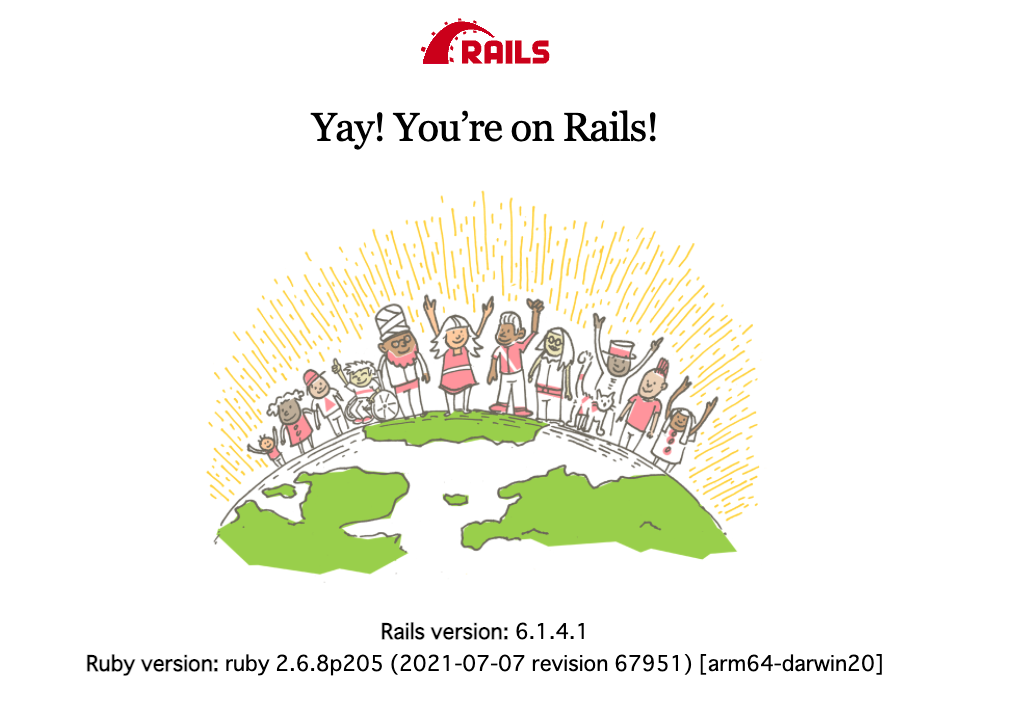
サーバーを動かしてここまでの記述がうまくいっているか確認します。
% rails s
下準備は完了したので、これから本題に入ります。
③ chart.jsのインストール
Chart.js をインストールします。
% npm install chart.js
他にもインストール方法はあります。
→https://www.chartjs.org/docs/latest/getting-started/installation.html
④ グラフの情報を記述
<canvas id="myChart"></canvas>
<script src="https://cdn.jsdelivr.net/npm/chart.js"></script>
<script>
var ctx = document.getElementById('myChart');
var myChart = new Chart(ctx, {
    type: 'bar',
    data: {
        labels: ['Red', 'Blue', 'Yellow', 'Green', 'Purple', 'Orange'],
        datasets: [{
            label: '# of Votes',
            data: [12, 19, 3, 5, 2, 3],
            backgroundColor: [
                'rgba(255, 99, 132, 0.2)',
                'rgba(54, 162, 235, 0.2)',
                'rgba(255, 206, 86, 0.2)',
                'rgba(75, 192, 192, 0.2)',
                'rgba(153, 102, 255, 0.2)',
                'rgba(255, 159, 64, 0.2)'
            ],
            borderColor: [
                'rgba(255, 99, 132, 1)',
                'rgba(54, 162, 235, 1)',
                'rgba(255, 206, 86, 1)',
                'rgba(75, 192, 192, 1)',
                'rgba(153, 102, 255, 1)',
                'rgba(255, 159, 64, 1)'
            ],
            borderWidth: 1
        }]
    },
    options: {
        scales: {
            y: {
                beginAtZero: true
            }
        }
    }
});
</script>
これで、chart.jsの記述は終了です。
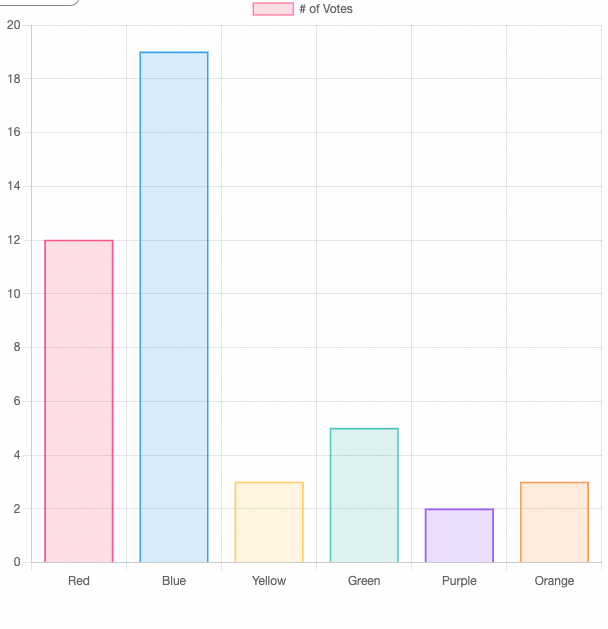
サーバーを動かしてみます。
% rails s
ちゃんと反映されていました。成功です!!
グラフの記述に関してはこの後解説します。
④の解説
以下の記述を1つ1つ見ていきます。
<canvas id="myChart"></canvas>
<script src="https://cdn.jsdelivr.net/npm/chart.js"></script>
<script>
var ctx = document.getElementById('myChart');
var myChart = new Chart(ctx, {
    type: 'bar',
    data: {
        labels: ['Red', 'Blue', 'Yellow', 'Green', 'Purple', 'Orange'],
        datasets: [{
            label: '# of Votes',
            data: [12, 19, 3, 5, 2, 3],
            backgroundColor: [
                'rgba(255, 99, 132, 0.2)',
                'rgba(54, 162, 235, 0.2)',
                'rgba(255, 206, 86, 0.2)',
                'rgba(75, 192, 192, 0.2)',
                'rgba(153, 102, 255, 0.2)',
                'rgba(255, 159, 64, 0.2)'
            ],
            borderColor: [
                'rgba(255, 99, 132, 1)',
                'rgba(54, 162, 235, 1)',
                'rgba(255, 206, 86, 1)',
                'rgba(75, 192, 192, 1)',
                'rgba(153, 102, 255, 1)',
                'rgba(255, 159, 64, 1)'
            ],
            borderWidth: 1
        }]
    },
    options: {
        scales: {
            y: {
                beginAtZero: true
            }
        }
    }
});
</script>
まずは下記の2行からです。
グラフ描画エリア設定・Chart.js読み込み
<canvas id="myChart"></canvas>
<script src="https://cdn.jsdelivr.net/npm/chart.js"></script>
この2行は公式ドキュメントの通りにそのまま記載します。
1行目では、chart.jsはグラフ描画エリアの指定に、canvas要素を使用します。
2行目では、Chart.jsを使用するために、CDNに公開されているjsファイルを読み込みます。
canvas要素取得
3行目では、先ほど設定した、canvas要素(ID : myChart ) を取得し、変数 ctx に入力します。
var ctx = document.getElementById('myChart');
Chart設定
4行目では、描画するグラフを、「new Chart( )」によって設定します。
var myLineChart = new Chart(ctx, {
  type: タイプ,
  data: データ,
  options: オプション
}
グラフを表示するためには**「type」「data」「options」**の3項目を設定する必要があります。
typeの種類
| 設定項目 | グラフ |
|---|---|
| bar | 棒グラフ |
| line | 折れ線グラフ |
| pie | 円グラフ |
| doughnut | 円グラフ |
| radar | レーダーチャート |
| polarArea | 鶏頭図 |
| bubble | バブルチャート |
| scatter | 散布図 |
optionsの種類
| 設定項目 | グラフ |
|---|---|
| bar | 棒グラフ |
| line | 折れ線グラフ |
| pie | 円グラフ |
| doughnut | 円グラフ |
| radar | レーダーチャート |
| polarArea | 鶏頭図 |
| bubble | バブルチャート |
| scatter | 散布図 |


