17
22

Delete article

Deleted articles cannot be recovered.

Draft of this article would be also deleted.

Are you sure you want to delete this article?

More than 5 years have passed since last update.

Pandasのデータフレームに色を加えて見やすくする

Posted at

前書き

pandasで作成したデータフレームは通常色は付いていませんが、このデータフレームに色を加えて視覚的にデータの内容を把握しやすくしようと思います。

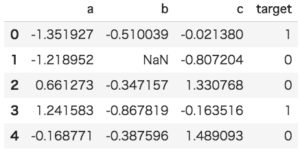
今回使用するデータを作成

import pandas as pd
import numpy as np

df = pd.DataFrame({'a': np.random.randn(10),
                   'b': np.random.randn(10),
                   'c': np.random.randn(10),
                 'target':np.random.randint(2, size=10)})

欠損値(nan)を作ります。

df.iloc[1,1] = np.nan
df.head()

スクリーンショット-2018-09-22-10.52.02-300x150.png

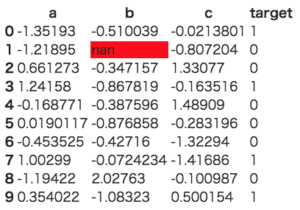
欠損値の箇所の色を変える

df.style.highlight_null(null_color='red')

スクリーンショット-2018-09-22-10.53.36-300x210.png

欠損値(nan)の部分が赤く表示されました。

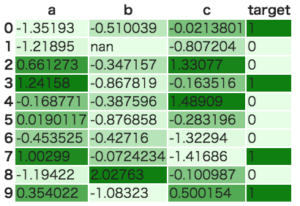
全体に色をつける

seabornを使ってデータフレーム全体に色をつけます
import seaborn as sns

cm = sns.light_palette("green", as_cmap=True)
df.style.background_gradient(cmap=cm)

スクリーンショット-2018-09-22-11.05.02-300x206.png

データフレーム全体に色がつきました。数値によって色の濃さが異なりまので、一目で数値の大小がわかります。

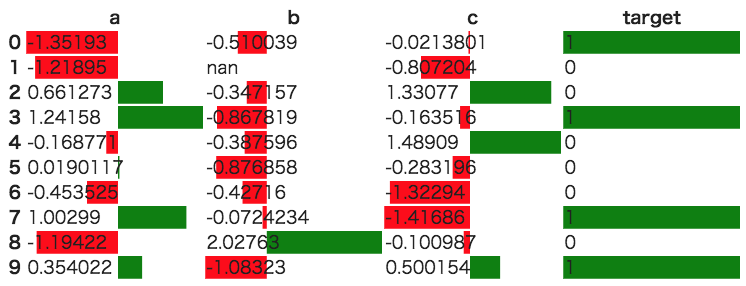
棒グラフを追加する

データフレームに棒グラフを追加します。
df.style.bar(subset=['a','b','c','target'], align='mid',color=['red', 'green'])

スクリーンショット-2018-09-22-11.10.26.png

負の数値は赤、正の数値は緑の棒グラフが表示されました。棒グラフの長さはその数値の割合の大きさを表しています。
17
22
0

Register as a new user and use Qiita more conveniently

  1. You get articles that match your needs
  2. You can efficiently read back useful information
  3. You can use dark theme
What you can do with signing up
17
22

Delete article

Deleted articles cannot be recovered.

Draft of this article would be also deleted.

Are you sure you want to delete this article?