「実験のレポート書かなきゃ」とか「これから研究生活始まるぞ」とかとか思ってるけど,「Excelはなんとなく使いたくない」という時にどうしようか。
迷ってたらとりあえずPythonで書きましょう。猫も杓子もPythonです。無料だし。
でもプログラミングほぼわからん。みたいな状態でも次のコードをjupyter notebookにコピペすればとりあえず図が出ます。
環境構築はAnacondaをインストールすればなんとかなります。がんばる。
とりあえず次のコードをコピペしていじればよい
%matplotlib inline #Jupyter上にグラフを表示する

import numpy as np
import matplotlib.pyplot as plt

folder = "hogehoge" #自分の測定データfileがあるフォルダのパス
filename = "test.txt"
data_path = folder + filename

data = np.genfromtxt(data_path, skip_header = 1)#変数dataに2次元の測定データを格納
x = data[:,0]#縦にxデータが並んでいると想定
y = data[:,1]

fig,ax = plt.subplots(1,1)
# プロットのためfigureオブジェクトと,その中にaxesオブジェクトを1×1個(名前 ax)作成

ax.plot(x,y,label = "y label")#凡例をつけてaxにプロット

ax.set_ylabel("y axis")
ax.set_xlabel("x axis")
ax.legend(loc = "best")#凡例表示
ここではn行2列のテーブルになっているファイルを想定。
測定データの補足情報とか書いてありそうなヘッダーは1行だとした。
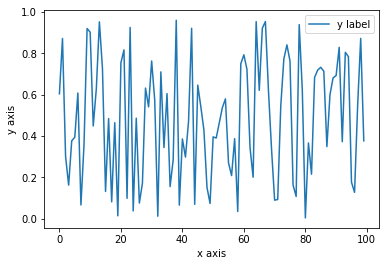
結果
ここで,擬似データを
x = np.arange(0,100,1)
y = np.random.rand(100)
でつくってプロットする。
いい感じ。
あとはググりながらコードの意味を調べるなり,解析してからプロットするなり,理想的な図に近づけていきましょう。
補足
plt.plot(x,y)
みたいにプロットするよりこっちの方がオブジェクト指向言語らしくかけてるかと思います。
