LCAO(Linear Combination of Atomic Orbital)でもとめた分子軌道の形が何を表すのか混乱したのでプロットしてみた。
LCAOなので基本的には離れた場所にある原子軌道同士を足したり引いたりなのだけど,球面調和関数のプロットって誤解を招きやすいものなので,s軌道は良くてもp軌道は本当にそれでいいのか不安になった。
結果としてはそれでよかったが,それでも何を表すかは誤解しやすそう。
%matplotlib inline #Jupyter上にグラフを表示する

import matplotlib
import numpy as np
import matplotlib.cm as cm
import matplotlib.pyplot as plt
原子軌道
まず原子軌道をプロットしてみる。(以下,形の対称性だけが気になるので原子核電荷のZやボーア半径などは適当に無視している)
1s軌道
delta = 0.025
x = np.arange(-3.0, 3.0, delta)
y = np.arange(-2.0, 2.0, delta)
X, Y = np.meshgrid(x, y)

Z = np.exp(-np.sqrt(X**2 + Y**2))
fig, ax = plt.subplots()
CS = ax.contour(X, Y, Z)
ax.clabel(CS, inline=1, fontsize=10)
ax.plot(0,0,"o")#原子核位置
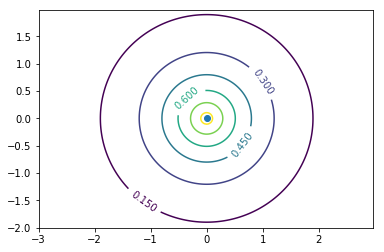
上が原子軌道の1s軌道のプロット。原点を通るある平面(例えばxy平面やzx平面)を断面としたときの波動関数の値を等高線で示している。5枚の電子殻を書いているのではない。つまり中心ほど波動関数が正の値で大きい。
2p軌道
delta = 0.025
x = np.arange(-4.0, 4.0, delta)
y = np.arange(-3.0, 3.0, delta)

X, Y = np.meshgrid(x, y)
Zpx = X/np.sqrt(X**2 + Y**2)*np.sqrt(X**2 + Y**2)*np.exp(-np.sqrt(X**2 + Y**2))#方位方向関数×動径方向関数
fig, ax = plt.subplots()
CS = ax.contour(X, Y, Zpx)
ax.clabel(CS, inline=1, fontsize=10)
ax.plot([0,0],[0,0],"o")#原子核位置
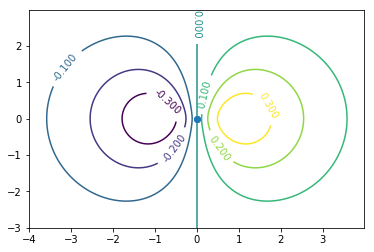
2p軌道の一つ。よくやるように実関数に基底を取り替えている。
**グラフの見方に注意。**これも実際の波動関数の特徴的な面(無限回回転対称軸を含む面)を断面とした時の波動関数の値を(紙面垂直方向に)等高線で示している。
よく見かける2色のひょうたん型のような波動関数の3次元プロットは何を表しているのかというと,
- 波動関数が例えば上のグラフでの0.200と−0.200という値をとる空間上の点を繋げた曲面を表しているか,
-
球面調和関数の値を3次元空間での動径方向を軸として極座標プロットしているか
のどちらかだろう。
後者の場合と混同するとよくない。2の場合,動径方向はいわば波の振幅の大きさを表す軸でしかない。こんな書き方をするより,単位球面上カラーマップで書いた方がいいんじゃないかと思ったらWikipediaの球面調和関数のページには球表示としてその対応がアニメーションになっている。
上のグラフでは動径方向の波動関数もかけてプロットしているのでx,y軸は実際の空間であり1の場合として見てよい。(中心力ポテンシャルの波動関数は球面調和関数と動径方向波動関数の積として求まる)
分子軌道
本題
1s軌道同士の分子軌道
delta = 0.025
x = np.arange(-3.0, 3.0, delta)
y = np.arange(-2.0, 2.0, delta)
X, Y = np.meshgrid(x, y)

Z1 = np.exp(-np.sqrt((X - 1)**2 + Y**2))
Z2 = np.exp(-np.sqrt((X + 1)**2 + Y**2))
Zodd = (Z1 - Z2) #anti-bonding
Zeven = (Z1 + Z2) #bonding

fig, ax = plt.subplots()
CS = ax.contour(X, Y, Zeven)
ax.clabel(CS, inline=1, fontsize=10)
ax.plot([-1,1],[0,0],"o")#原子核位置

fig, ax = plt.subplots()
CS = ax.contour(X, Y, Zodd)
ax.clabel(CS, inline=1, fontsize=10)
ax.plot([-1,1],[0,0],"o")#原子核位置
結合性軌道と反結合性軌道
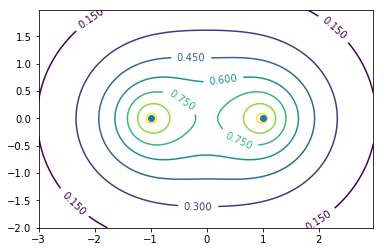
外側に行くほど波動関数が小さくなる球体(1s軌道)が二つ並べてある。
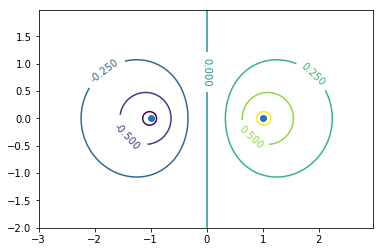
グラフの意味は二つの原子核を含む面での断面における分子軌道の波動関数の値を等高線で書いている。縦軸横軸は実際の空間の位置である。
LCAOにおいては波動関数は単純に$\phi_i$をそれぞれの原子軌道として位相を揃えて足すか(結合性軌道$\psi_b$),反転させて足すか(反結合性軌道$\psi_a$)で2通りの分子軌道が作られ,
\psi_b(r) \propto \phi_1(r) + \phi_2(r)\\
\psi_a(r) \propto \phi_1(r) - \phi_2(r)
のようになるので,空間分布もそれに従う。
たとえば上のグラフで0.6,-0.6のような等高面を抜き出せば,見たことがあるかもしれない1色ひょうたんのような結合性軌道や真ん中の切れた2色ひょうたんのような反結合性軌道が現れる。
ちなみに結合性軌道の方が間に電子が入ってクーロン反発を遮蔽するのでエネルギーが低い。
2p軌道同士の分子軌道
p軌道は等方的でないため二つ並べた時に波動関数の重なり方が2通りある。
σ結合
delta = 0.025
x = np.arange(-4.0, 4.0, delta)
y = np.arange(-3.0, 3.0, delta)

X, Y = np.meshgrid(x, y)
X1 = X + 1
X2 = X - 1
Zpx1 = X1/np.sqrt(X1**2 + Y**2)*np.sqrt(X1**2 + Y**2)*np.exp(-np.sqrt(X1**2 + Y**2))
Zpx2 = X2/np.sqrt(X2**2 + Y**2)*np.sqrt(X2**2 + Y**2)*np.exp(-np.sqrt(X2**2 + Y**2))
Zodd = (Zpx1 - Zpx2)
Zeven = (Zpx1 + Zpx2)

fig, ax = plt.subplots()
CS = ax.contour(X, Y, Zodd)#bonding
ax.clabel(CS, inline=1, fontsize=10)
ax.plot([-1,1],[0,0],"o")#原子核位置

fig, ax = plt.subplots()
CS = ax.contour(X, Y, Zeven)#antibonding
ax.clabel(CS, inline=1, fontsize=10)
ax.plot([-1,1],[0,0],"o")#原子核位置
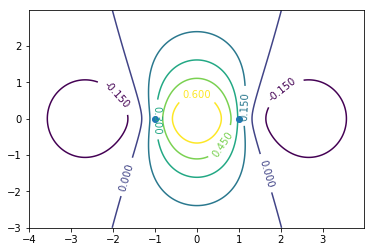
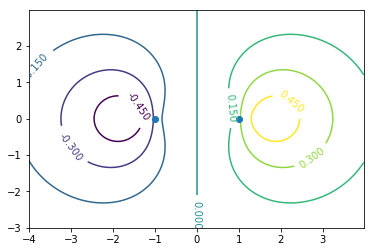
波動関数の値が大きい方向同士で重なるのがσ結合。グラフの見方は1s軌道同士の分子軌道と同様でよい。0.15,-0.15の部分を抜き出せばそれらしく見えるはず。
エネルギーは波動関数の同じ位相同士が結合している結合性軌道の方が低い(上の画像の状態)。節の数が多いほどエネルギーが高いといった弦の固有振動との類似性はs軌道では成り立つが,p軌道では当てはまらない。
π結合
delta = 0.025
x = np.arange(-4.0, 4.0, delta)
y = np.arange(-4.0, 4.0, delta)

X, Y = np.meshgrid(x, y)
X1 = X + 1
X2 = X - 1
Zpy1 = Y/np.sqrt(X1**2 + Y**2)*np.sqrt(X1**2 + Y**2)*np.exp(-np.sqrt(X1**2 + Y**2))
Zpy2 = Y/np.sqrt(X2**2 + Y**2)*np.sqrt(X2**2 + Y**2)*np.exp(-np.sqrt(X2**2 + Y**2))
Zodd = (Zpy1 - Zpy2)
Zeven = (Zpy1 + Zpy2)
fig, ax = plt.subplots(figsize = (5,5))
CS = ax.contour(X, Y, Zodd)#antibonding
ax.clabel(CS, inline=1, fontsize=10)
ax.plot([-1,1],[0,0],"o")#原子核位置

fig, ax = plt.subplots(figsize = (5,5))
CS = ax.contour(X, Y, Zeven) #bonding
ax.clabel(CS, inline=1, fontsize=10)
ax.plot([-1,1],[0,0],"o")#原子核位置
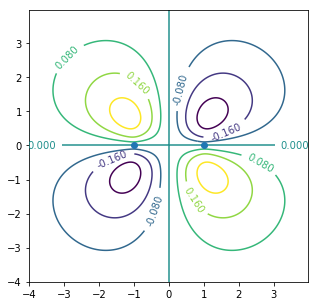
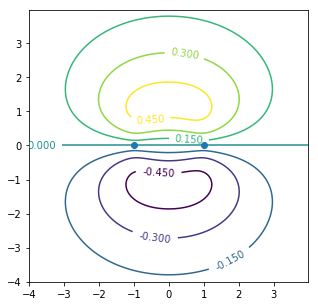
p軌道のいわゆる「側面」で繋がる結合。ベンゼンやグラファイトの性質を理解するうえで重要。
まとめ
結局のところ今回のプロットで何が理解の助けになったかというと,3次元プロットをやめて,ある断面を取り,波動関数の値を等高線プロットにすることで,あとは波動関数同士を足し算すれば正しい分子軌道の形状が得られたということでした。
終わって気づきましたがこれってクーロンポテンシャルや重力場を考える時にやることと同じですね。p軌道は正負の電荷を並べて作れば対称性はかわらないしおおよその形はわかるでしょう。そう思えば全部当然でした。
結合の様子から物性がわかるようになりたい。
参考文献
新版 現代物性化学の基礎 (KS化学専門書)
