はじめに
RESAS は日本の地域経済データを取得できるサービスです
RESAS-API に利用登録すると、 REST API でデータを取得することもできます
前回は人口構成を可視化してみましたが、今回は産業構造を分析してみたいと思います
今回実装したノートブックの全量はこちら
出典
この記事はRESAS(地域経済分析システム)のデータを加工して作成しています
実行環境
このリポジトリーの Docker コンテナ上で実行しました
RESAS-API の使い方
前回の記事を参照してください
セットアップ
Livebook を起動してノートブックを開きます
以下のコードをノートブック上で実行してください
Mix.install([
  {:httpoison, "~> 1.8"},
  {:json, "~> 1.4"},
  {:explorer, "~> 0.3"},
  {:kino, "~> 0.7"},
  {:kino_vega_lite, "~> 0.1.4"}
])
必要なライブラリをインストールします
- httpoison: REST API を呼び出す
- json: JSON をエンコード、デコードする
- explorer: データ分析
- kino: 実行結果を可視化する
- kino_vega_lite: データをグラフ化する
以下のコードを実行するとテキストエリアが表示されるので、 Tellus で作っておいたトークンを入力します
# RESAS のAPIキーを入力する
api_key_input = Kino.Input.password("API_KEY")
ベースAPIを設定します
base_url = "https://opendata.resas-portal.go.jp"
エイリアスを指定しておきます
alias Explorer.DataFrame
alias Explorer.Series
alias VegaLite, as: Vl
RESAS の認証
RESAS の認証は API キーをヘッダーに入れるだけです
認証ヘッダーを設定しておきます
auth_header = {"X-API-KEY", Kino.Input.read(api_key_input)}
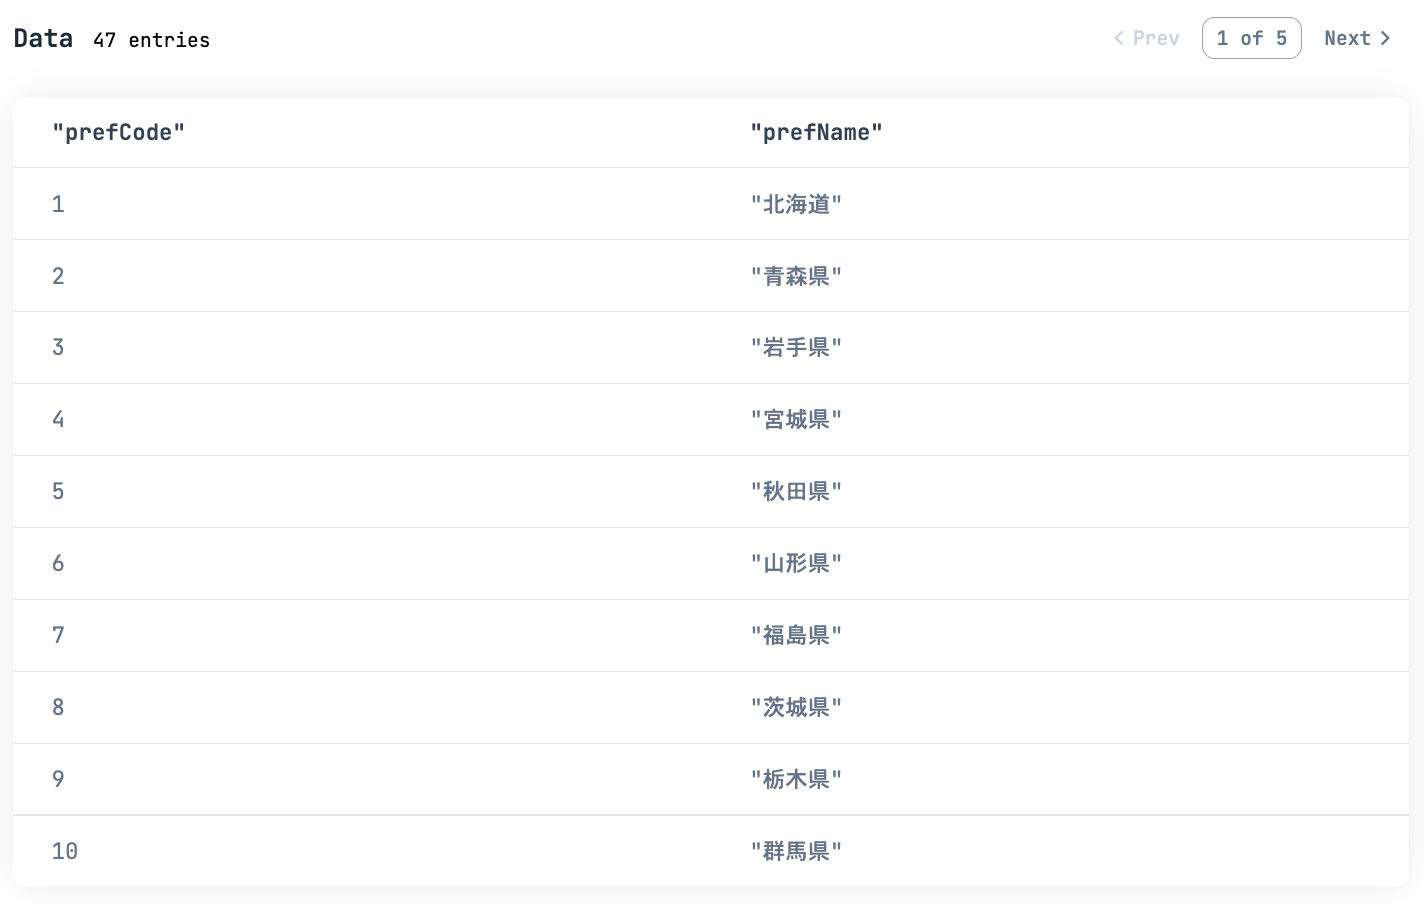
都道府県一覧の取得
都道府県一覧は以下のようにして呼び出します
prefectures_url = "#{base_url}/api/v1/prefectures"

prefectures_df =
  prefectures_url
  |> HTTPoison.get!([auth_header])
  |> then(&JSON.decode!(&1.body))
  |> then(&DataFrame.new(&1["result"]))

prefectures_df
|> Kino.DataTable.new(sorting_enabled: true)
大分県の都道府県コードを取得します
oita_pref_code =
  prefectures_df
  |> DataFrame.filter_with(&Series.equal(&1["prefName"], "大分県"))
  |> DataFrame.pull("prefCode")
  |> Series.first()
産業一覧の取得
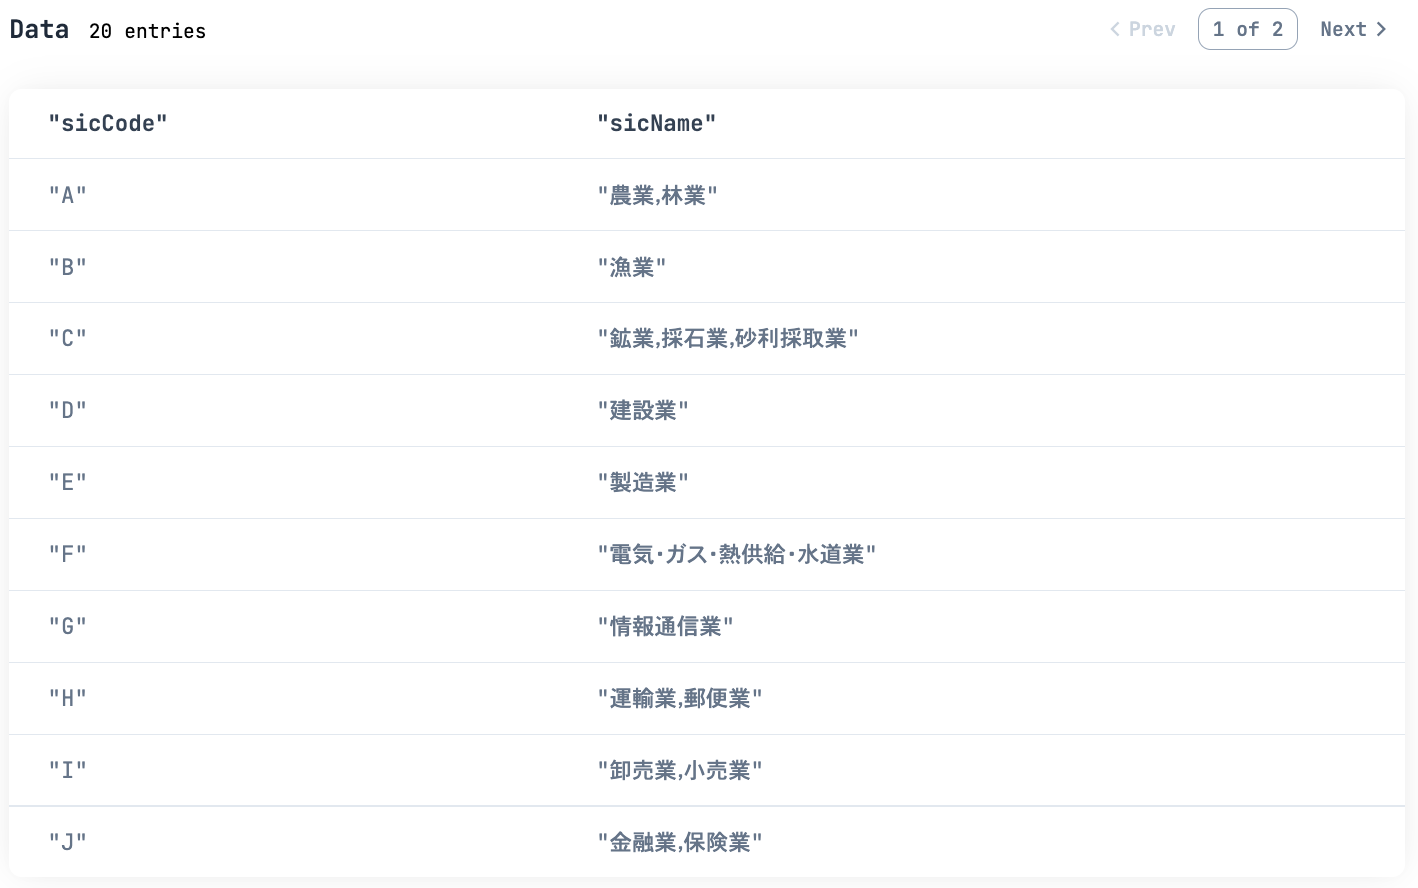
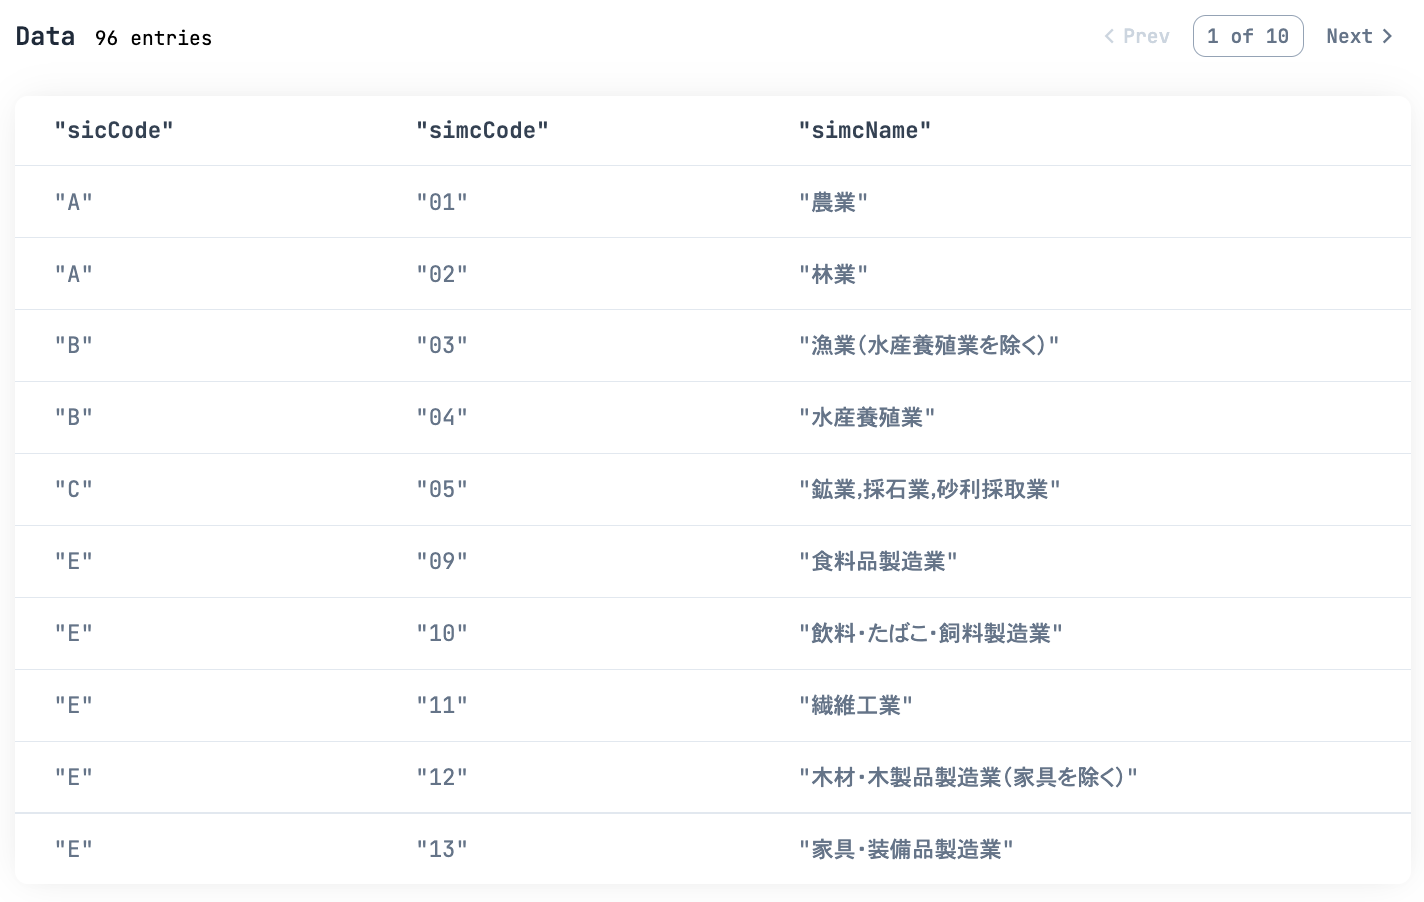
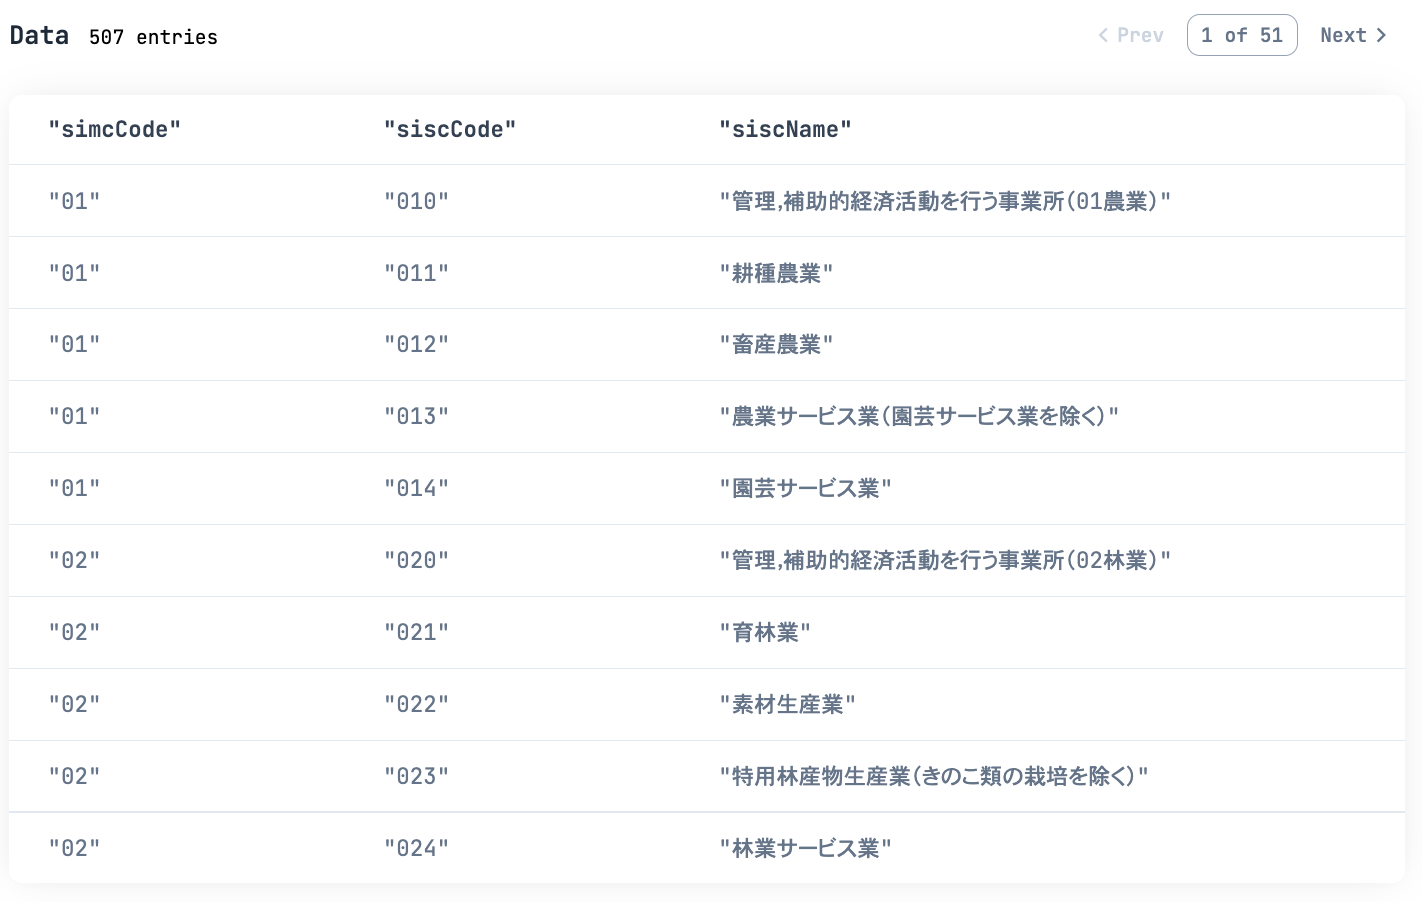
産業は大分類、中分類、小分類でそれぞれ分類されています
# 大分類
industries_broad_df =
  "#{base_url}/api/v1/industries/broad"
  |> HTTPoison.get!([auth_header])
  |> then(&JSON.decode!(&1.body))
  |> then(&DataFrame.new(&1["result"]))

industries_broad_df
|> Kino.DataTable.new(sorting_enabled: true)
中分類は大分類コードでループして取得します
# 中分類
get_industries_middle = fn sic_code ->
  "#{base_url}/api/v1/industries/middle?sicCode=#{sic_code}"
  |> HTTPoison.get!([auth_header])
  |> then(&JSON.decode!(&1.body))
  |> then(&DataFrame.new(&1["result"]))
end

industries_middle_df =
  industries_broad_df
  |> DataFrame.pull("sicCode")
  |> Series.to_list()
  |> Enum.map(&get_industries_middle.(&1))
  |> Enum.filter(&(DataFrame.n_rows(&1) > 0))
  |> DataFrame.concat_rows()

industries_middle_df
|> Kino.DataTable.new(sorting_enabled: true)
小分類は中分類コードでループして取得します
# 小分類
get_industries_narrow = fn simc_code ->
  "#{base_url}/api/v1/industries/narrow?simcCode=#{simc_code}"
  |> HTTPoison.get!([auth_header])
  |> then(&JSON.decode!(&1.body))
  |> then(&DataFrame.new(&1["result"]))
end

industries_narrow_df =
  industries_middle_df
  |> DataFrame.pull("simcCode")
  |> Series.to_list()
  |> Enum.map(&get_industries_narrow.(&1))
  |> Enum.filter(&(DataFrame.n_rows(&1) > 0))
  |> DataFrame.concat_rows()

industries_narrow_df
|> Kino.DataTable.new(sorting_enabled: true)
地域別特化係数の取得
産業構造を数値化するものとして、特化係数を取得します
特化係数は、ある地域のある産業が、全国と比べてどれだけ特化しているか、を示す値です
1.0 を超えていれば、その地域はその産業に特化した地域である、と言えます
今回は付加価値額を基準に算出した特化係数を使用します
$$
特化係数(付加価値額) = \frac{域内における当該産業の付加価値額÷域内における全産業の付加価値額}{全国の当該産業の付加価値額÷全国の全産業の付加価値額}
$$
地域別特化係数は以下のようにして取得します
get_industry_power = fn year, pref_code, area_type, disp_type, sic_code, simc_code ->
  query =
    "?year=#{year}" <>
      "&prefCode=#{pref_code}" <>
      "&areaType=#{area_type}" <>
      "&dispType=#{disp_type}" <>
      "&sicCode=#{sic_code}" <>
      "&simcCode=#{simc_code}"

  url = "#{base_url}/api/v1/industry/power/forArea#{query}"

  url
  |> HTTPoison.get!([auth_header])
  |> then(&JSON.decode!(&1.body))
  |> then(& &1["result"])
end
大分県の 2016 年時点、農業の地域別特化係数(付加価値額)を取得する場合は以下のように指定します
industry_power = get_industry_power.("2016", oita_pref_code, "1", "1", "A", "01")
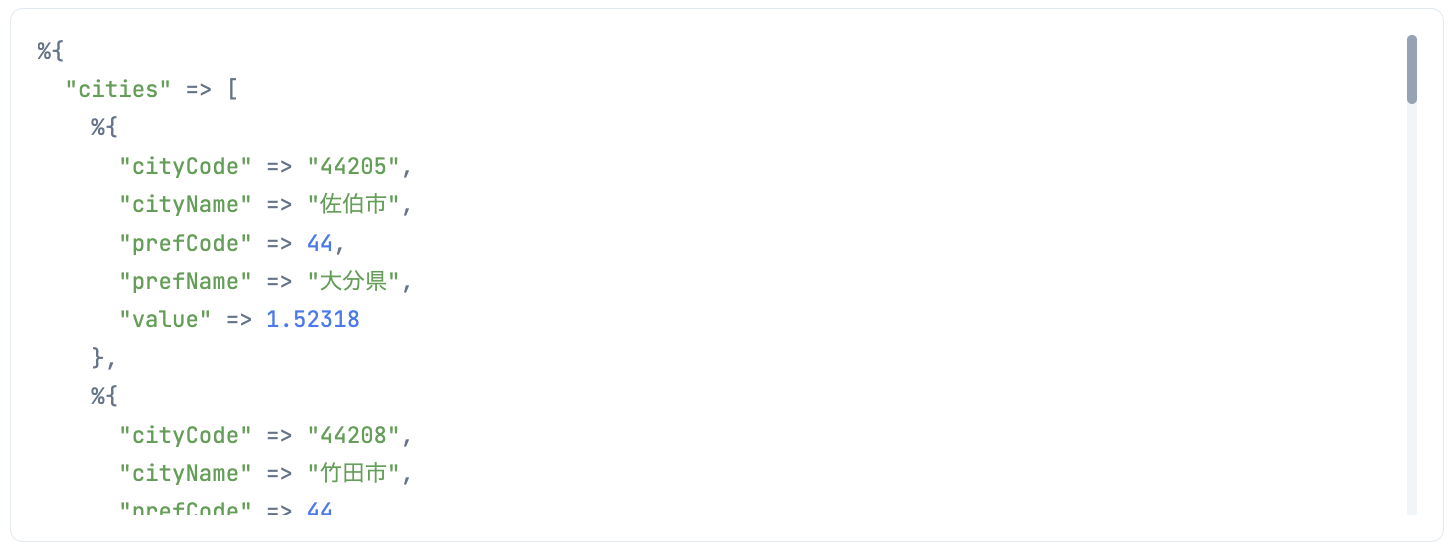
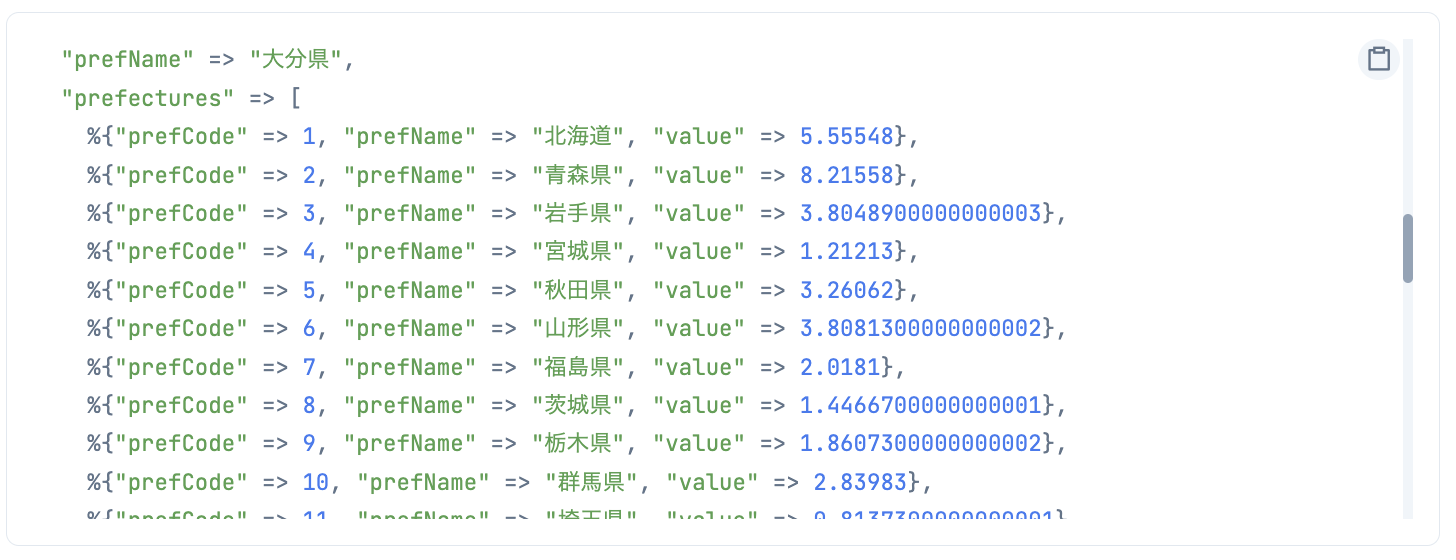
このとき、大分県内の各市町村の特化係数と同時に、都道府県別の特化係数も取得できます
今回はこちらの都道府県別データを使っていきます
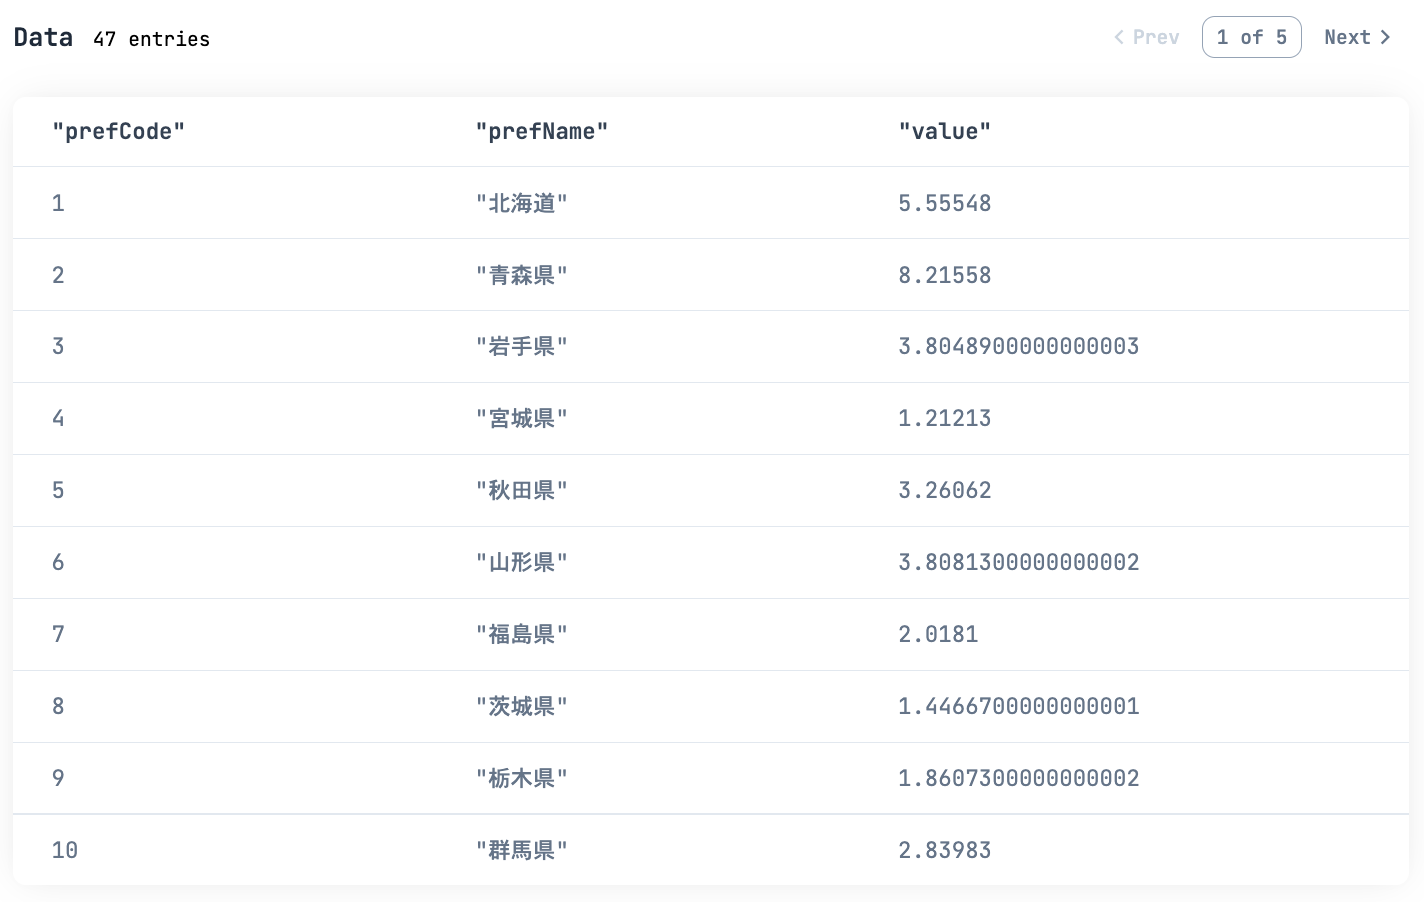
都道府県別データをデータフレーム化します
prefectures_industry_power_df =
  industry_power["prefectures"]
  |> DataFrame.new()

prefectures_industry_power_df
|> Kino.DataTable.new(sorting_enabled: true)
都道府県毎にどれだけ農業に特化しているか、のデータが一覧化できました
グラフ化するときに使う関数を定義しておきます
get_values = fn df, col ->
  df
  |> DataFrame.pull(col)
  |> Series.to_list()
end
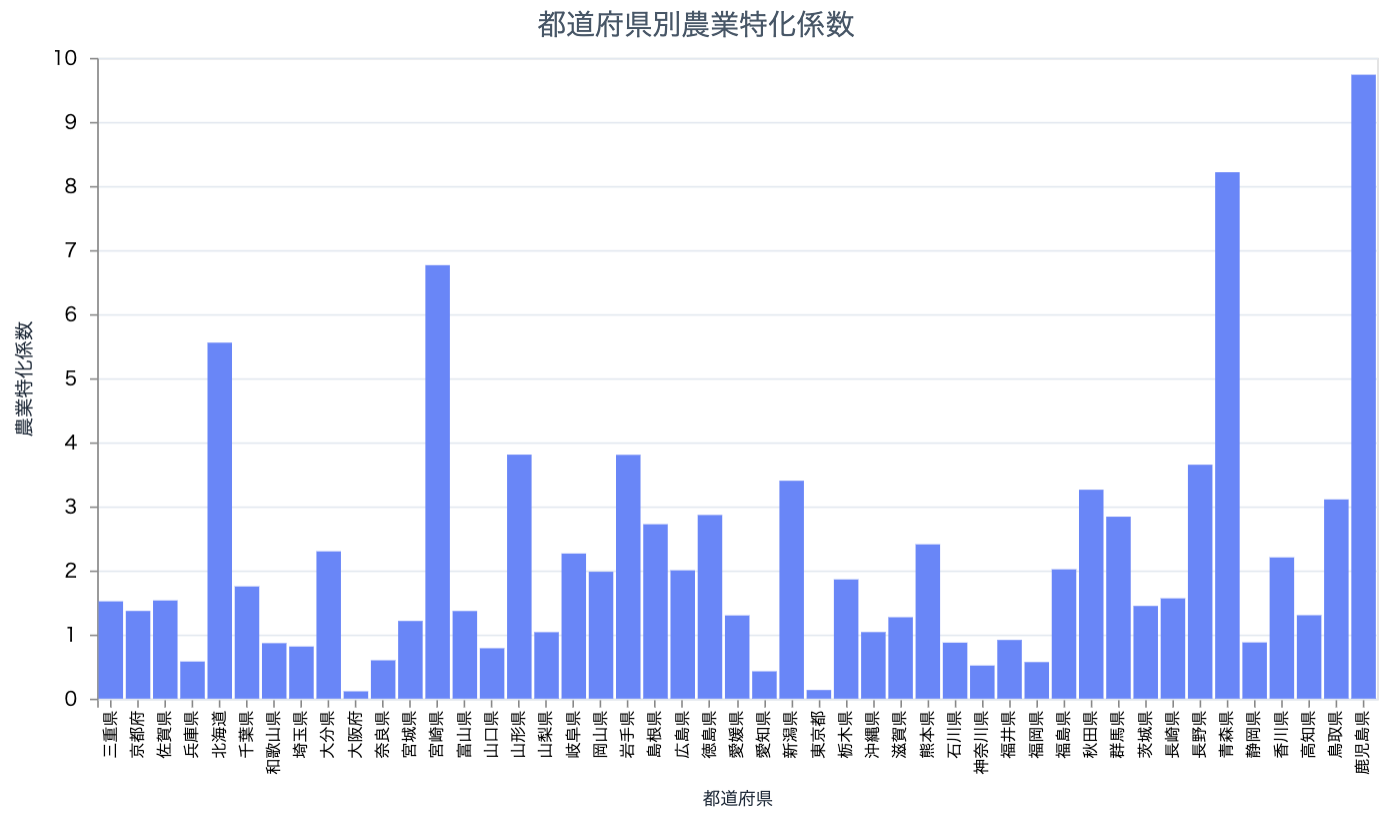
棒グラフを表示する関数です
# 都道府県別棒グラフ
prefectures_bar = fn df, col, value_label ->
  x = get_values.(df, "prefName")
  y = get_values.(df, col)

  Vl.new(width: 800, height: 400, title: "都道府県別#{value_label}")
  |> Vl.data_from_values(x: x, y: y)
  |> Vl.mark(:bar)
  |> Vl.encode_field(
    :x,
    "x",
    type: :nominal,
    title: "都道府県"
  )
  |> Vl.encode_field(
    :y,
    "y",
    type: :quantitative,
    title: value_label
  )
end
鹿児島、青森、宮崎、北海道が農業に特化しています
中分類単位で全産業の特化係数を取得しましょう
prefectures_industry_power_df =
  # 中分類コードリストを取得
  industries_middle_df
  |> DataFrame.select(["sicCode", "simcCode"])
  |> DataFrame.to_rows()
  # 中分類毎に特化係数を取得
  |> Enum.map(fn industry ->
    get_industry_power.(
      "2016",
      oita_pref_code,
      "1",
      "1",
      industry["sicCode"],
      industry["simcCode"]
    )
    |> then(& &1["prefectures"])
    # 該当データがないものは除去する
    |> Enum.filter(&(&1 != nil))
    # データを整形する
    |> Enum.map(fn datum ->
      Map.merge(datum, %{"sicCode" => industry["sicCode"], "simcCode" => industry["simcCode"]})
    end)
  end)
  # 中分類毎にデータフレーム化する
  |> Enum.map(&DataFrame.new(&1))
  # 該当データがないものは除去する
  |> Enum.filter(&(DataFrame.n_rows(&1) > 0))
  # 全中分類のデータフレームを結合する
  |> DataFrame.concat_rows()
  # 大分類、中分類名を表示するために結合する
  |> DataFrame.join(industries_broad_df)
  |> DataFrame.join(industries_middle_df)

prefectures_industry_power_df
|> Kino.DataTable.new(sorting_enabled: true)
グラフタイトルに産業中分類を表示するための関数を用意します
# 中分類名取得
get_simc_name = fn simc_code ->
  industries_middle_df
  |> DataFrame.filter_with(&Series.equal(&1["simcCode"], simc_code))
  |> DataFrame.pull("simcName")
  |> Series.first()
end
``

```elixir
# 都道府県別産業構造中分類棒グラフ
prefectures_industry_bar = fn simc_code ->
  label = get_simc_name.(simc_code)

  prefectures_industry_power_df
  |> DataFrame.filter_with(&Series.equal(&1["simcCode"], simc_code))
  |> prefectures_bar.("value", "#{label}特化係数")
end
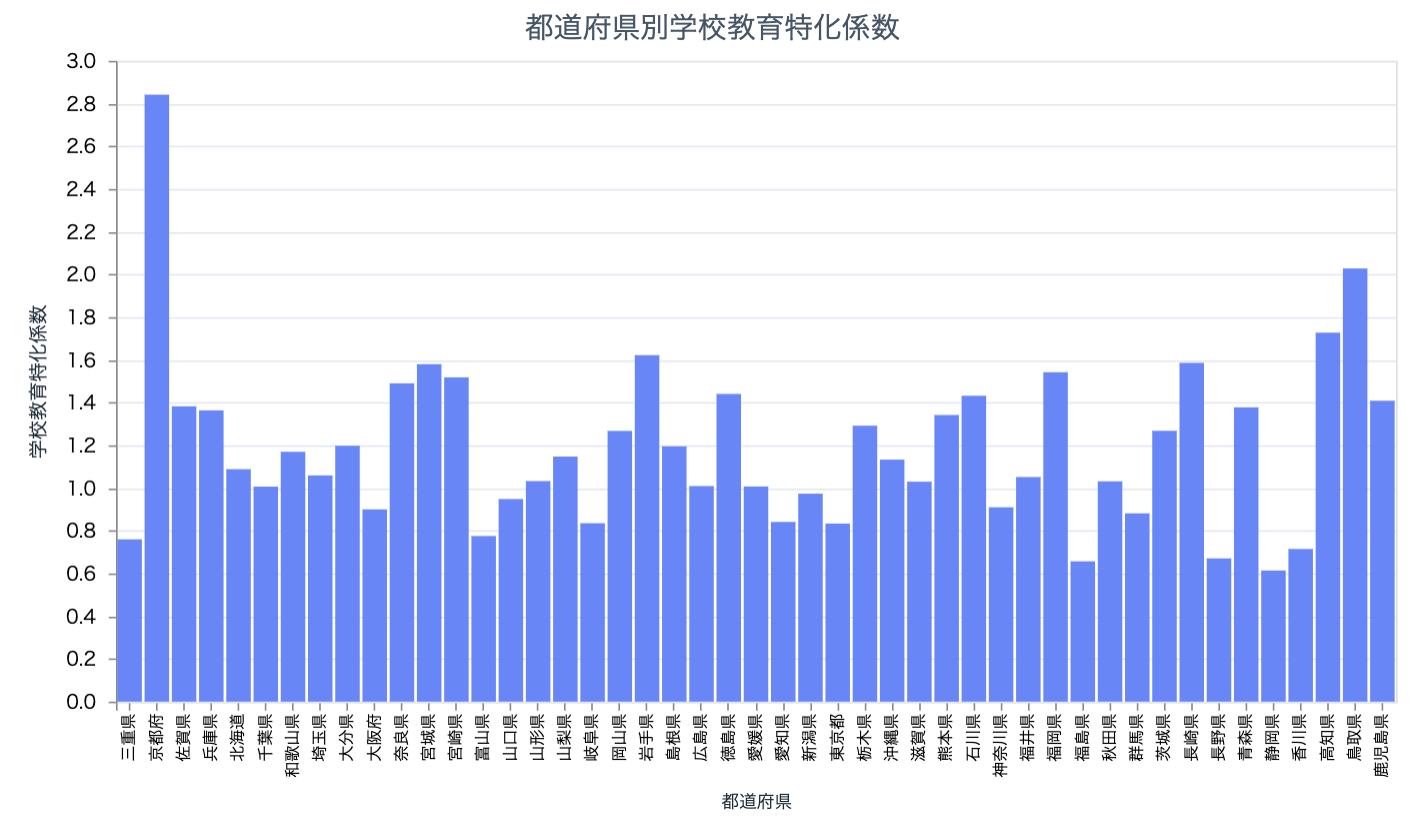
中分類コード 81 の学校教育特化係数を表示してみます
prefectures_industry_bar.("81")
京都は教育関連の産業に特化しているようです
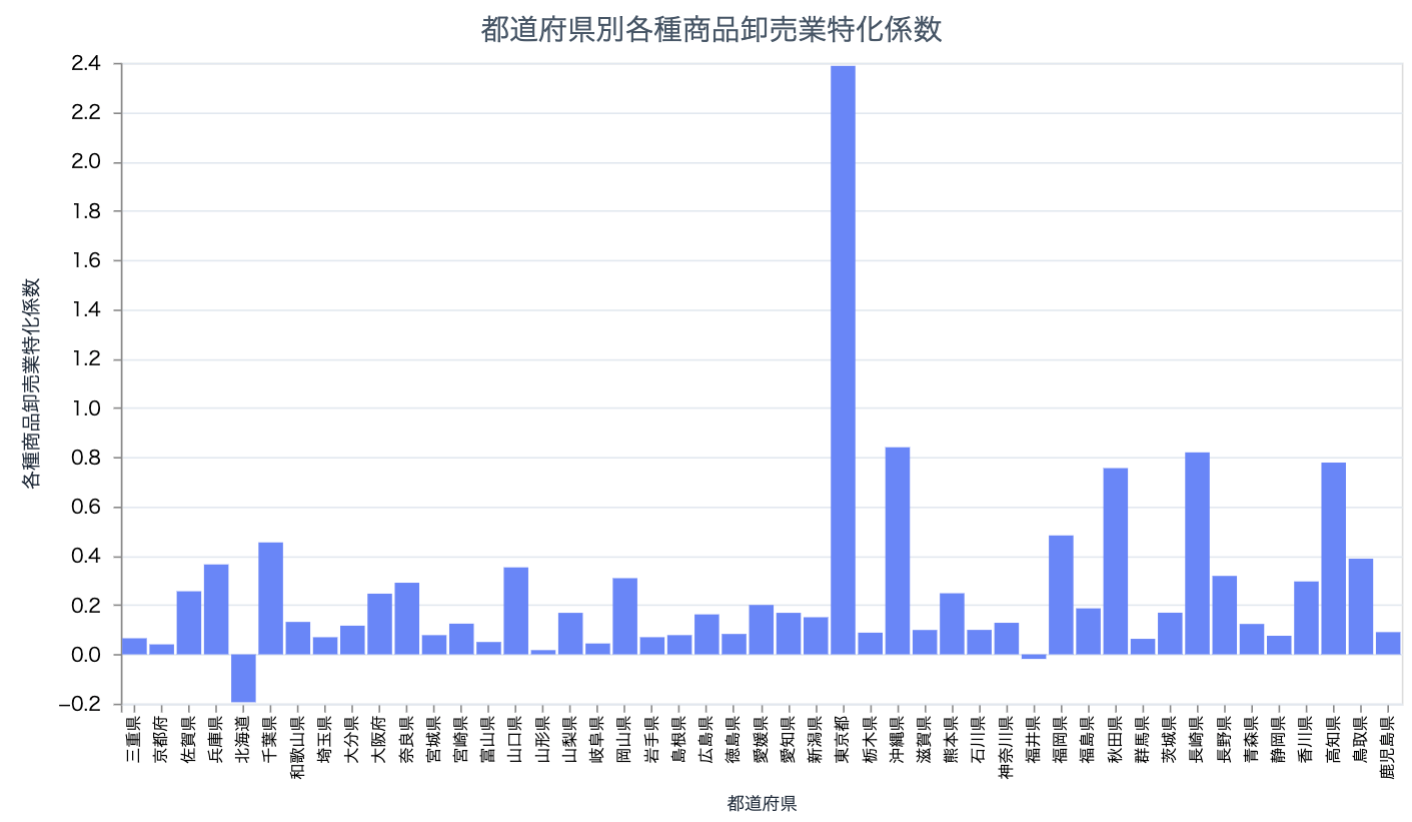
中分類コード 50 の各種商品卸売業特化係数を表示してみます
prefectures_industry_bar.("50")
卸売は東京に一極集中しています
北海道はマイナスなので、卸売では2016年時点で赤字のようです
ピボット
特化係数と他の値の相関を見るため、データを形を変えます
今1列になっている中分類コードを、中分類コード別の列に変換します
このような操作をピボットと言います
変換前
- prefCode
- prefName
- simcCode
- value
変換後
- prefCode
- prefName
- 01
- 02
- 03
...
DataFrame.pivot_wider で、行数を減らして列数を増やします
pivot_df =
  prefectures_industry_power_df
  |> DataFrame.select(["prefCode", "prefName", "simcCode", "value"])
  |> DataFrame.pivot_wider("simcCode", "value")

pivot_df
|> Kino.DataTable.new(sorting_enabled: true)
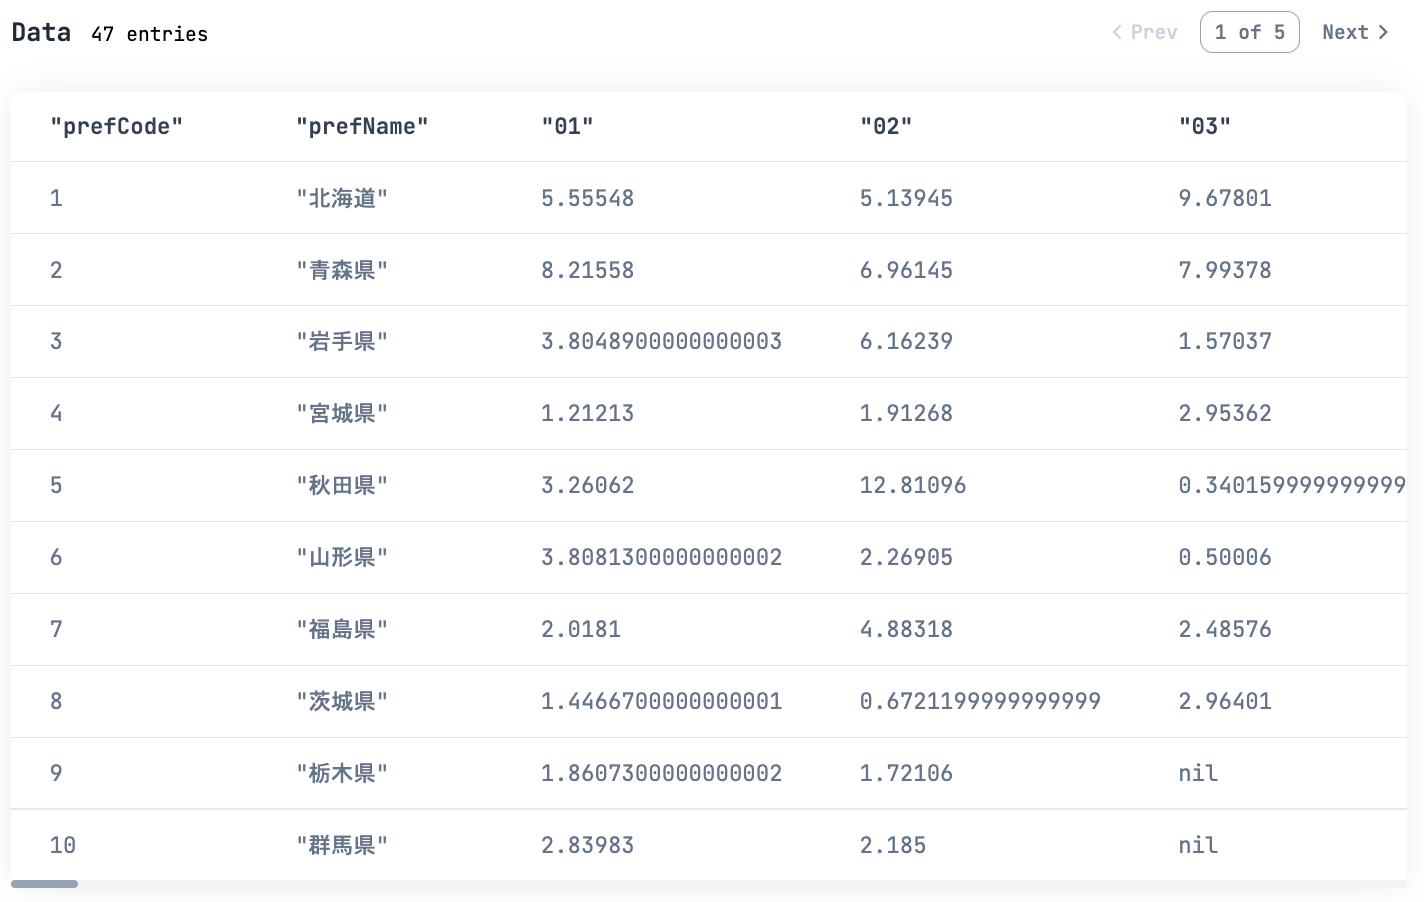
今まで都道府県数 * 中分類数(一部欠落) になっていた行数が、都道府県数(47)になりました
ただし、 03 の列を見てみると、栃木県、群馬県の値が nil になっています
おそらくデータが取得できなかったものと思われます
このような値が存在しない部分を欠損値と言います
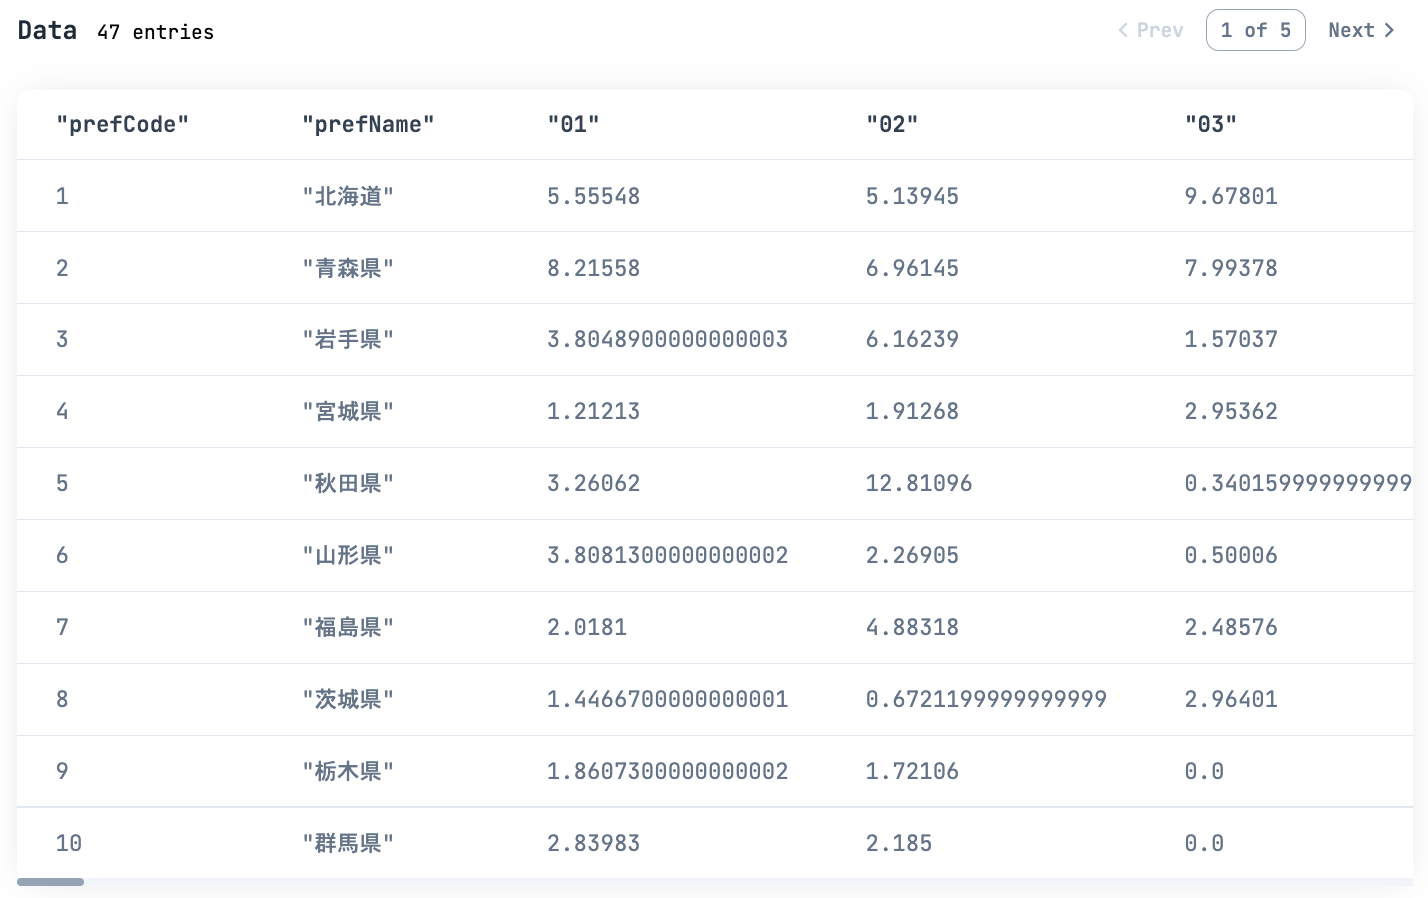
今後の分析のため欠損値を 0 で補完します
# 補完対象の列
cols =
  prefectures_industry_power_df
  |> DataFrame.distinct(["simcCode"])
  |> DataFrame.pull("simcCode")
  |> Series.to_list()
Series.fill_missing を各列に適用することで補完できます
# 欠損値の補完
pivot_df =
  cols
  |> Enum.reduce(pivot_df, fn col, df ->
    DataFrame.mutate_with(df, &%{col => Series.fill_missing(&1[col], 0.0)})
  end)

pivot_df
|> Kino.DataTable.new()
散布図の表示
中分類毎の特化係数がそれくらい相関しているか、散布図で見てみます
ついでに回帰直線も表示しましょう
scatter = fn df, x_col, y_col, size ->
  x = get_values.(df, x_col)
  y = get_values.(df, y_col)

  Vl.new(width: size, height: size)
  |> Vl.data_from_values(x: x, y: y)
  |> Vl.encode_field(:x, "x",
    type: :quantitative,
    scale: [domain: [Enum.min(x), Enum.max(x)]],
    title: x_col
  )
  |> Vl.encode_field(:y, "y",
    type: :quantitative,
    scale: [domain: [Enum.min(y), Enum.max(y)]],
    title: y_col
  )
  |> Vl.layers([
    Vl.new()
    |> Vl.mark(:point),
    Vl.new()
    |> Vl.mark(:line)
    |> Vl.transform(regression: "x", on: "y"),
  ])
end
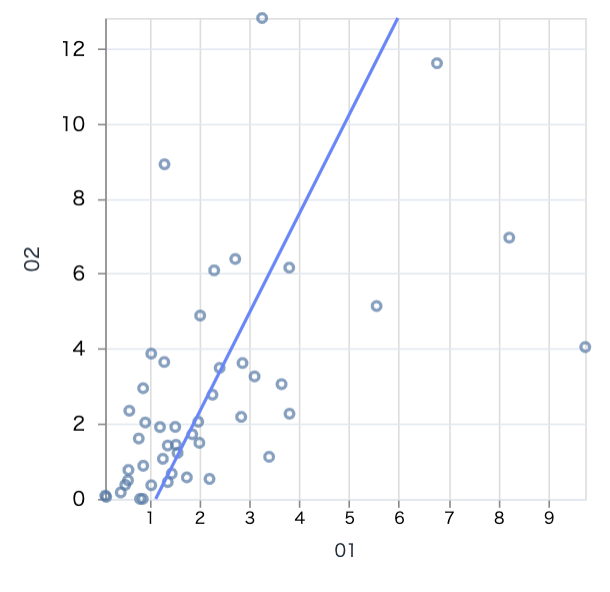
農業と林業の散布図は以下のようになります
scatter.(pivot_df, "01", "02", 300)
点が回帰直線の周辺にあり、そこそこ相関がありそうなことが分かります
つまり、農業に特化した地域は林業にも特化している傾向がある、ということです
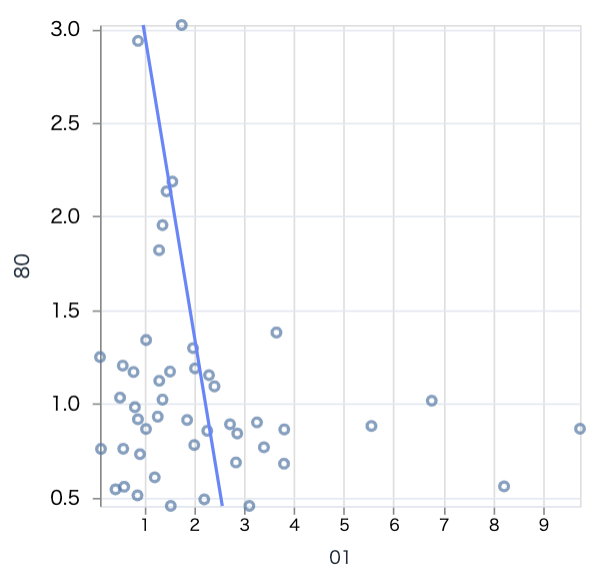
農業と娯楽業だとこのようになります
scatter.(pivot_df, "01", "80", 300)
あまり関係性はないか、負の相関、つまり農業に特化していれば娯楽業には特化していない、という傾向がありそうです
一人当たり地方税の取得
都道府県の豊かさをどう示すか難しいですが、税収を比べてみましょう
地方税は地方公共団体が課税する税金で、以下のようなものが含まれます
- 住民税
- 事業税
- 固定資産税
- 地方消費税
- 自動車税
一人当たりの地方税を見れば、どれだけたくさん稼いだり資産を持っていたりするのか分かりそうです
一人当たり地方税を以下のようにして取得します
get_local_tax = fn pref_code ->
  query =
    "?prefCode=#{pref_code}&cityCode=-"

  url = "#{base_url}/api/v1/municipality/taxes/perYear#{query}"

  url
  |> HTTPoison.get!([auth_header])
  |> then(&JSON.decode!(&1.body))
  |> then(& &1["result"]["data"])
end
全都道府県について取得します
local_tax_df =
  prefectures_df
  |> DataFrame.pull("prefCode")
  |> Series.to_list()
  |> Enum.flat_map(fn pref_code ->
    pref_code
    |> get_local_tax.()
    |> Enum.map(&Map.merge(&1, %{"prefCode" => pref_code}))
  end)
  |> DataFrame.new()
  |> DataFrame.join(prefectures_df)

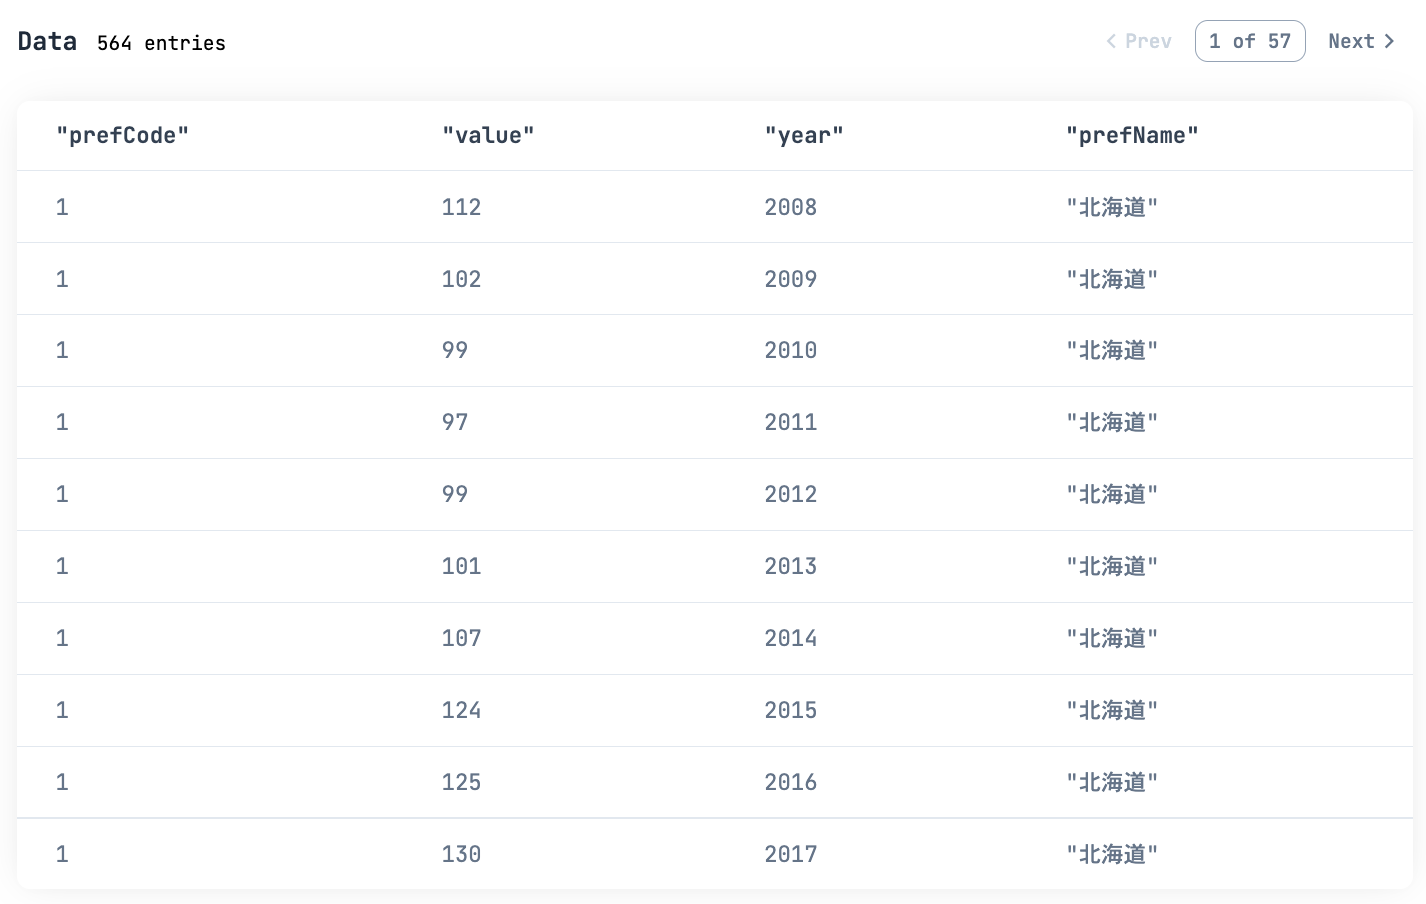
local_tax_df
|> Kino.DataTable.new(sorting_enabled: true)
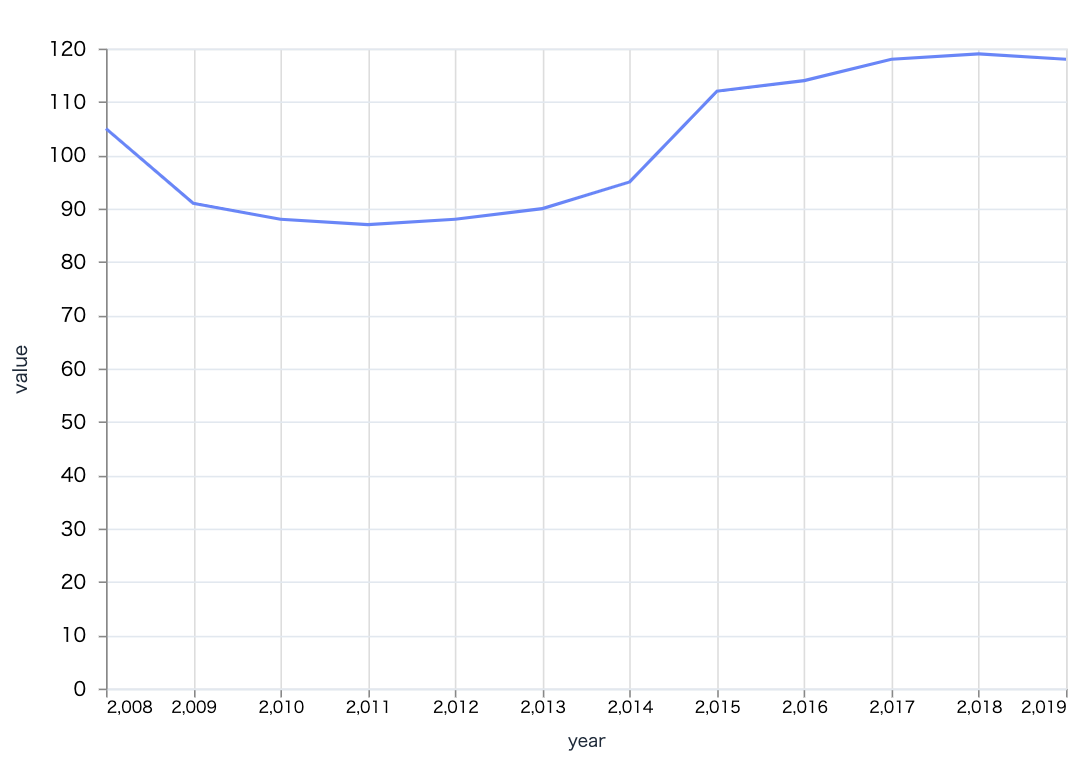
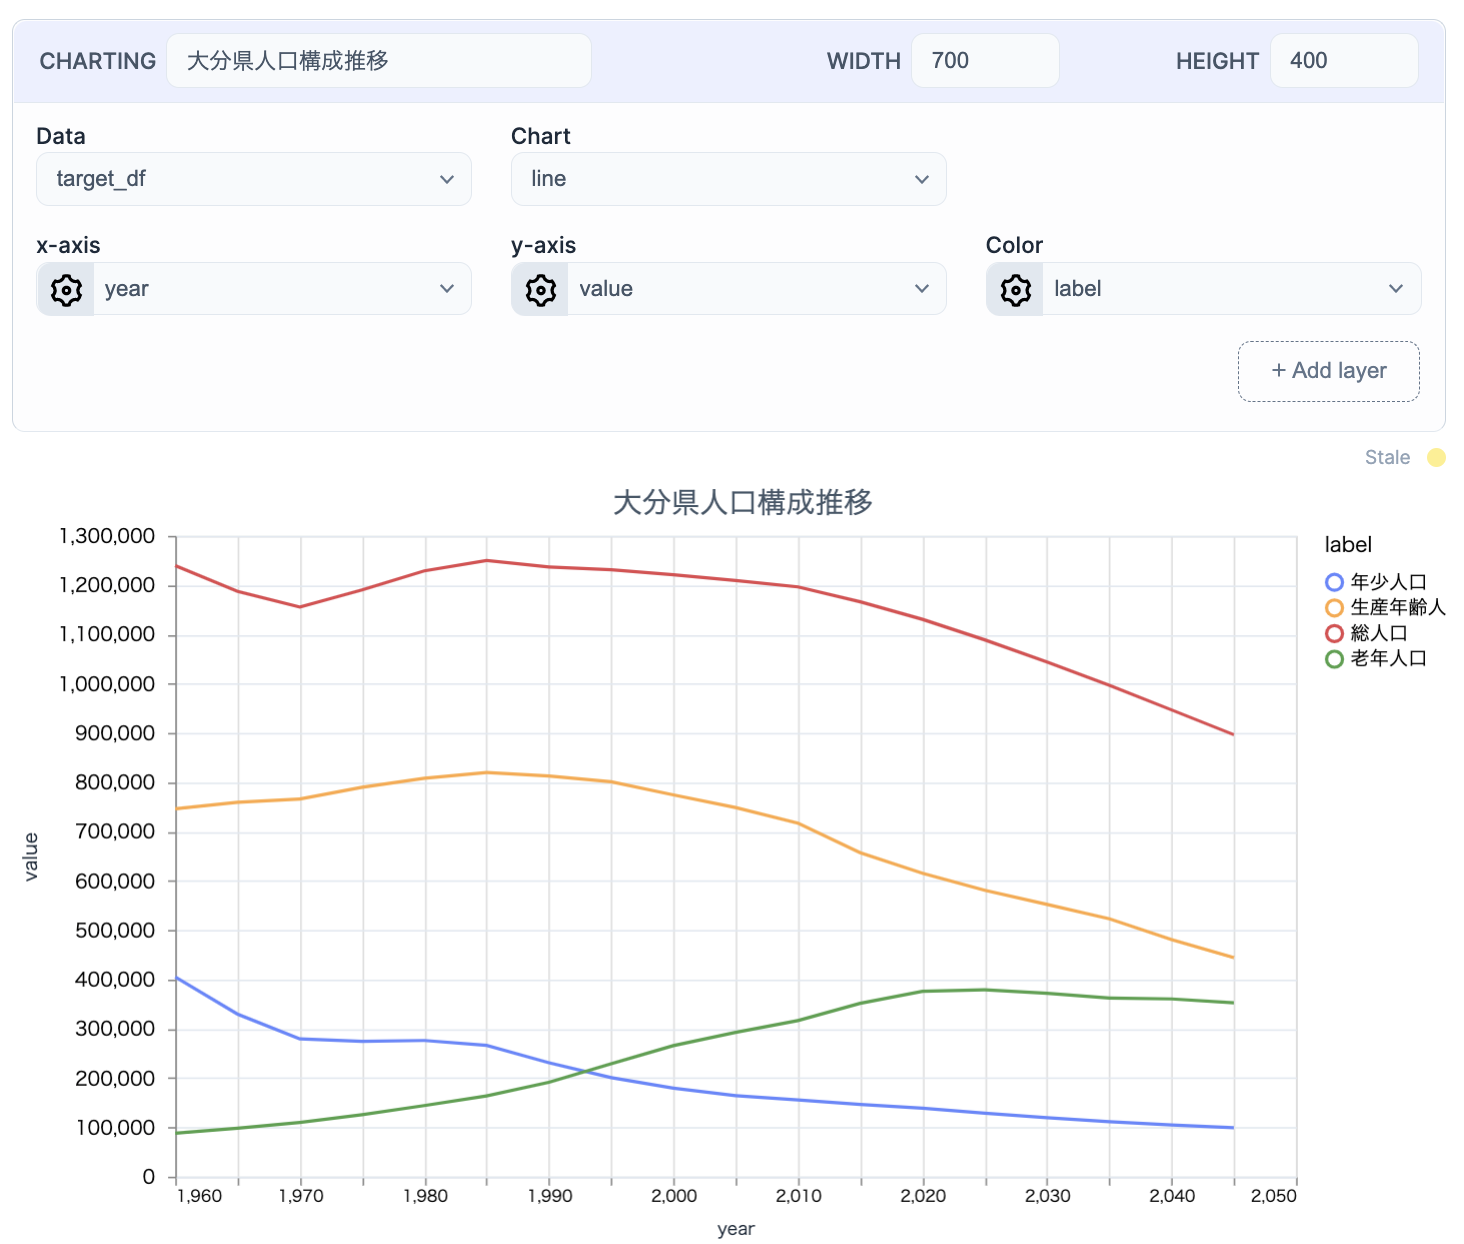
大分県の一人当たり地方税推移を見てみましょう
target_df = DataFrame.filter_with(local_tax_df, &Series.equal(&1["prefCode"], oita_pref_code))
Smart Cells の Chart を使います
2009 年から 2014 年に落ち込み、 2015 年以降は上昇しています
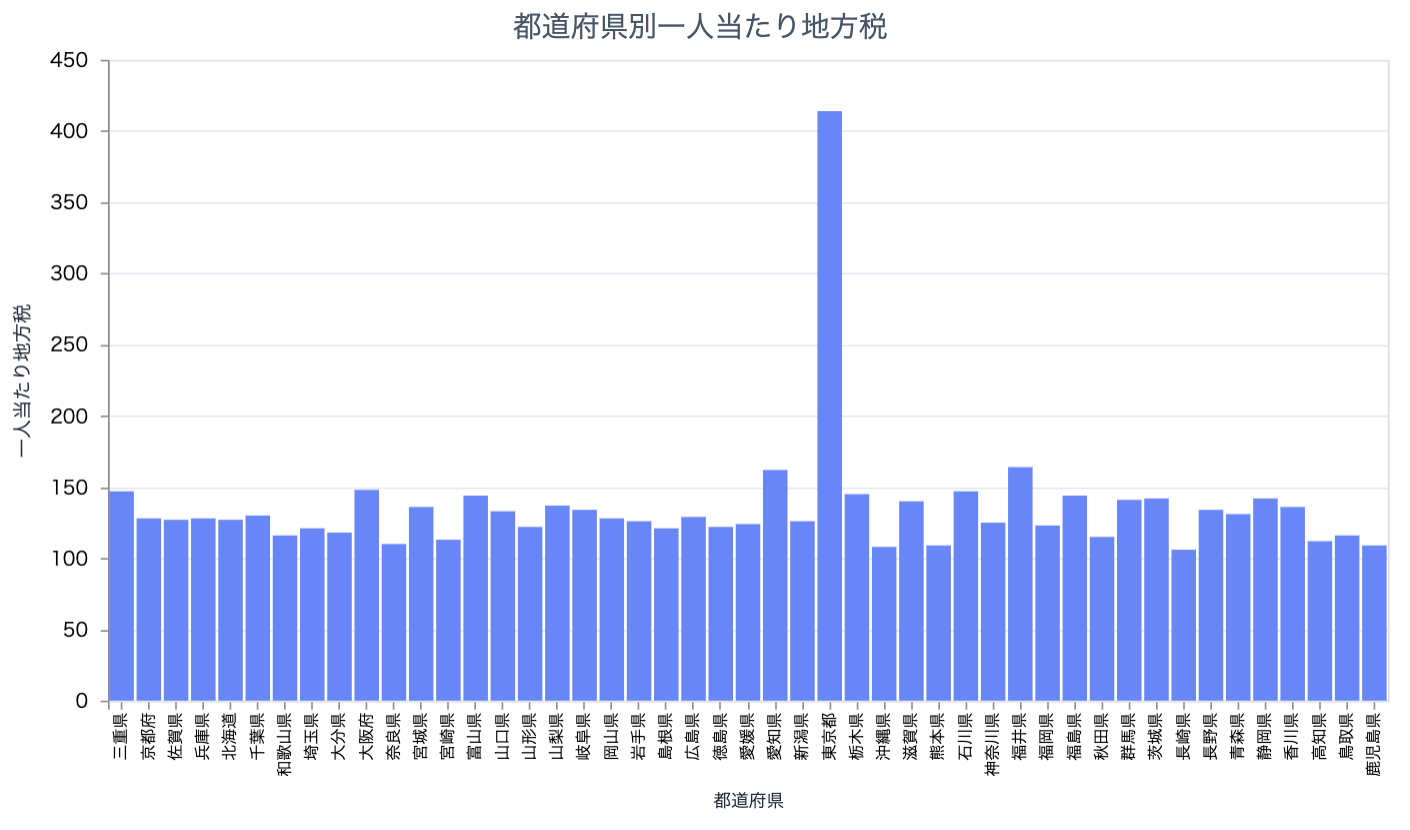
2019 年の全国の一人当たり地方税を見てみましょう
local_tax_df
|> DataFrame.filter_with(&Series.equal(&1["year"], 2019))
|> prefectures_bar.("value", "一人当たり地方税")
東京が突出して高いのが分かります
人口構成の取得
産業構造と人口構成の関係も見てみましょう
get_population_composition = fn pref_code ->
  query = "?prefCode=#{pref_code}&cityCode=-"

  url = "#{base_url}/api/v1/population/composition/perYear#{query}"

  url
  |> HTTPoison.get!([auth_header])
  |> then(&JSON.decode!(&1.body))
  |> then(& &1["result"]["data"])
end
population_composition_df =
  prefectures_df
  |> DataFrame.pull("prefCode")
  |> Series.to_list()
  |> Enum.flat_map(fn pref_code ->
    pref_code
    |> get_population_composition.()
    |> Enum.flat_map(fn data ->
      data["data"]
      |> Enum.map(fn datum ->
        Map.merge(datum, %{"label" => data["label"], "prefCode" => pref_code})
      end)
    end)
  end)
  |> DataFrame.new()
  |> DataFrame.join(prefectures_df)

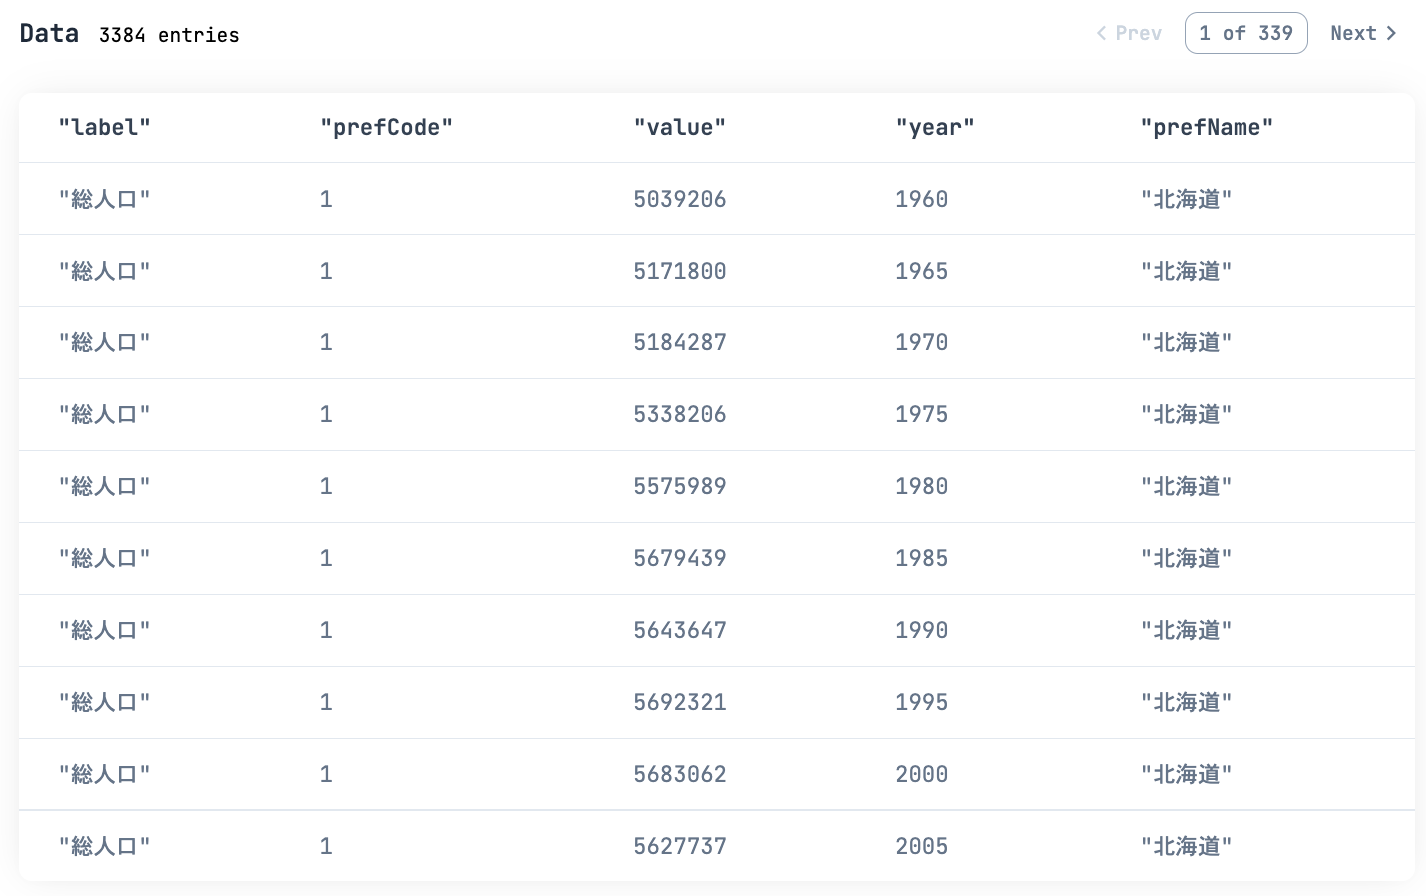
population_composition_df
|> Kino.DataTable.new(sorting_enabled: true)
前回と同じではありますが、大分県の人口構成推移です
target_df =
  population_composition_df
  |> DataFrame.filter_with(&Series.equal(&1["prefCode"], oita_pref_code))
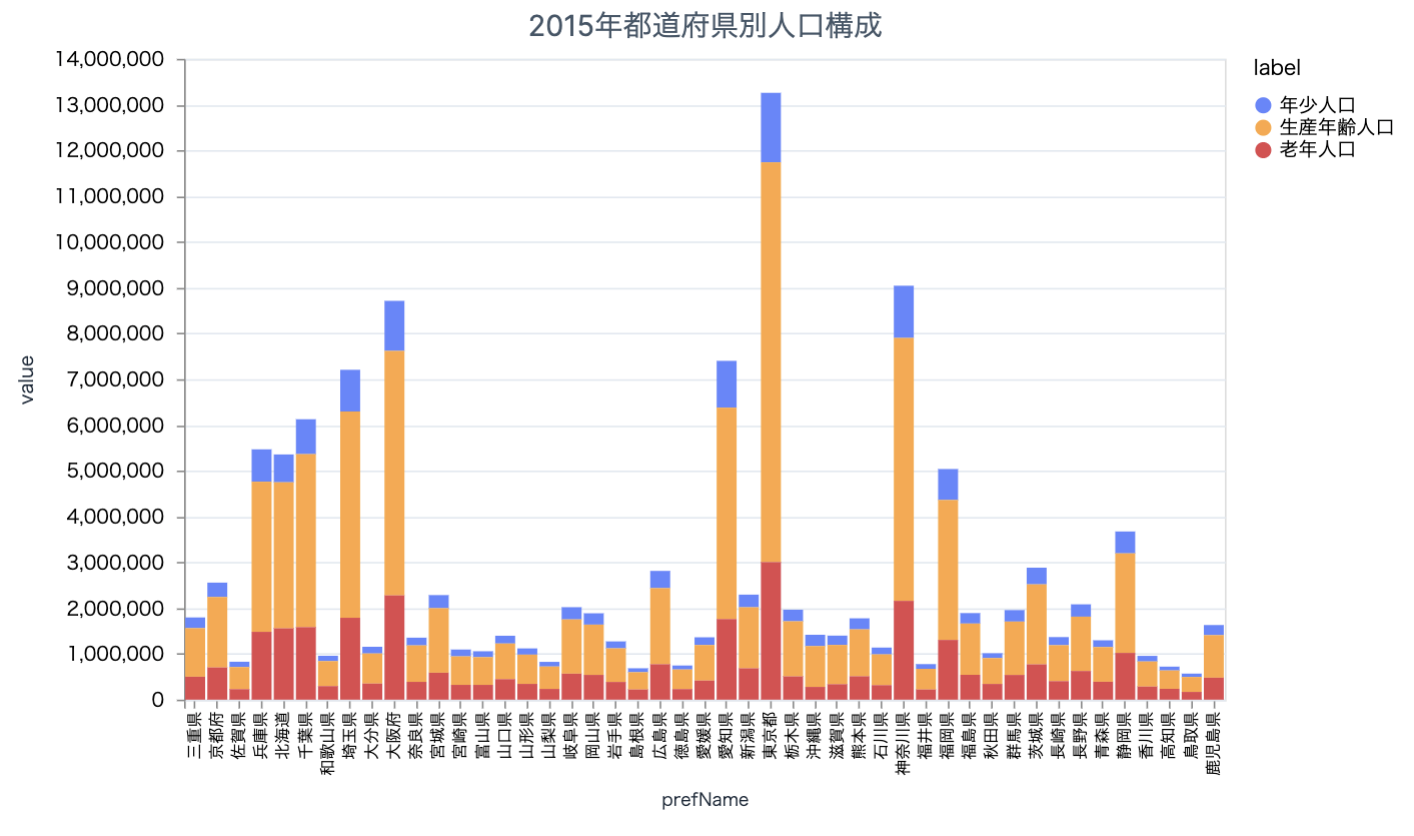
全都道府県の 2015 年時点の人口構成を見てみましょう
target_df =
  population_composition_df
  |> DataFrame.filter_with(&Series.equal(&1["year"], 2015))
  |> DataFrame.filter_with(&Series.not_equal(&1["label"], "総人口"))
東京、神奈川、大阪の人口が多いですね
人口構成データを産業構造データと同じ都道府県毎のデータにするため 2015 年に絞ってピボットします
また、人口構成を数値化するため、老年率を計算します
population_df =
  population_composition_df
  |> DataFrame.filter_with(&Series.equal(&1["year"], 2015))
  |> DataFrame.mutate(value: &Series.cast(&1["value"], :float))
  |> DataFrame.select(["prefCode", "prefName", "label", "value"])
  |> DataFrame.pivot_wider("label", "value")
  |> DataFrame.mutate_with(fn df ->
    [
      老年率: Series.divide(df["老年人口"], df["総人口"])
    ]
  end)

population_df
|> Kino.DataTable.new(sorting_enabled: true)
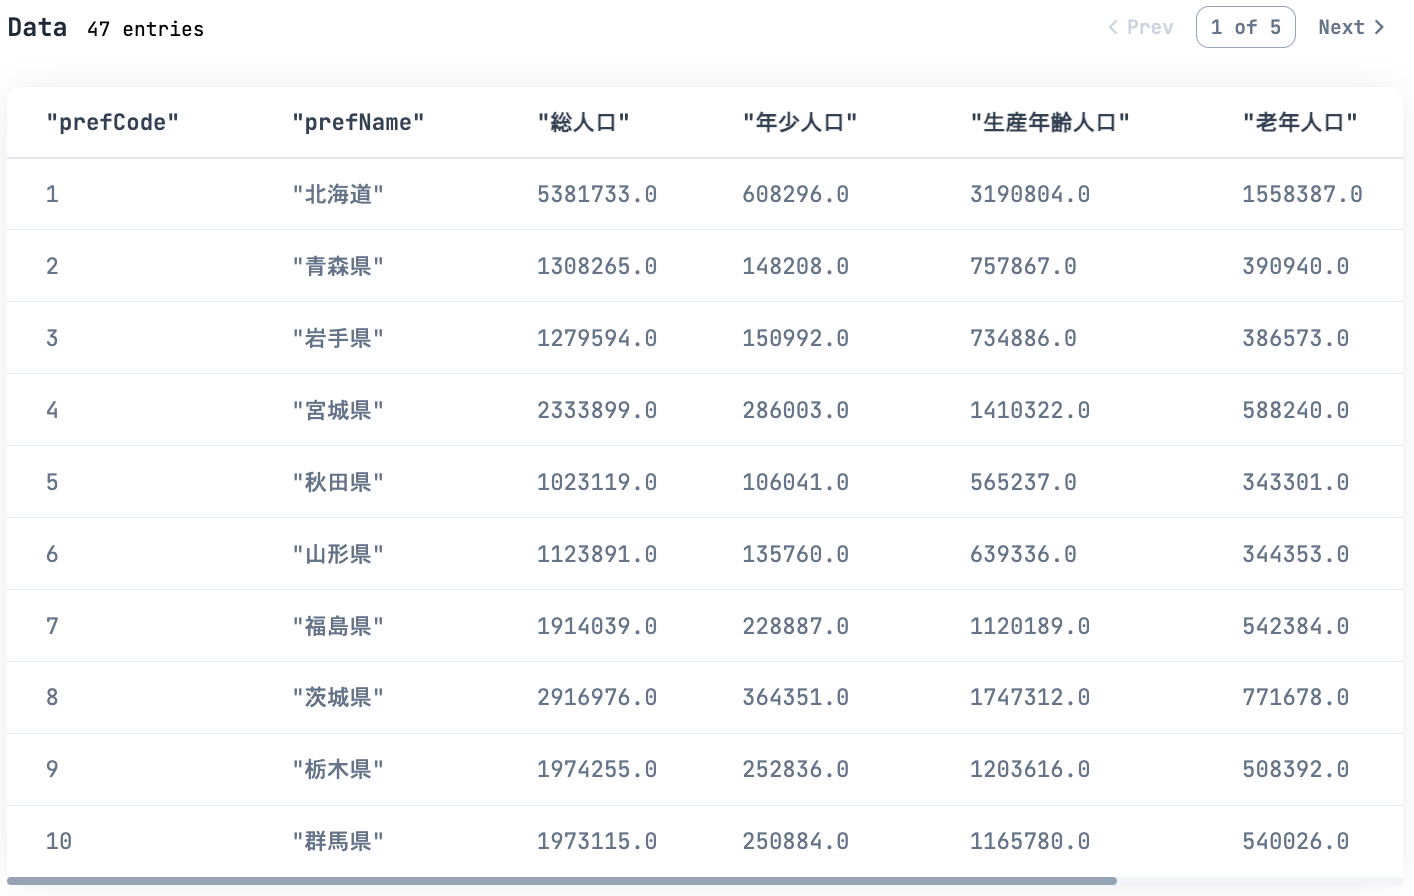
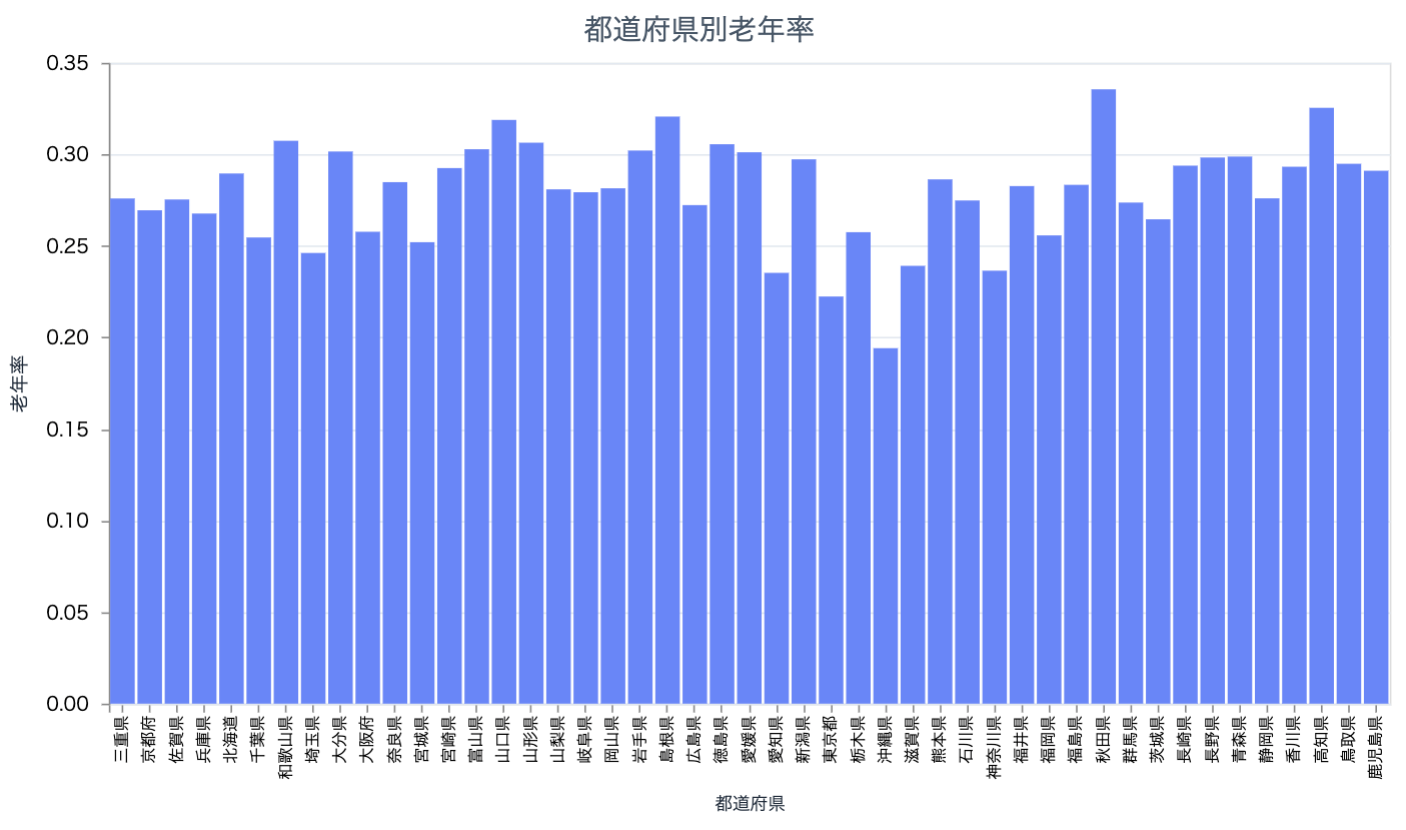
都道府県別の老年率を見てみましょう
population_df
|> prefectures_bar.("老年率", "老年率")
秋田が高く、沖縄が低いです
相関係数の取得
明確に相関を表すため、相関係数を算出します
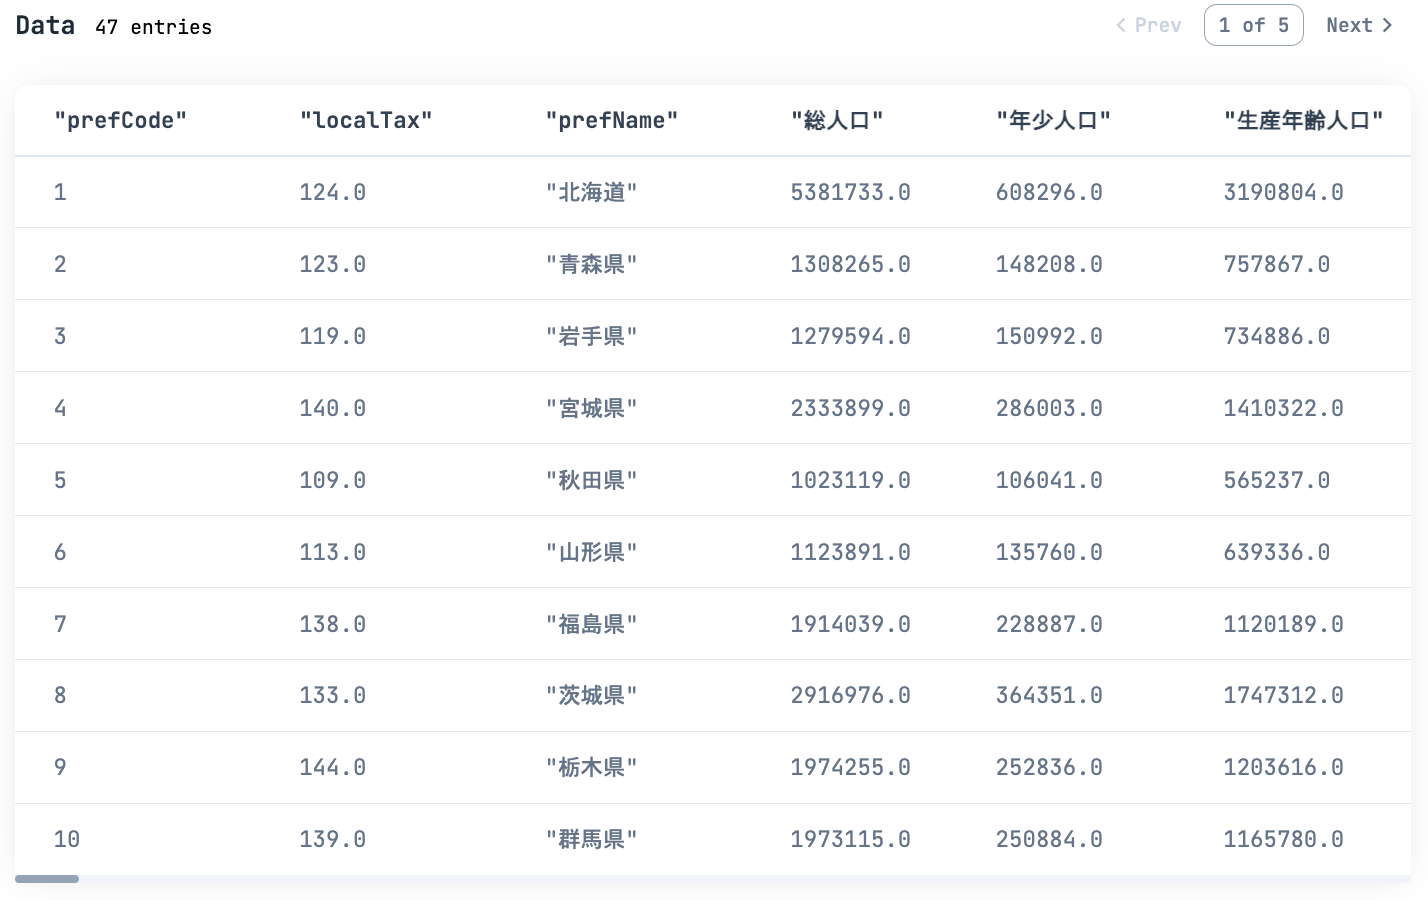
産業構造、地方税、人口構成のデータを結合します
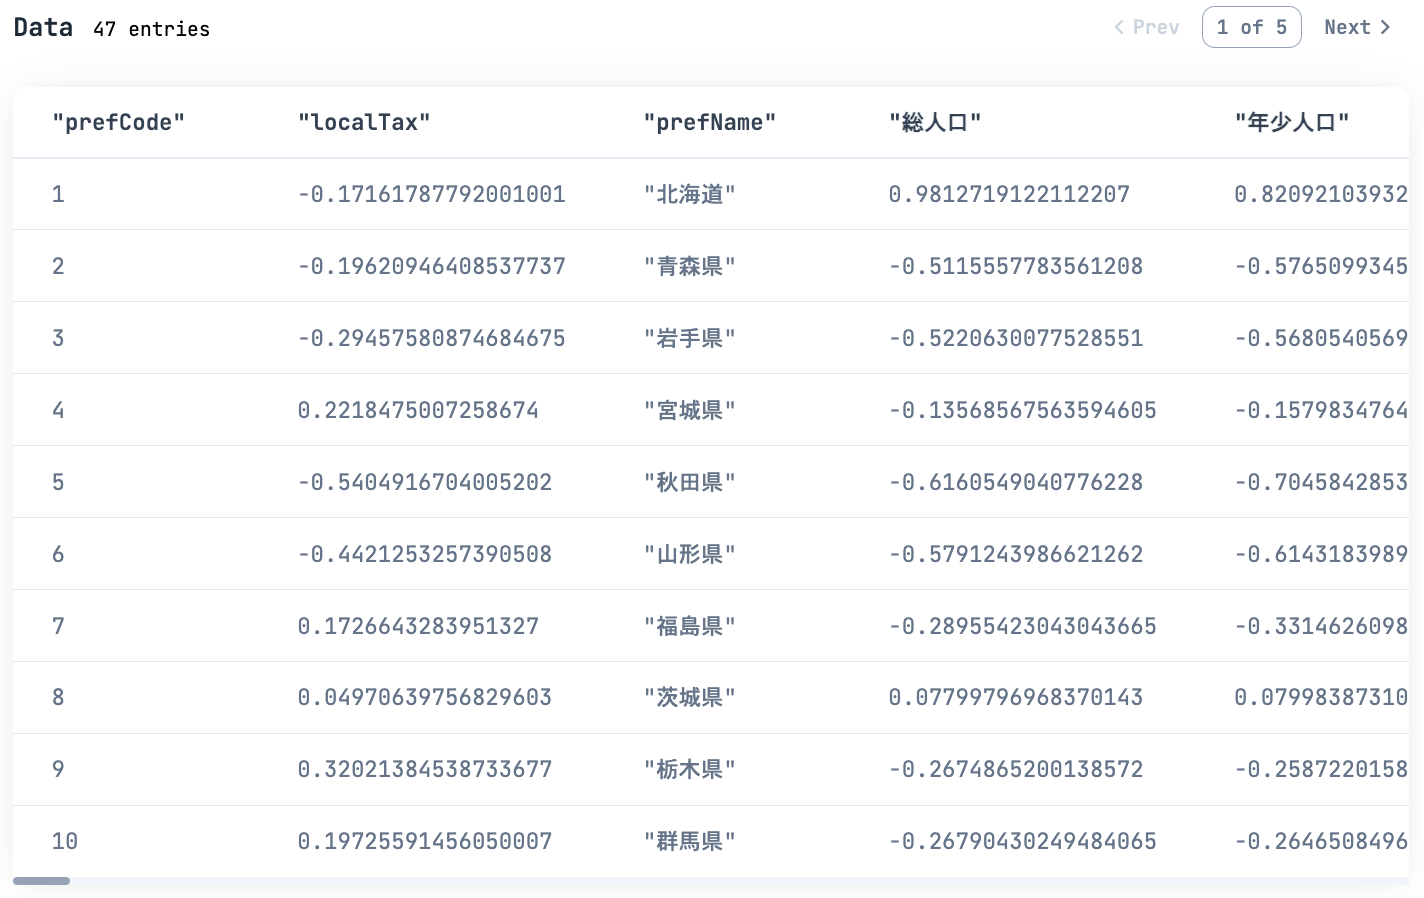
target_df =
  local_tax_df
  |> DataFrame.filter_with(&Series.equal(&1["year"], 2015))
  |> DataFrame.mutate(value: &Series.cast(&1["value"], :float))
  |> DataFrame.select(["prefCode", "value"])
  |> DataFrame.rename(["prefCode", "localTax"])
  |> DataFrame.join(population_df)
  |> DataFrame.join(pivot_df)

target_df
|> Kino.DataTable.new(sorting_enabled: true)
いくつか散布図を見てみましょう
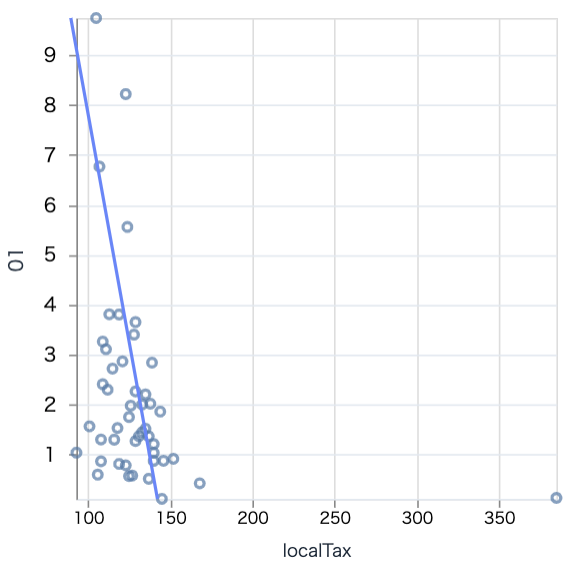
農業と地方税
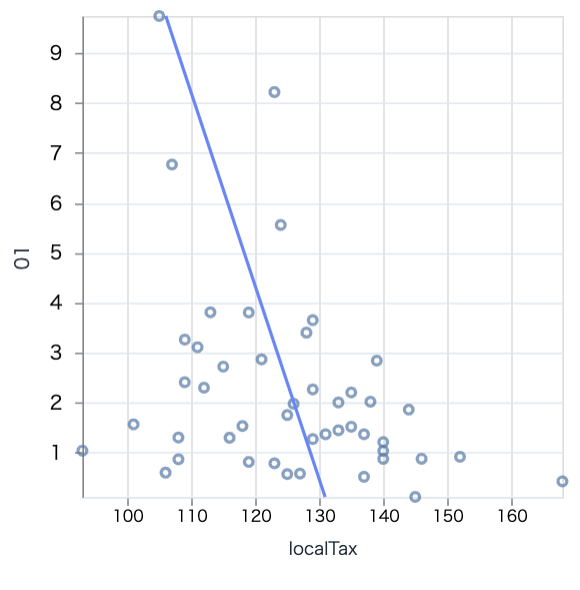
scatter.(target_df, "localTax", "01", 300)
右下の東京が地方税で突出しているため、全体が見えにくいです
東京を外れ値として除外して表示しましょう
target_df
|> DataFrame.filter_with(&Series.not_equal(&1["prefCode"], 13))
|> scatter.("localTax", "01", 300)
見やすくなりましたが、点がバラバラなので相関はなさそうです
地方税と総人口で見てみます
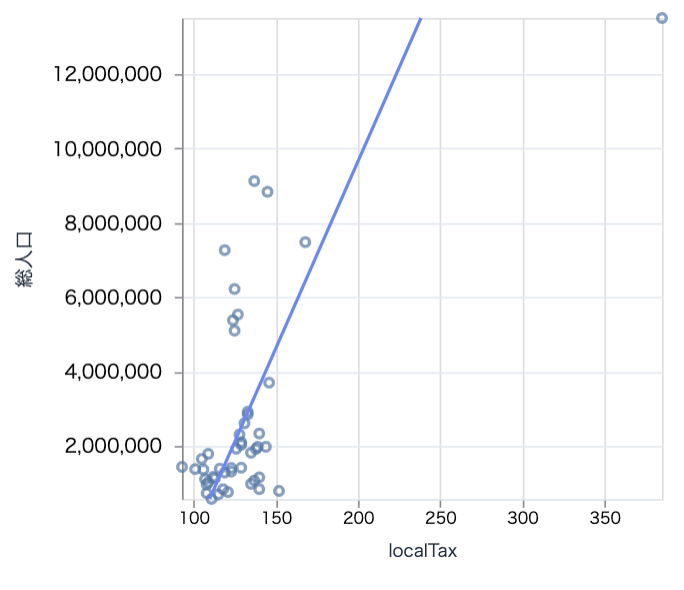
scatter.(target_df, "localTax", "総人口", 300)
これまた右上に東京が突出しています
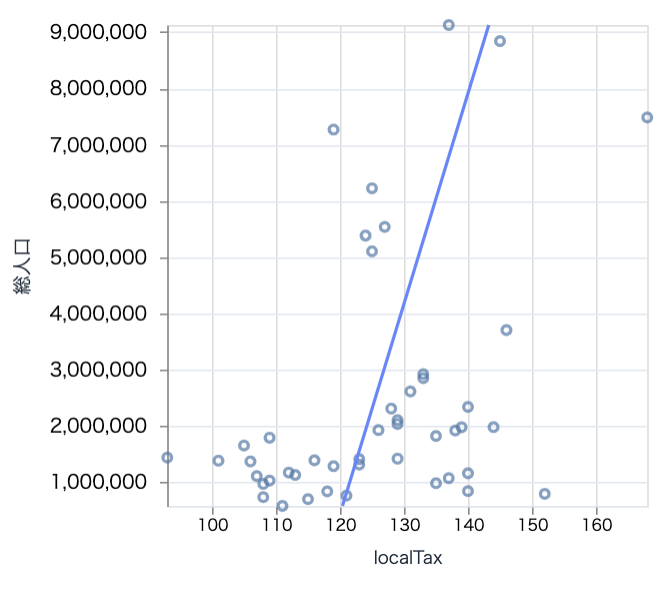
東京以外で見てみましょう
target_df
|> DataFrame.filter_with(&Series.not_equal(&1["prefCode"], 13))
|> scatter.("localTax", "総人口", 300)
これもそんなに相関がなさそうです
以前やったのと同じように相関行列を計算します
相関行列に含ませる列を指定します
cols =
  prefectures_industry_power_df
  |> DataFrame.distinct(["simcCode"])
  |> DataFrame.pull("simcCode")
  |> Series.to_list()

cols = ["localTax", "総人口", "年少人口", "生産年齢人口", "老年人口", "老年率"] ++ cols
データを標準化します
standardize = fn df, column ->
  mean =
    df
    |> DataFrame.pull(column)
    |> Series.mean()

  std =
    df
    |> DataFrame.pull(column)
    |> Series.std()

  df
  |> DataFrame.mutate_with(fn in_df ->
    %{column => Series.subtract(in_df[column], mean)}
  end)
  |> DataFrame.mutate_with(fn in_df ->
    %{column => Series.divide(in_df[column], std)}
  end)
end
standardized_df =
  cols
  |> Enum.reduce(target_df, fn col, df ->
    standardize.(df, col)
  end)

standardized_df
|> Kino.DataTable.new()
行列化して転置したものと内積を取ります
df_to_tensor = fn df ->
  df
  |> DataFrame.names()
  |> Enum.map(fn col ->
    standardized_df
    |> DataFrame.pull(col)
    |> Series.to_tensor()
  end)
  |> Nx.concatenate()
  |> Nx.reshape({DataFrame.n_columns(df), DataFrame.n_rows(df)})
end

standardized_tensor =
  standardized_df
  |> DataFrame.select(cols)
  |> df_to_tensor.()
  |> Nx.transpose()
covariance_tensor =
  standardized_tensor
  |> Nx.transpose()
  |> Nx.dot(standardized_tensor)
  |> Nx.divide(DataFrame.n_rows(standardized_df))
相関行列をデータフレームに変換します
add_cols_label = fn list, cols_ ->
  [{"x", cols_} | list]
end

covariance_df =
  cols
  |> Stream.with_index()
  |> Enum.map(fn {col, index} ->
    {col, Nx.to_flat_list(covariance_tensor[index])}
  end)
  |> add_cols_label.(cols)
  |> DataFrame.new()

covariance_df
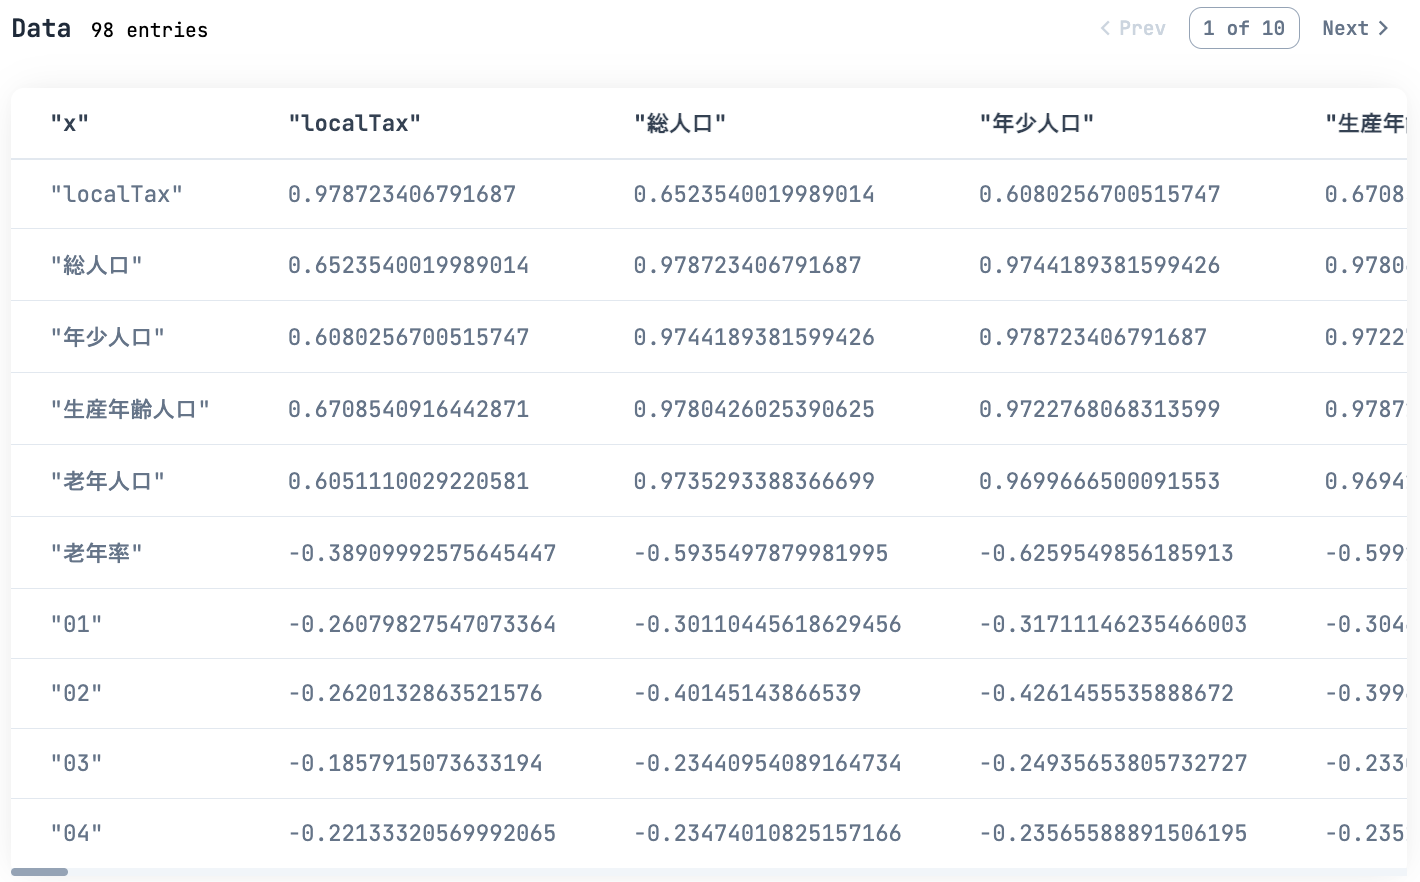
|> Kino.DataTable.new(keys: ["x" | cols])
地方税との相関係数をヒートマップ化します
local_tax_heatmap =
  cols
  |> Stream.with_index()
  |> Enum.map(fn {col_1, index_1} ->
    covariance =
      covariance_tensor[0][index_1]
      |> Nx.to_number()

    %{
      x: "localTax",
      y: col_1,
      covariance: covariance
    }
  end)
  |> List.flatten()
Vl.new(width: 100, height: 1600)
|> Vl.data_from_values(local_tax_heatmap)
|> Vl.mark(:rect)
|> Vl.encode_field(:x, "x", type: :nominal)
|> Vl.encode_field(:y, "y", type: :nominal)
|> Vl.encode_field(
  :fill,
  "covariance",
  type: :quantitative,
  scale: [
    domain: [-1, 1],
    scheme: :blueorange
  ]
)
赤いところは正の相関が強く、青いところは負の相関が強いです
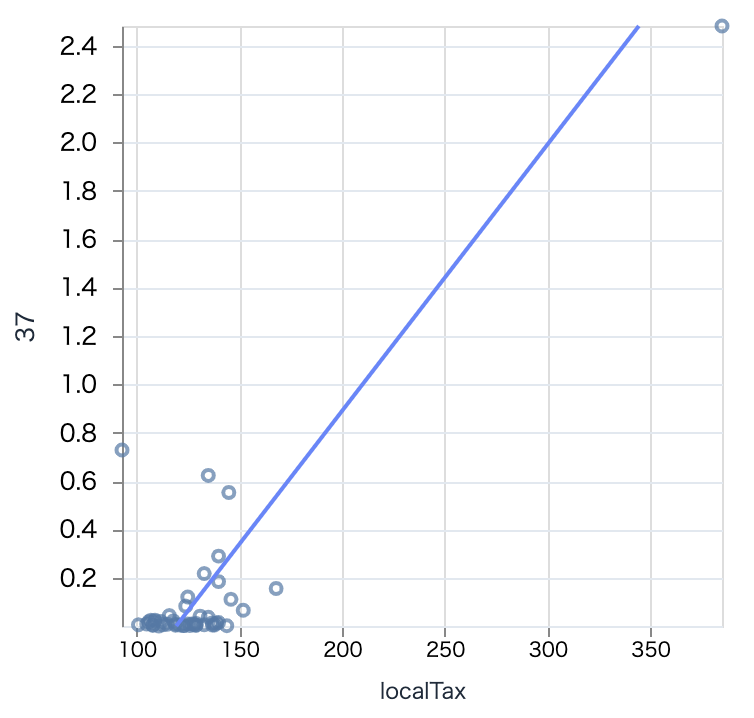
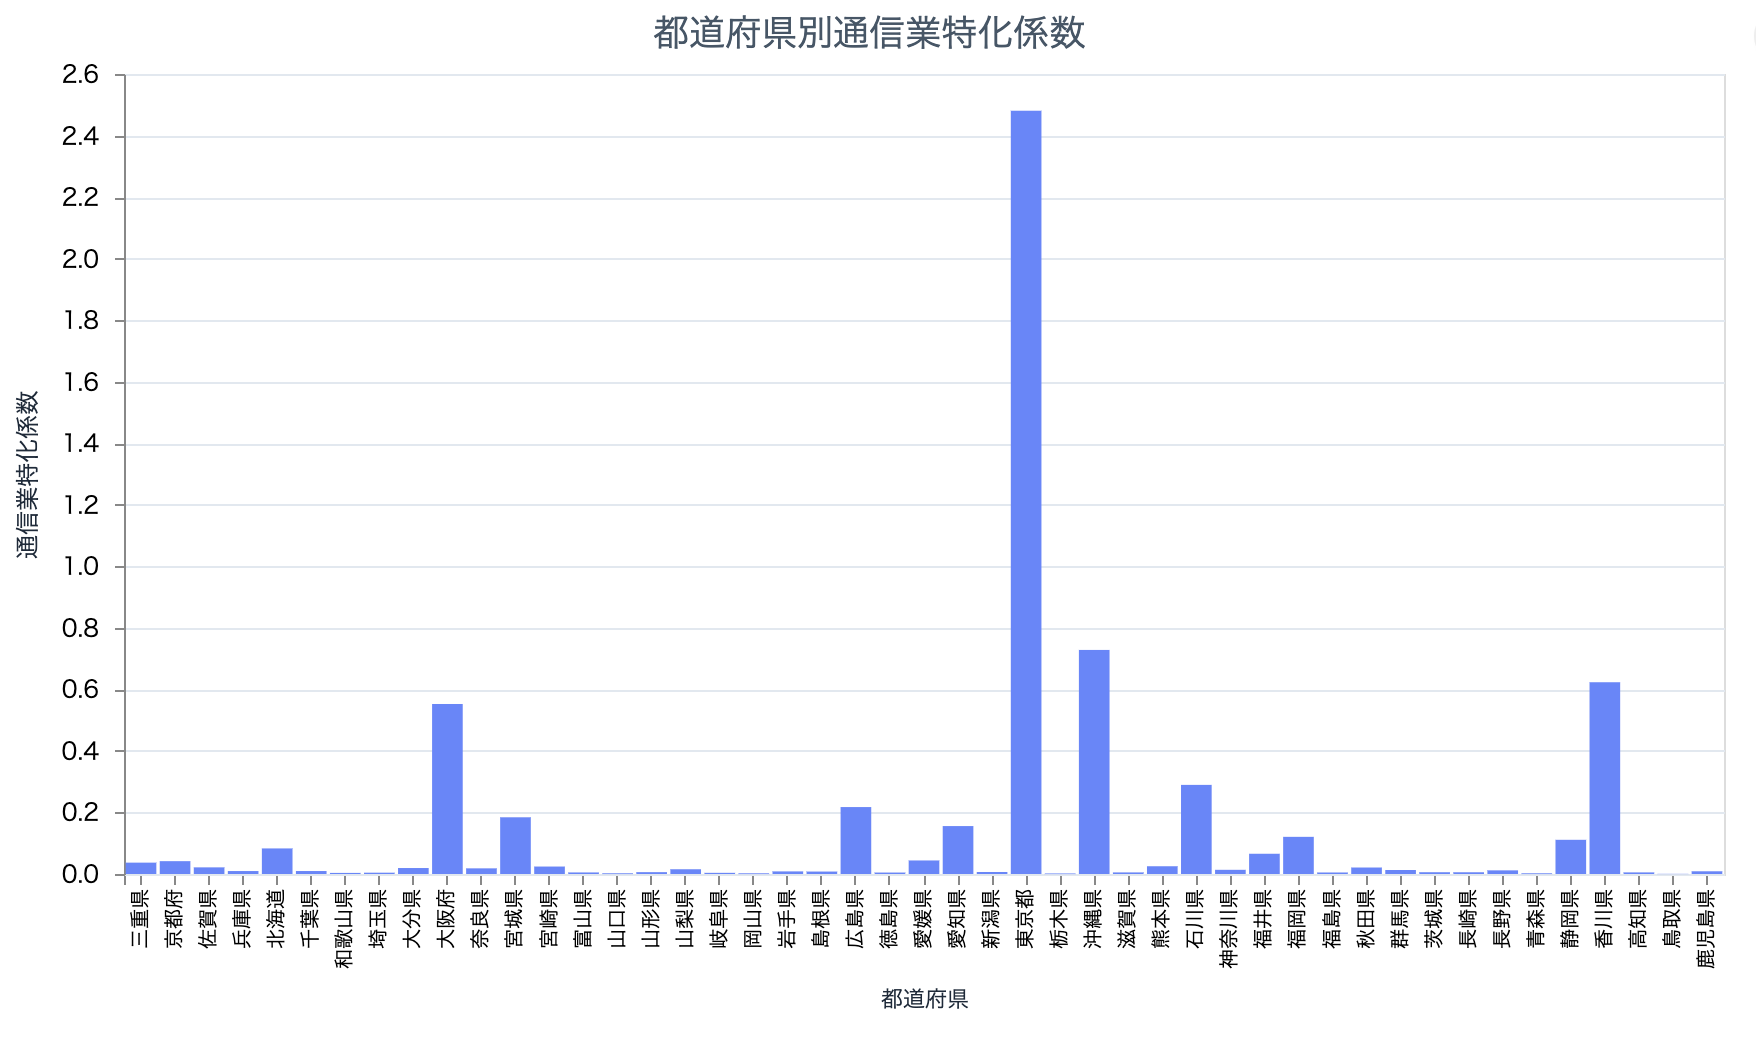
中分類コード 37 通信業の相関は強そうです
散布図を見てみましょう
# 通信業
target_df
|> scatter.("localTax", "37", 300)
通信業は東京一強なので、相関が強くなっているようです
prefectures_industry_bar.("37")
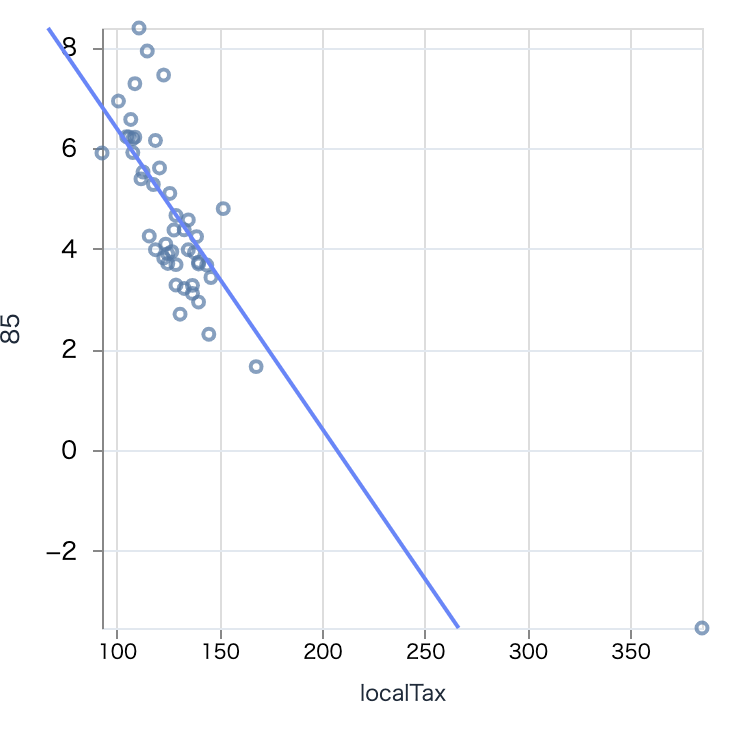
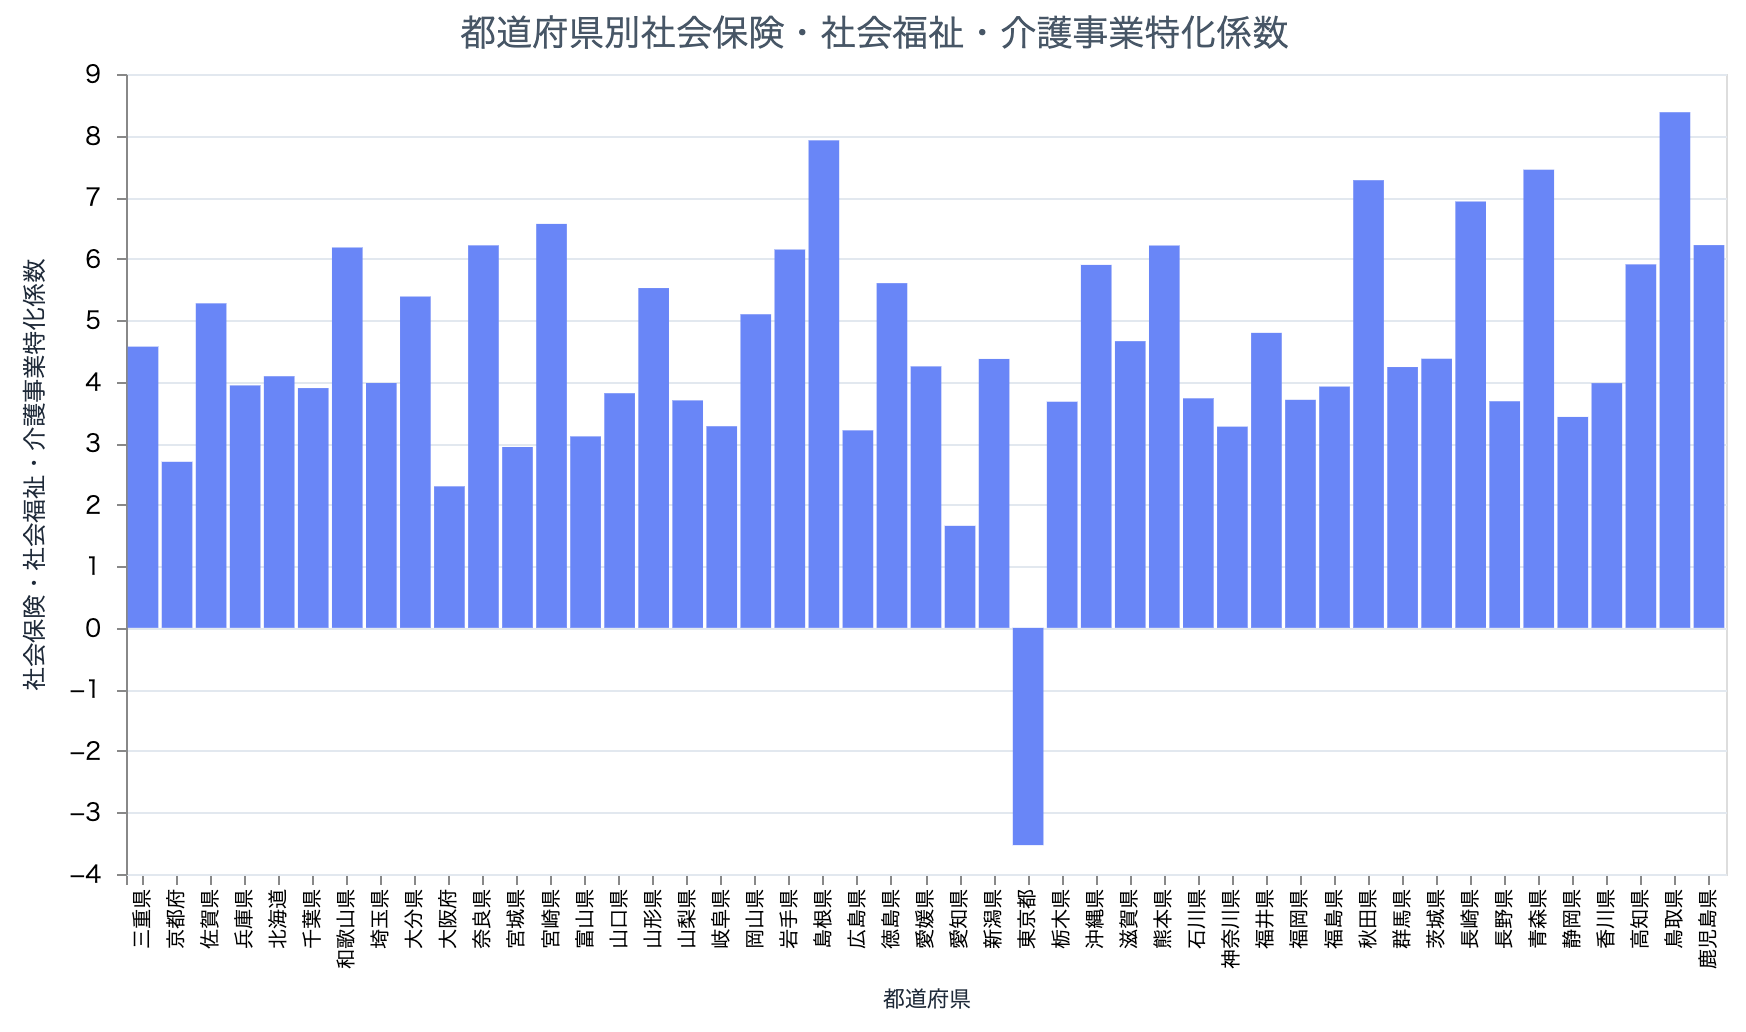
逆に社会保険・社会福祉・介護事業は真っ青です
# 社会保険・社会福祉・介護事業
target_df
|> scatter.("localTax", "85", 300)
prefectures_industry_bar.("85")
お金を稼いでいる東京ですが、医療や福祉では全く稼げていないことが分かります
続いて老齢率の相関ヒートマップも見てみましょう
elderly_heatmap =
  cols
  |> Stream.with_index()
  |> Enum.map(fn {col_1, index_1} ->
    covariance =
      covariance_tensor[5][index_1]
      |> Nx.to_number()

    %{
      x: "老年率",
      y: col_1,
      covariance: covariance
    }
  end)
  |> List.flatten()
Vl.new(width: 100, height: 1600)
|> Vl.data_from_values(elderly_heatmap)
|> Vl.mark(:rect)
|> Vl.encode_field(:x, "x", type: :nominal)
|> Vl.encode_field(:y, "y", type: :nominal)
|> Vl.encode_field(
  :fill,
  "covariance",
  type: :quantitative,
  scale: [
    domain: [-1, 1],
    scheme: :blueorange
  ]
)
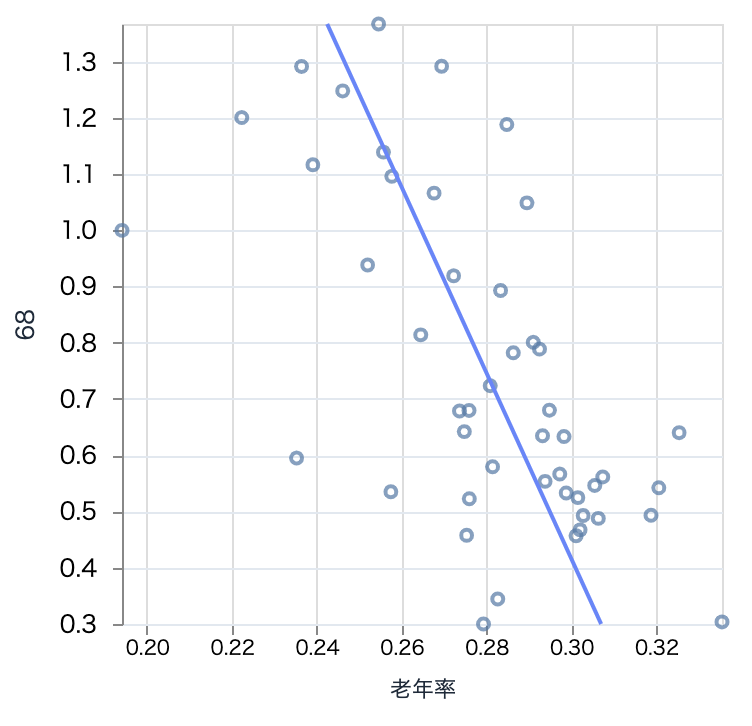
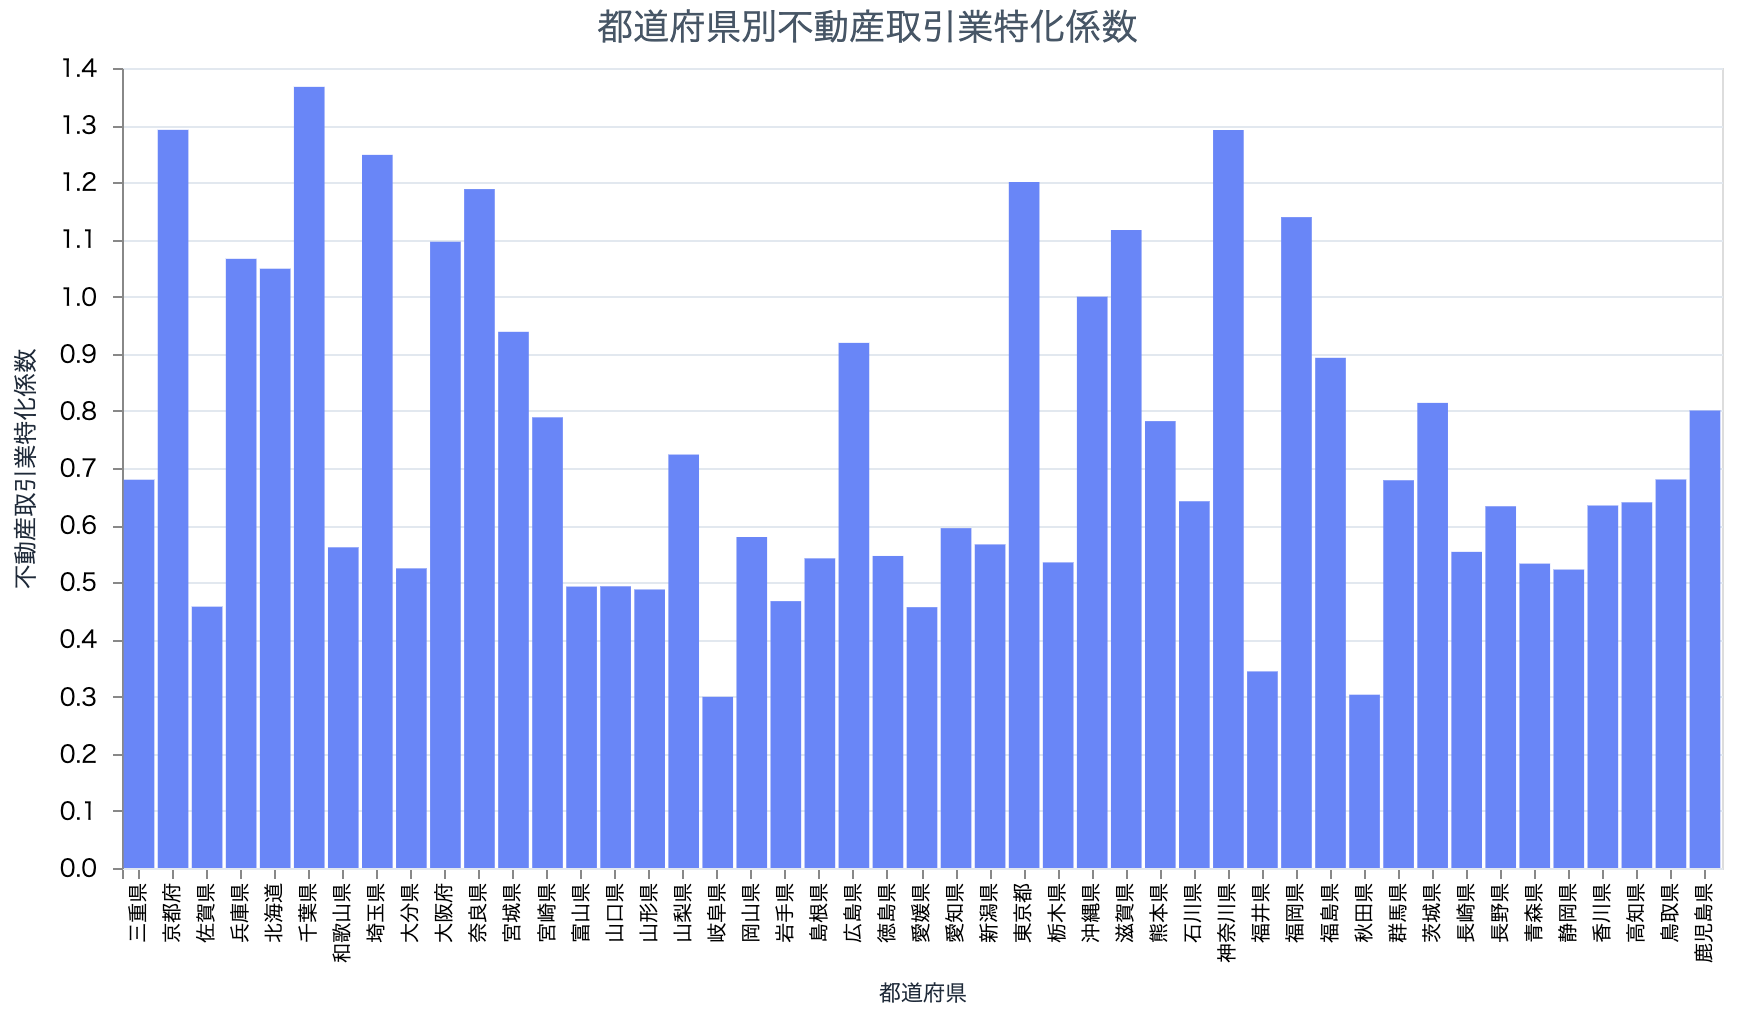
そんなに相関が強いものはなく、不動産取引で負の相関があるくらいでしょうか
# 不動産取引業
target_df
|> scatter.("老年率", "68", 300)
prefectures_industry_bar.("68")
お年寄りが多いと、あまり引っ越しをしない、ということでしょうか
まとめ
RESAS には他にもいろいろな API があるので、色々なデータの組み合わせを見ると面白そうです
