はじめに
Livebook でデータ分析したい!
データの傾向を見るために散布図が見たい!
ついでに回帰直線も見たい!
という人向けの記事です
動作環境
以下のリポジトリーのコンテナ上で Livebook を動かしています
セットアップ
Livebook でグラフを扱うため、 Kino.VegaLite をインストールします
Mix.install([
  {:kino_vega_lite, "~> 0.1"}
])
エイリアスをつけます
alias VegaLite, as: Vl
データの準備
可視化したいデータを用意します
本記事では、以下のようなデータを使います
x = [1, 2, 3, 4, 5, 6, 7]
y = [0.9, 1.8, 3.3, 3.7, 4.5, 6.1, 7.2]
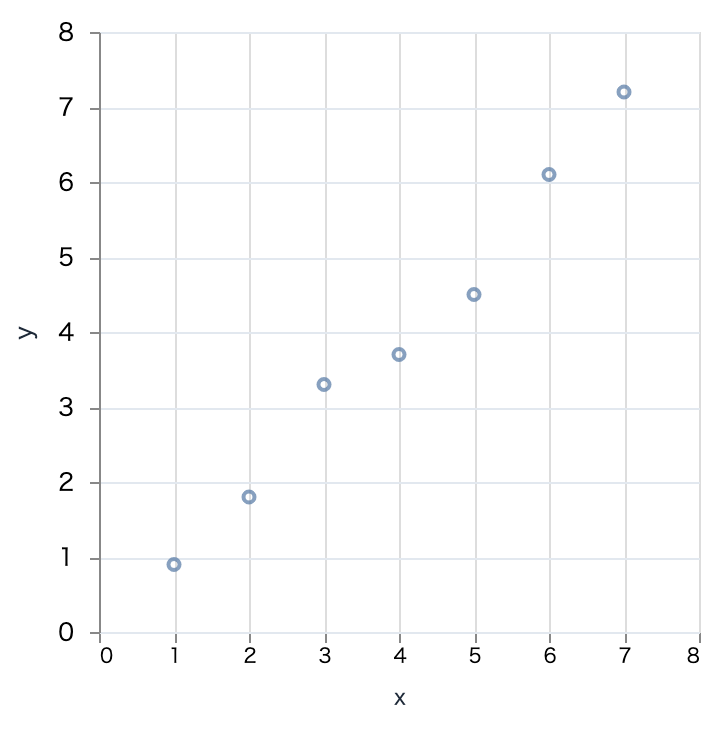
散布図の表示
x と y の散布図は以下の様にして表示します
# グラフのサイズを指定
Vl.new(width: 300, height: 300)
# データを x と y から取得する
|> Vl.data_from_values(x: x, y: y)
# x は連続する数値データで 0 から 8 の範囲を表示する
|> Vl.encode_field(:x, "x",
  type: :quantitative,
  scale: [domain: [0, 8]]
)
# y は連続する数値データで 0 から 8 の範囲を表示する
|> Vl.encode_field(:y, "y",
  type: :quantitative,
  scale: [domain: [0, 8]]
)
# 散布図を表示する
|> Vl.mark(:point)
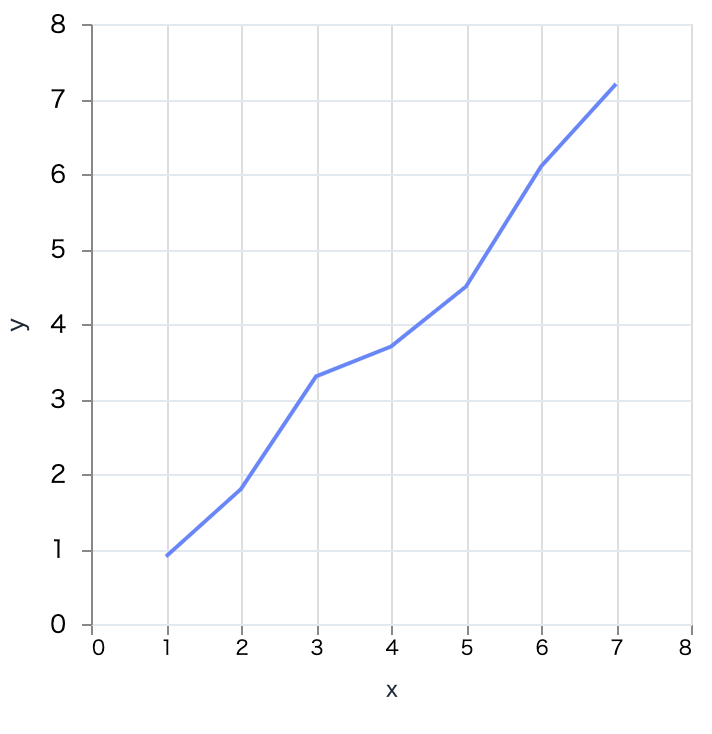
回帰直線の表示
x と y の線グラフは以下のようにして表示します
# グラフのサイズを指定
Vl.new(width: 300, height: 300)
# データを x と y から取得する
|> Vl.data_from_values(x: x, y: y)
# x は連続する数値データで 0 から 8 の範囲を表示する
|> Vl.encode_field(:x, "x",
  type: :quantitative,
  scale: [domain: [0, 8]]
)
# y は連続する数値データで 0 から 8 の範囲を表示する
|> Vl.encode_field(:y, "y",
  type: :quantitative,
  scale: [domain: [0, 8]]
)
# 線グラフを表示する
|> Vl.mark(:line)
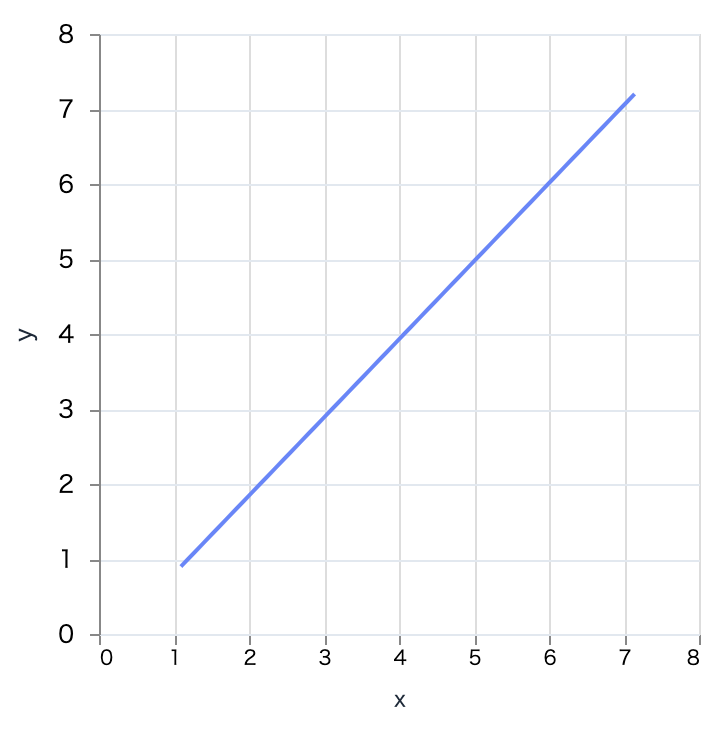
最後に Vl.transform(regression: "x", on: "y") を追加することで回帰直線になります
# グラフのサイズを指定
Vl.new(width: 300, height: 300)
# データを x と y から取得する
|> Vl.data_from_values(x: x, y: y)
# x は連続する数値データで 0 から 8 の範囲を表示する
|> Vl.encode_field(:x, "x",
  type: :quantitative,
  scale: [domain: [0, 8]]
)
# y は連続する数値データで 0 から 8 の範囲を表示する
|> Vl.encode_field(:y, "y",
  type: :quantitative,
  scale: [domain: [0, 8]]
)
# 線グラフを表示する
|> Vl.mark(:line)
# 回帰直線に変換する
|> Vl.transform(regression: "x", on: "y")
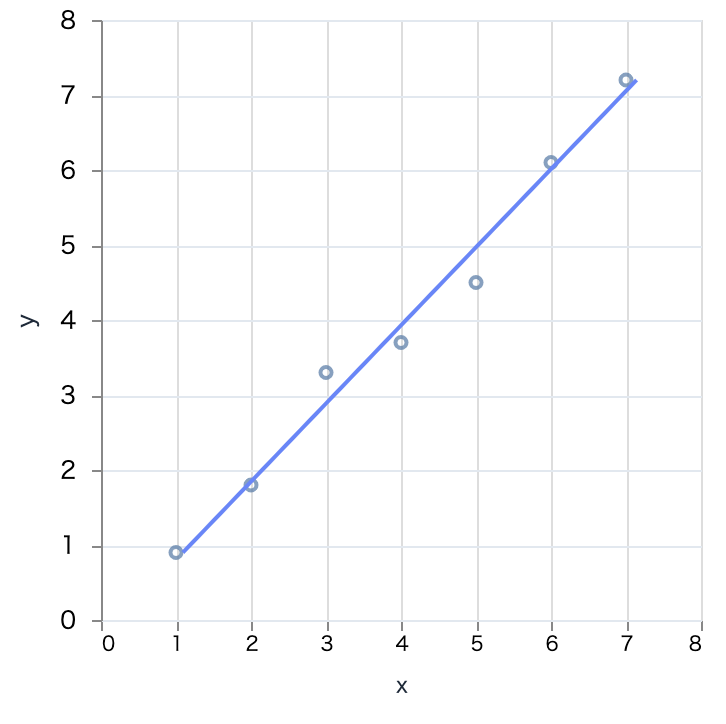
散布図と回帰直線を重ねて表示する
複数のグラフを レイヤーとして重ねて表示することが可能です
共通部分はレイヤーの外、個別部分をレイヤーの中で定義します
# グラフのサイズを指定
Vl.new(width: 300, height: 300)
# データを x と y から取得する
|> Vl.data_from_values(x: x, y: y)
# x は連続する数値データで 0 から 8 の範囲を表示する
|> Vl.encode_field(:x, "x",
  type: :quantitative,
  scale: [domain: [0, 8]]
)
# y は連続する数値データで 0 から 8 の範囲を表示する
|> Vl.encode_field(:y, "y",
  type: :quantitative,
  scale: [domain: [0, 8]]
)
|> Vl.layers([
  # 散布図を表示する
  Vl.new()
  |> Vl.mark(:point),
  Vl.new()
  # 線グラフを表示する
  |> Vl.mark(:line)
  # 回帰直線に変換する
  |> Vl.transform(regression: "x", on: "y")
])
まとめ
VegaLite は便利でキレイですね


