はじめに
前回の記事では Explorer をとりあえず使ってみました
結果として、 Python の pandas のようにデータ分析が簡単にできることが分かりました
今回はより実践的な内容として、主成分分析 = PCA をやってみたいと思います
実装したコード(Livebook)はこちら
主成分分析とは、については以下の記事を参考にしてください
参考にした記事
対象データ
今回はこちらのデータを使います
E 資格の勉強資料などでもよく使われる、ワインのデータです
3品種のワイン 178 本について、アルコール度数や色の濃さなど 13 項目の数値を計測しています
13 項目を学習するのは大変なので、 2 項目くらいに圧縮したいと思います
準備
必要なパッケージをインストールします
- Explorer: データ探索
- Kino.VegaLite: グラフ描画
- Nx: 行列計算
Mix.install([
  {:explorer, "~> 0.2.0"},
  {:kino_vega_lite, "~> 0.1.1"},
  {:nx, "~> 0.3.0-dev", github: "elixir-nx/nx", branch: "main", sparse: "nx"}
])
エイリアスを付けておきます
alias Explorer.DataFrame
alias Explorer.Series
alias VegaLite, as: Vl
データロード
Explorer はワインのデータセットを含んでいます
ダウンロードしたり整形したりしなくていいので楽です
wine_df = Explorer.Datasets.wine()
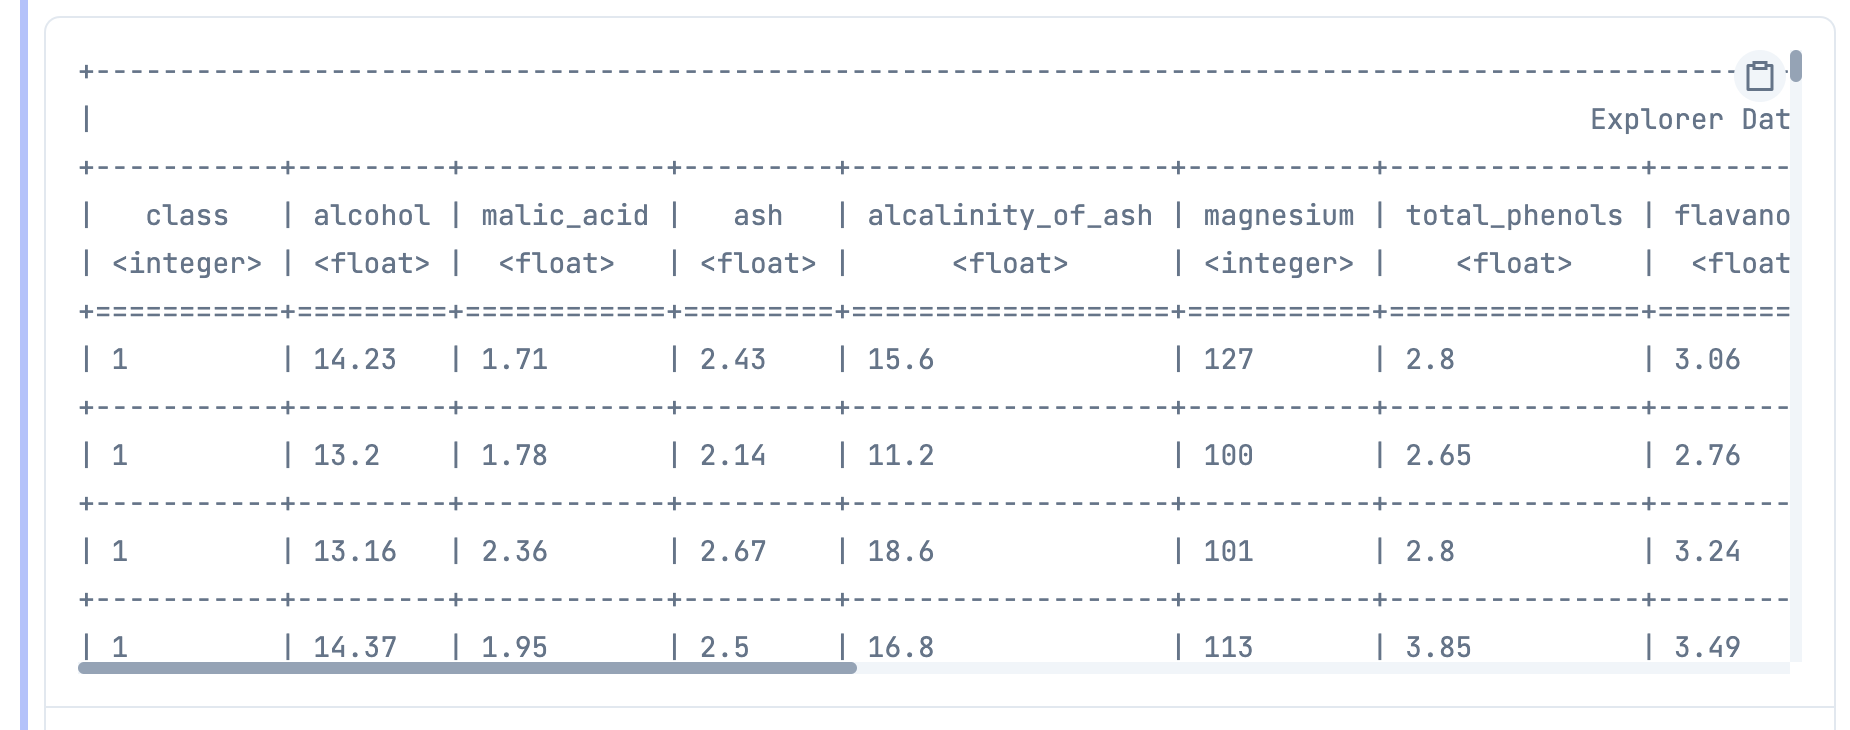
テーブル表示してみましょう
DataFrame.table(wine_df, limit: :infinity)
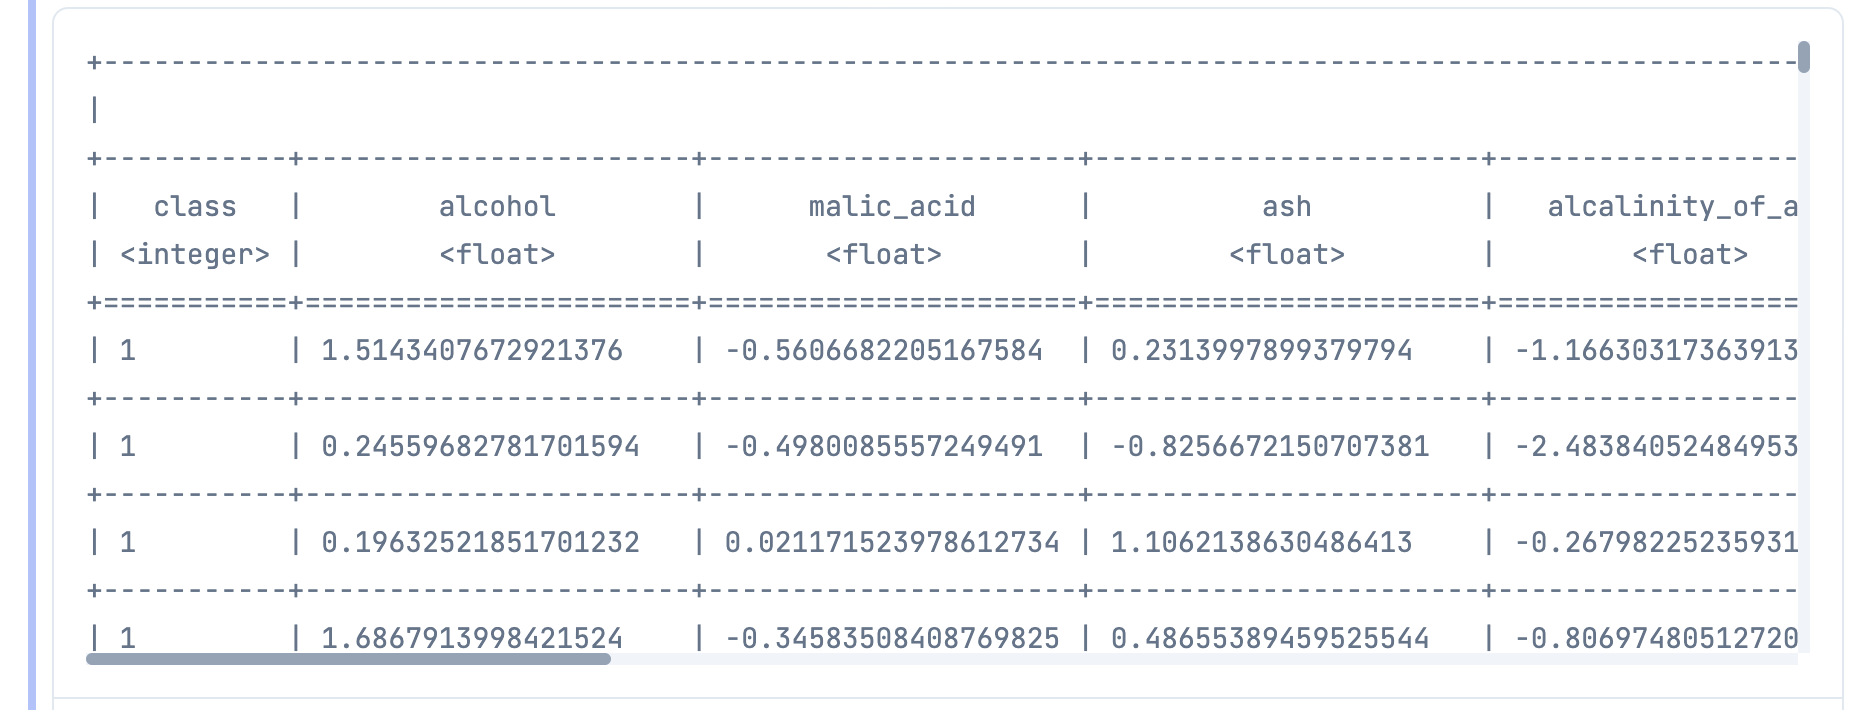
項目数が多いので表示しきれていませんが、
左端にワインの品種を示す class があり、各項目が続いています
品種が3種類であることを確認しておきましょう
wine_df
|> DataFrame.distinct(columns: ["class"])
|> DataFrame.pull("class")
この後頻繁に使うので、 class 以外の 13項目の名前を取っておきます
cols =
  wine_df
  |> DataFrame.names()
  |> Enum.filter(fn name -> name != "class" end)
統計情報の取得
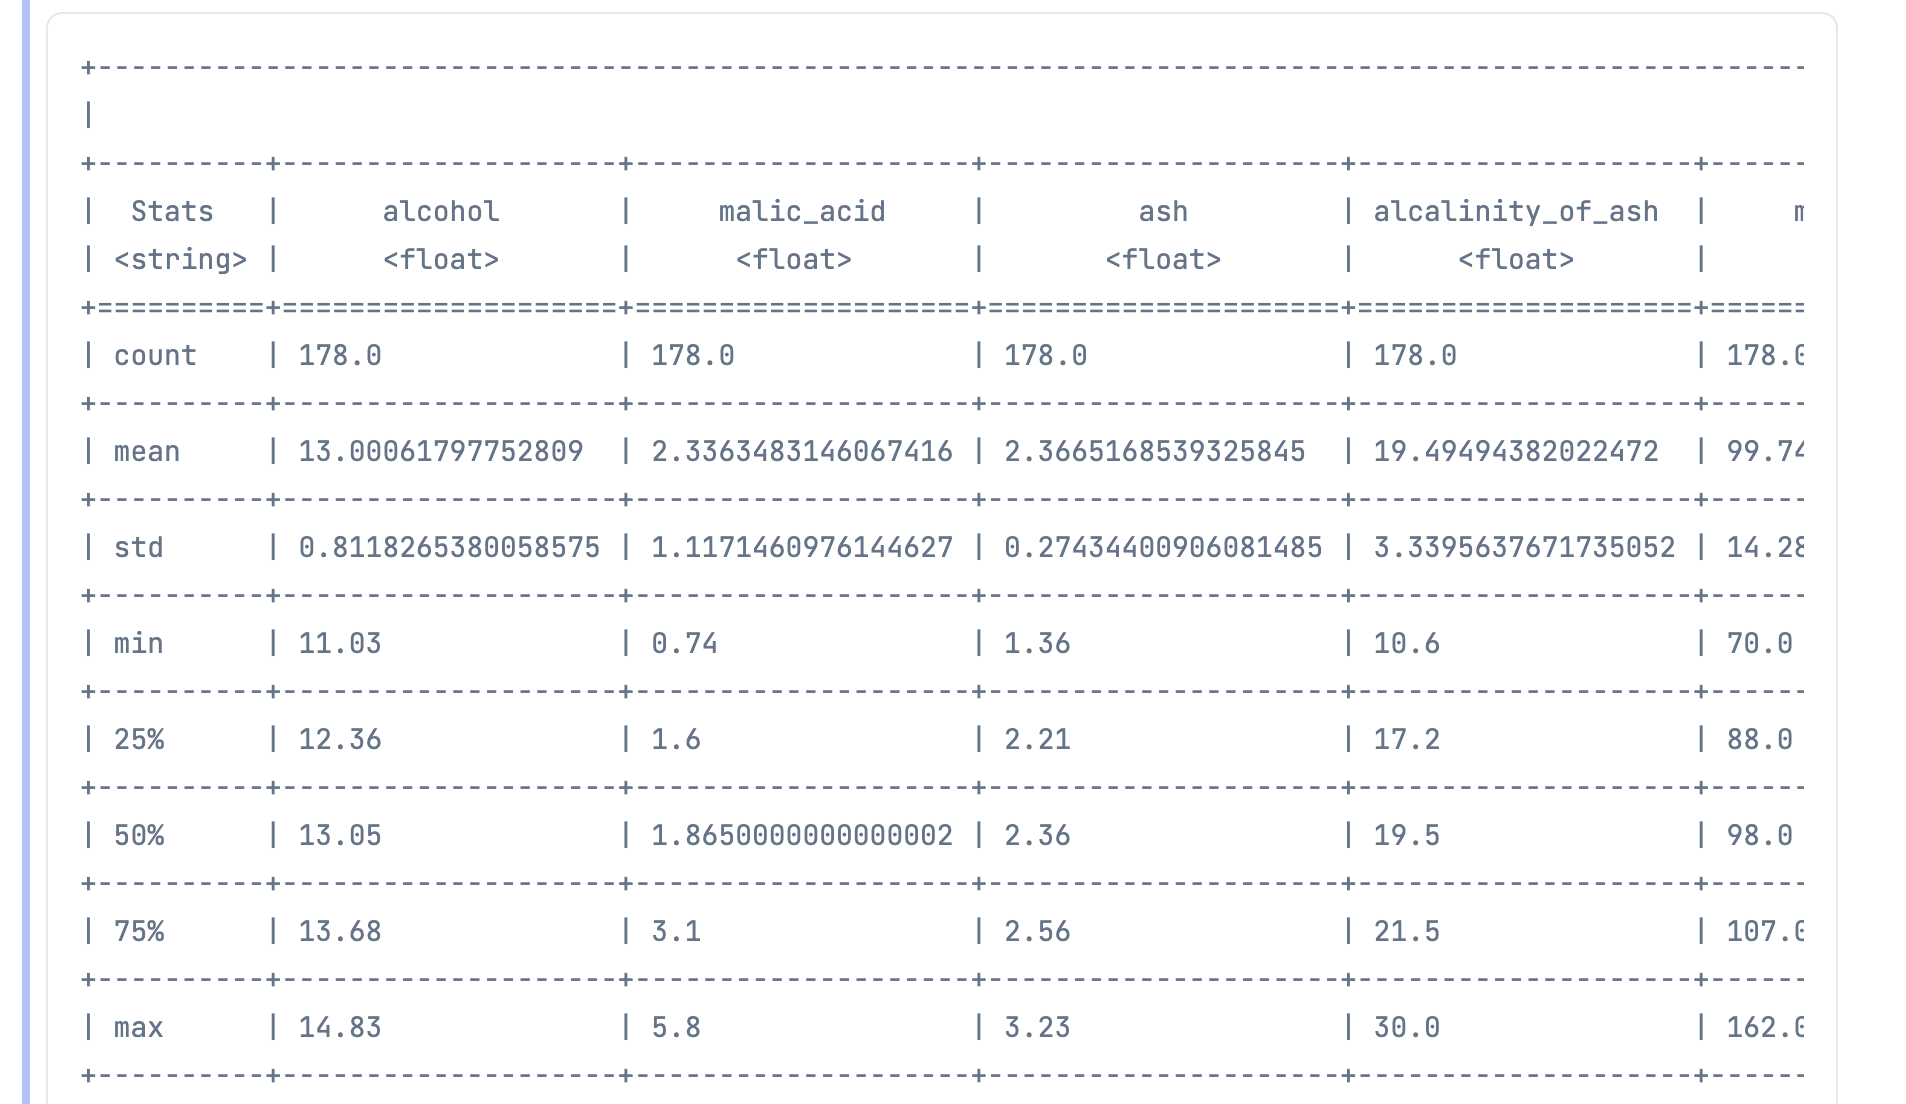
主成分分析には必要ありませんが、 pandas の describe を Explorer で再現したいと思います
主要な統計項目を取得することで、データの傾向がある程度見えます
まず、 describe で出力する各統計項目を取得する関数を定義します
- count: データ数
- mean: 平均
- std: 標準偏差
- min: 最小値
- 25%: 1/4 分位数
- 50%: 中央値
- 75%: 3/4 分位数
- max: 最大値
get_stats = fn df, col ->
  series = DataFrame.pull(df, col)

  [
    DataFrame.n_rows(df),
    Series.mean(series),
    Series.std(series),
    Series.min(series),
    Series.quantile(series, 0.25),
    Series.median(series),
    Series.quantile(series, 0.75),
    Series.max(series)
  ]
end

get_stats.(wine_df, "alcohol")
これを各列に適用します(class は連続値ではないので対象外)
add_stats_label = fn list ->
  [{"Stats", ["count", "mean", "std", "min", "25%", "50%", "75%", "max"]} | list]
end

cols
|> Enum.map(fn col ->
  {col, get_stats.(wine_df, col)}
end)
|> add_stats_label.()
|> DataFrame.new()
|> DataFrame.table(limit: :infinity)
まさに pandas の describe と同じものが表示できました
ヒストグラム
散布図行列を表示する準備として、まずヒストグラムを表示してみます
get_values = fn df, col ->
  df
  |> DataFrame.pull(col)
  |> Series.to_list()
end

histgram = fn df, col ->
  x = get_values.(df, col)
  y = List.duplicate(1, DataFrame.n_rows(df))

  Vl.new(width: 300, height: 300, title: col)
  |> Vl.data_from_values(x: x, y: y)
  |> Vl.mark(:bar)
  |> Vl.encode_field(
    :x,
    "x",
    type: :quantitative,
    bin: %{maxbins: 20},
    title: col
  )
  |> Vl.encode_field(
    :y,
    "y",
    type: :quantitative,
    aggregate: :count
  )
end

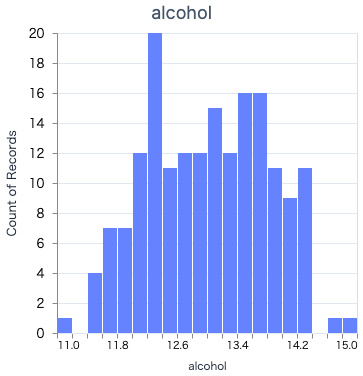
histgram.(wine_df, "alcohol")
いい感じに表示できました
全項目でやってみます
histgram_list =
  cols
  |> Enum.map(fn col ->
    histgram.(wine_df, col)
  end)

Vl.new(width: 300, height: 300 * Enum.count(cols))
|> Vl.concat(histgram_list, :vertical)
続いて、クラス(ワインの品種)毎に出力してみましょう
get_class_values = fn df, col, class ->
  df
  |> DataFrame.filter(Series.equal(df["class"], class))
  |> get_values.(col)
end

class_histgram = fn class, color ->
  Vl.new(width: 300, height: 300)
  |> Vl.mark(:bar, color: color, opacity: 0.5)
  |> Vl.encode_field(
    :x,
    "x#{class}",
    type: :quantitative,
    bin: %{maxbins: 20},
    title: "class#{class}"
  )
  |> Vl.encode_field(
    :y,
    "y",
    type: :quantitative,
    aggregate: :count
  )
end

all_class_histgram = fn df, col ->
  x1 = get_class_values.(df, col, 1)
  x2 = get_class_values.(df, col, 2)
  x3 = get_class_values.(df, col, 3)
  y = List.duplicate(0, DataFrame.n_rows(df))

  Vl.new(width: 300, height: 300, title: col)
  |> Vl.data_from_values(x1: x1, x2: x2, x3: x3, y: y)
  |> Vl.layers([
    class_histgram.(1, :blue),
    class_histgram.(2, :yellow),
    class_histgram.(3, :red)
  ])
end

all_class_histgram.(wine_df, "alcohol")

histgram_list =
  cols
  |> Enum.map(fn col ->
    all_class_histgram.(wine_df, col)
  end)

Vl.new(width: 300, height: 300 * Enum.count(cols))
|> Vl.concat(histgram_list, :vertical)
結構クラス毎に特徴が出ている項目もありますね
散布図
次に散布図を作ります
scatter = fn df, x_col, y_col ->
  x = get_values.(df, x_col)
  y = get_values.(df, y_col)
  class = get_values.(wine_df, "class")

  Vl.new(width: 300, height: 300)
  |> Vl.data_from_values(x: x, y: y, class: class)
  |> Vl.mark(:point)
  |> Vl.encode_field(:x, "x",
    type: :quantitative,
    scale: [domain: [Enum.min(x), Enum.max(x)]],
    title: x_col
  )
  |> Vl.encode_field(:y, "y",
    type: :quantitative,
    scale: [domain: [Enum.min(y), Enum.max(y)]],
    title: y_col
  )
  |> Vl.encode_field(:color, "class", type: :nominal)
end
color に class を指定することで、クラス毎に点の色を変えています
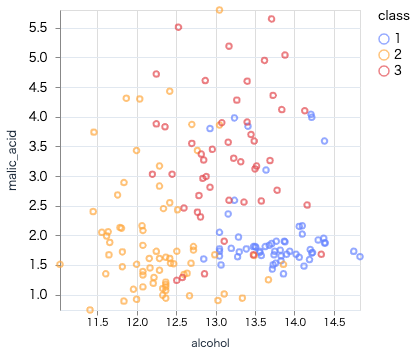
アルコールとリンゴ酸の散布図
scatter.(wine_df, "alcohol", "malic_acid")
かなりバラバラで品種の分類は難しそうです
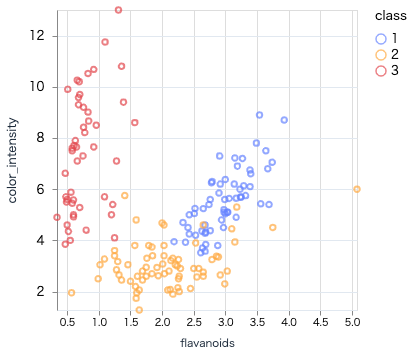
フラボノイドと色の濃さの散布図
scatter.(wine_df, "flavanoids", "color_intensity")
クラス毎にまとまっていて、分類に使えそうな感じがします
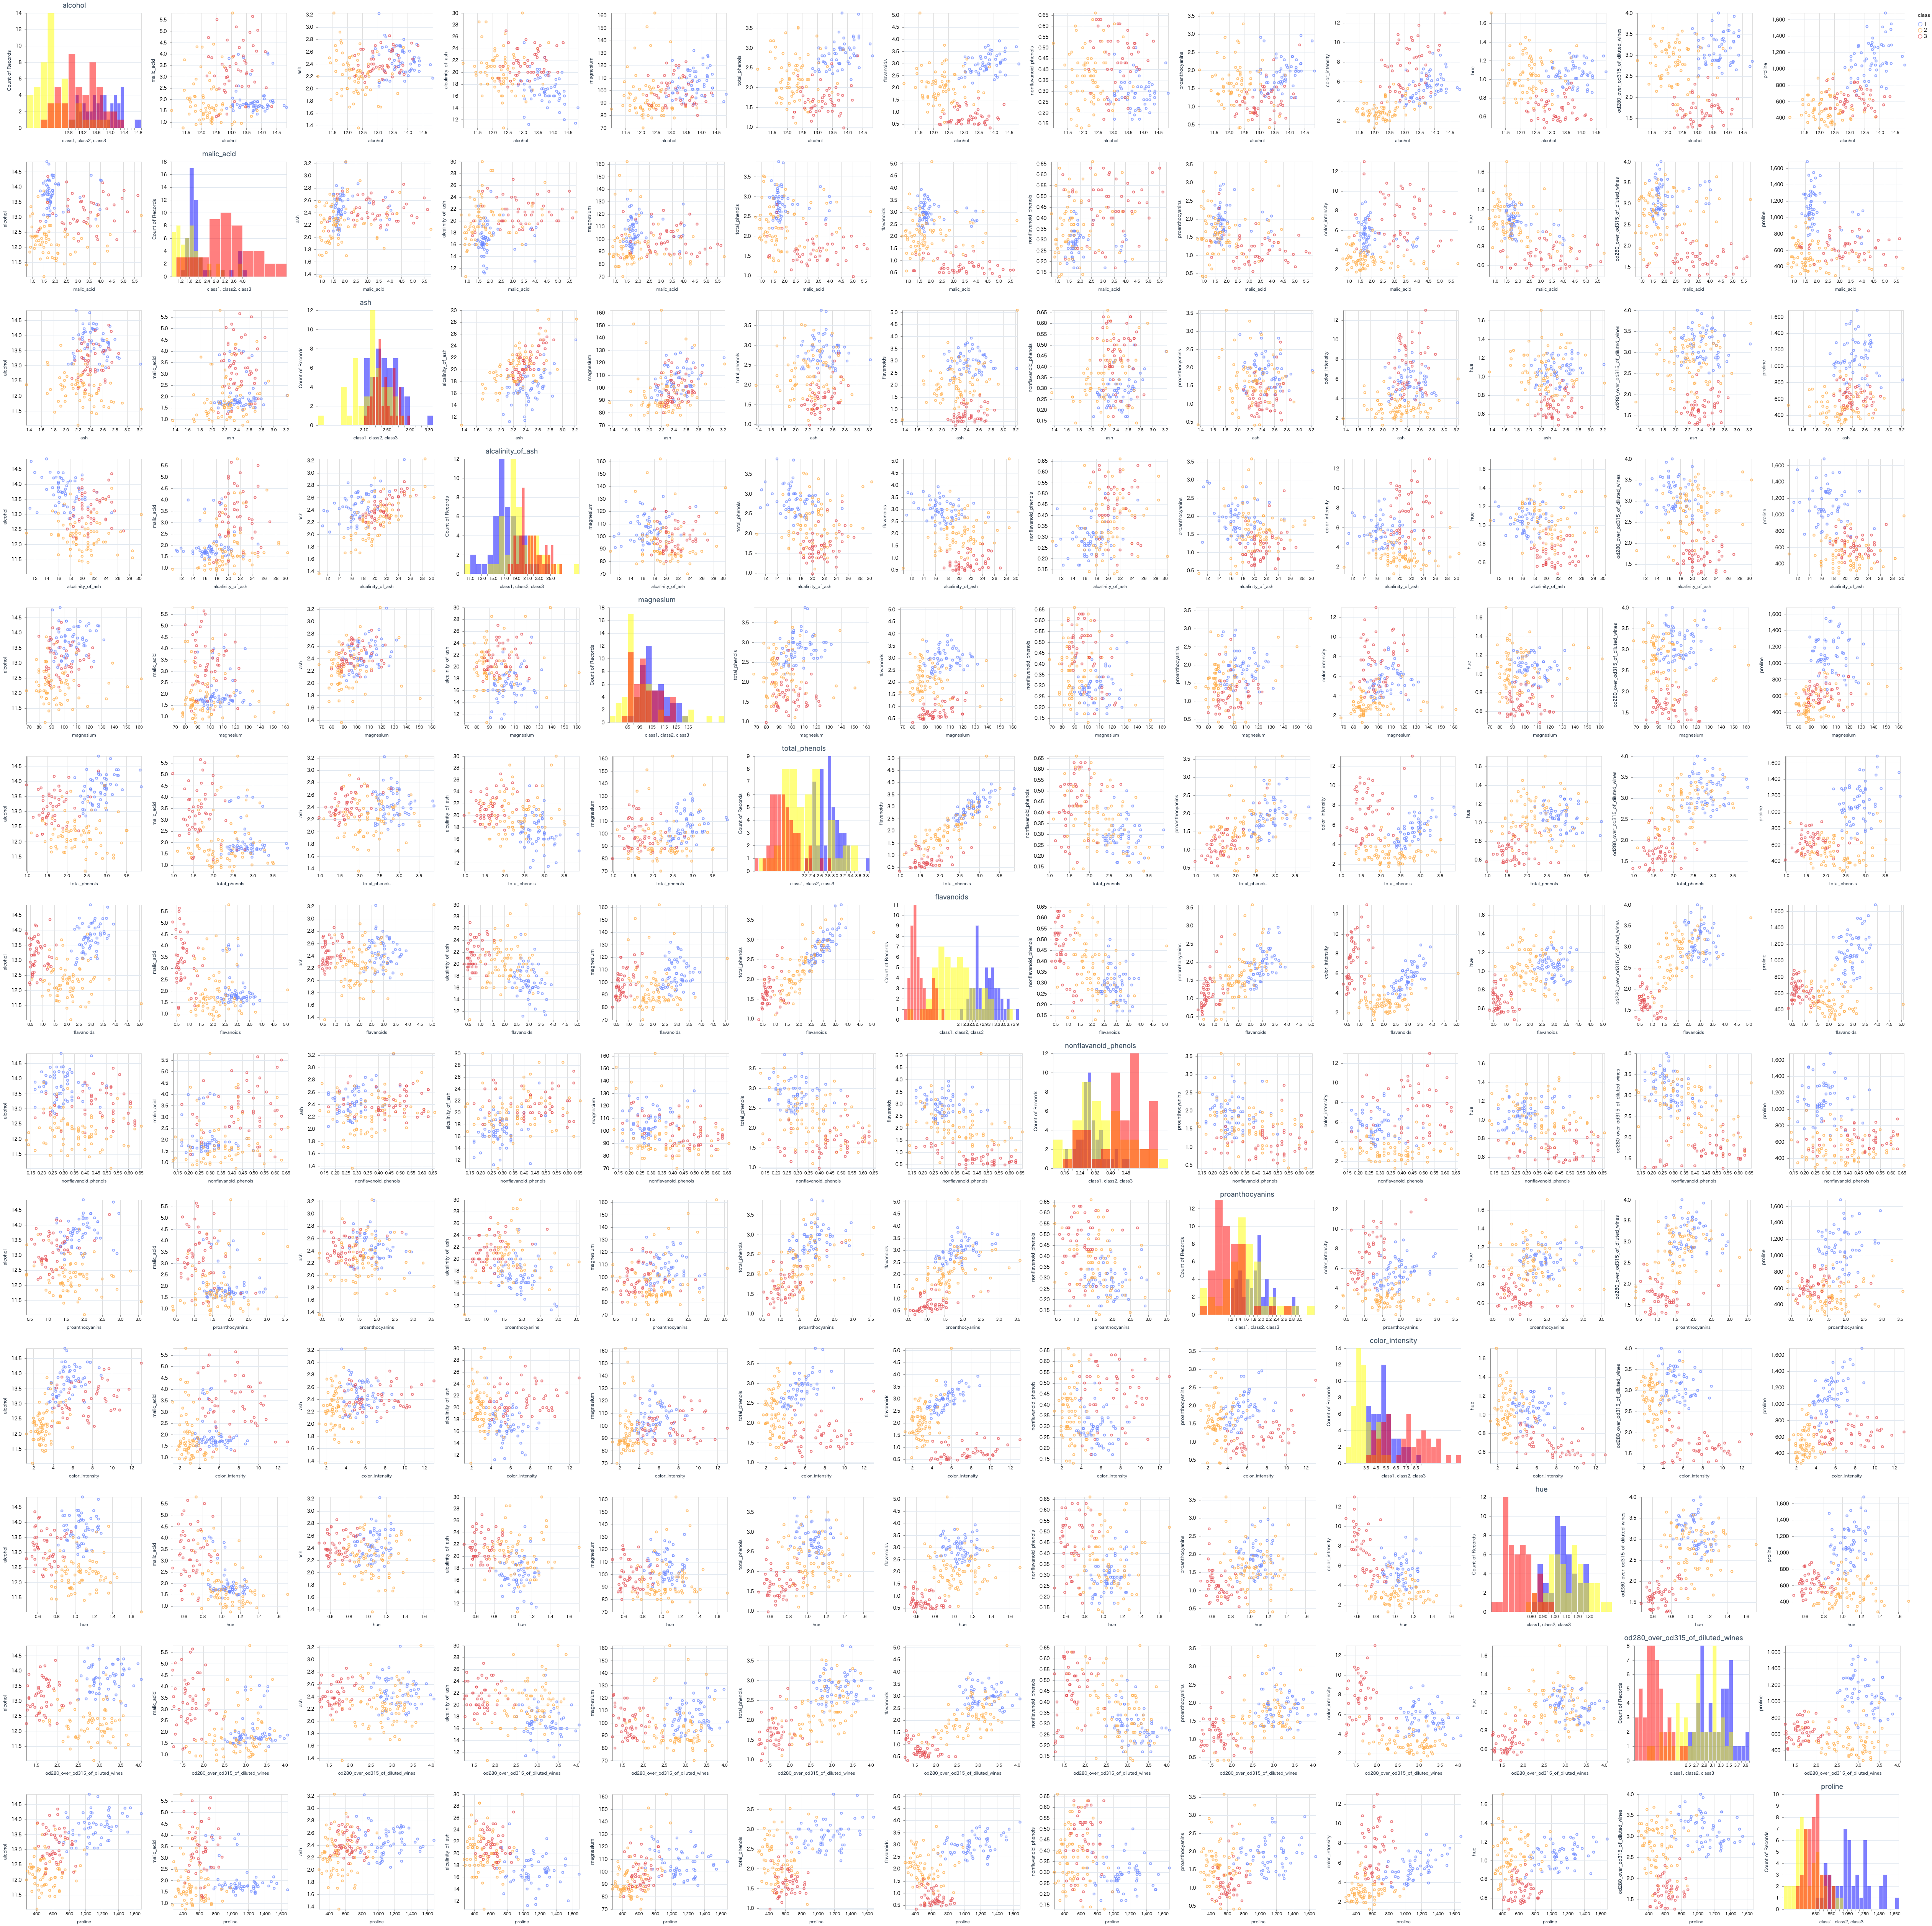
散布図行列
準備ができたので、散布図行列を出してみましょう
graphs =
  cols
  |> Enum.map(fn col_1 ->
    h_graphs =
      cols
      |> Enum.map(fn col_2 ->
        cond do
          col_1 == col_2 ->
            all_class_histgram.(wine_df, col_1)

          true ->
            scatter.(wine_df, col_1, col_2)
        end
      end)

    Vl.new(width: 300 * Enum.count(cols), height: 300)
    |> Vl.concat(h_graphs, :horizontal)
  end)

Vl.new(width: 300 * Enum.count(cols), height: 300 * Enum.count(cols))
|> Vl.concat(graphs, :vertical)
これを眺めれば、どの組み合わせが有効そうか、なんとなく見えてきます
標準化
この後相関行列を作るため、各項目の値を標準化しておきます
標準化とは、についてはこちらを参照してください
標準化は各値について、平均を引いてから標準偏差で割ります
従って、各項目に対して以下のような関数で定義できます
standardize = fn df, column ->
  mean =
    wine_df
    |> DataFrame.pull(column)
    |> Series.mean()

  std =
    wine_df
    |> DataFrame.pull(column)
    |> Series.std()

  df
  |> DataFrame.mutate(%{column => &Series.subtract(&1[column], mean)})
  |> DataFrame.mutate(%{column => &Series.divide(&1[column], std)})
end
この関数を各項目に対して適用します
standardized_wine_df =
  cols
  |> Enum.reduce(wine_df, fn col, standardized_df ->
    standardize.(standardized_df, col)
  end)

standardized_wine_df
|> DataFrame.table(limit: :infinity)
相関行列
各項目がお互いにどれだけ関係しているか、を示す相関係数を全項目の組み合わせで出力します
前回の記事ではここを無理矢理ループして計算していましたが、
今回は Nx を使って行列計算でスマートに実装します
まず、データフレームをテンソルに変換します
df_to_tensor = fn df ->
  df
  |> DataFrame.names()
  |> Enum.map(fn col ->
    standardized_wine_df
    |> DataFrame.pull(col)
    |> Series.to_tensor()
  end)
  |> Nx.concatenate()
  |> Nx.reshape({DataFrame.n_columns(df), DataFrame.n_rows(df)})
end

standardized_wine_tensor =
  standardized_wine_df
  |> DataFrame.select(["class"], :drop)
  |> df_to_tensor.()
  |> Nx.transpose()
データフレームと同じ形のテンソルになったことが分かると思います
分散共分散行列は標準化したテンソルを A とすると、以下のように表せます
Cov = \frac{1}{n} A^T \cdot A
covariance_tensor =
  standardized_wine_tensor
  |> Nx.transpose()
  |> Nx.dot(standardized_wine_tensor)
  |> Nx.divide(DataFrame.n_rows(standardized_wine_df))
x と y の相関係数は以下の数式で表します
r_{xy} = \frac{cov_{xy}}{s_x s_y}
cov_{xy} : x と y の共分散
s_{x} : x の標準偏差
s_{y} : y の標準偏差
標準化済のため、各項目の標準偏差は 1 になっています
従って、共分散 = 相関係数になっています
そのため、 分散共分散行列 = 相関行列になります
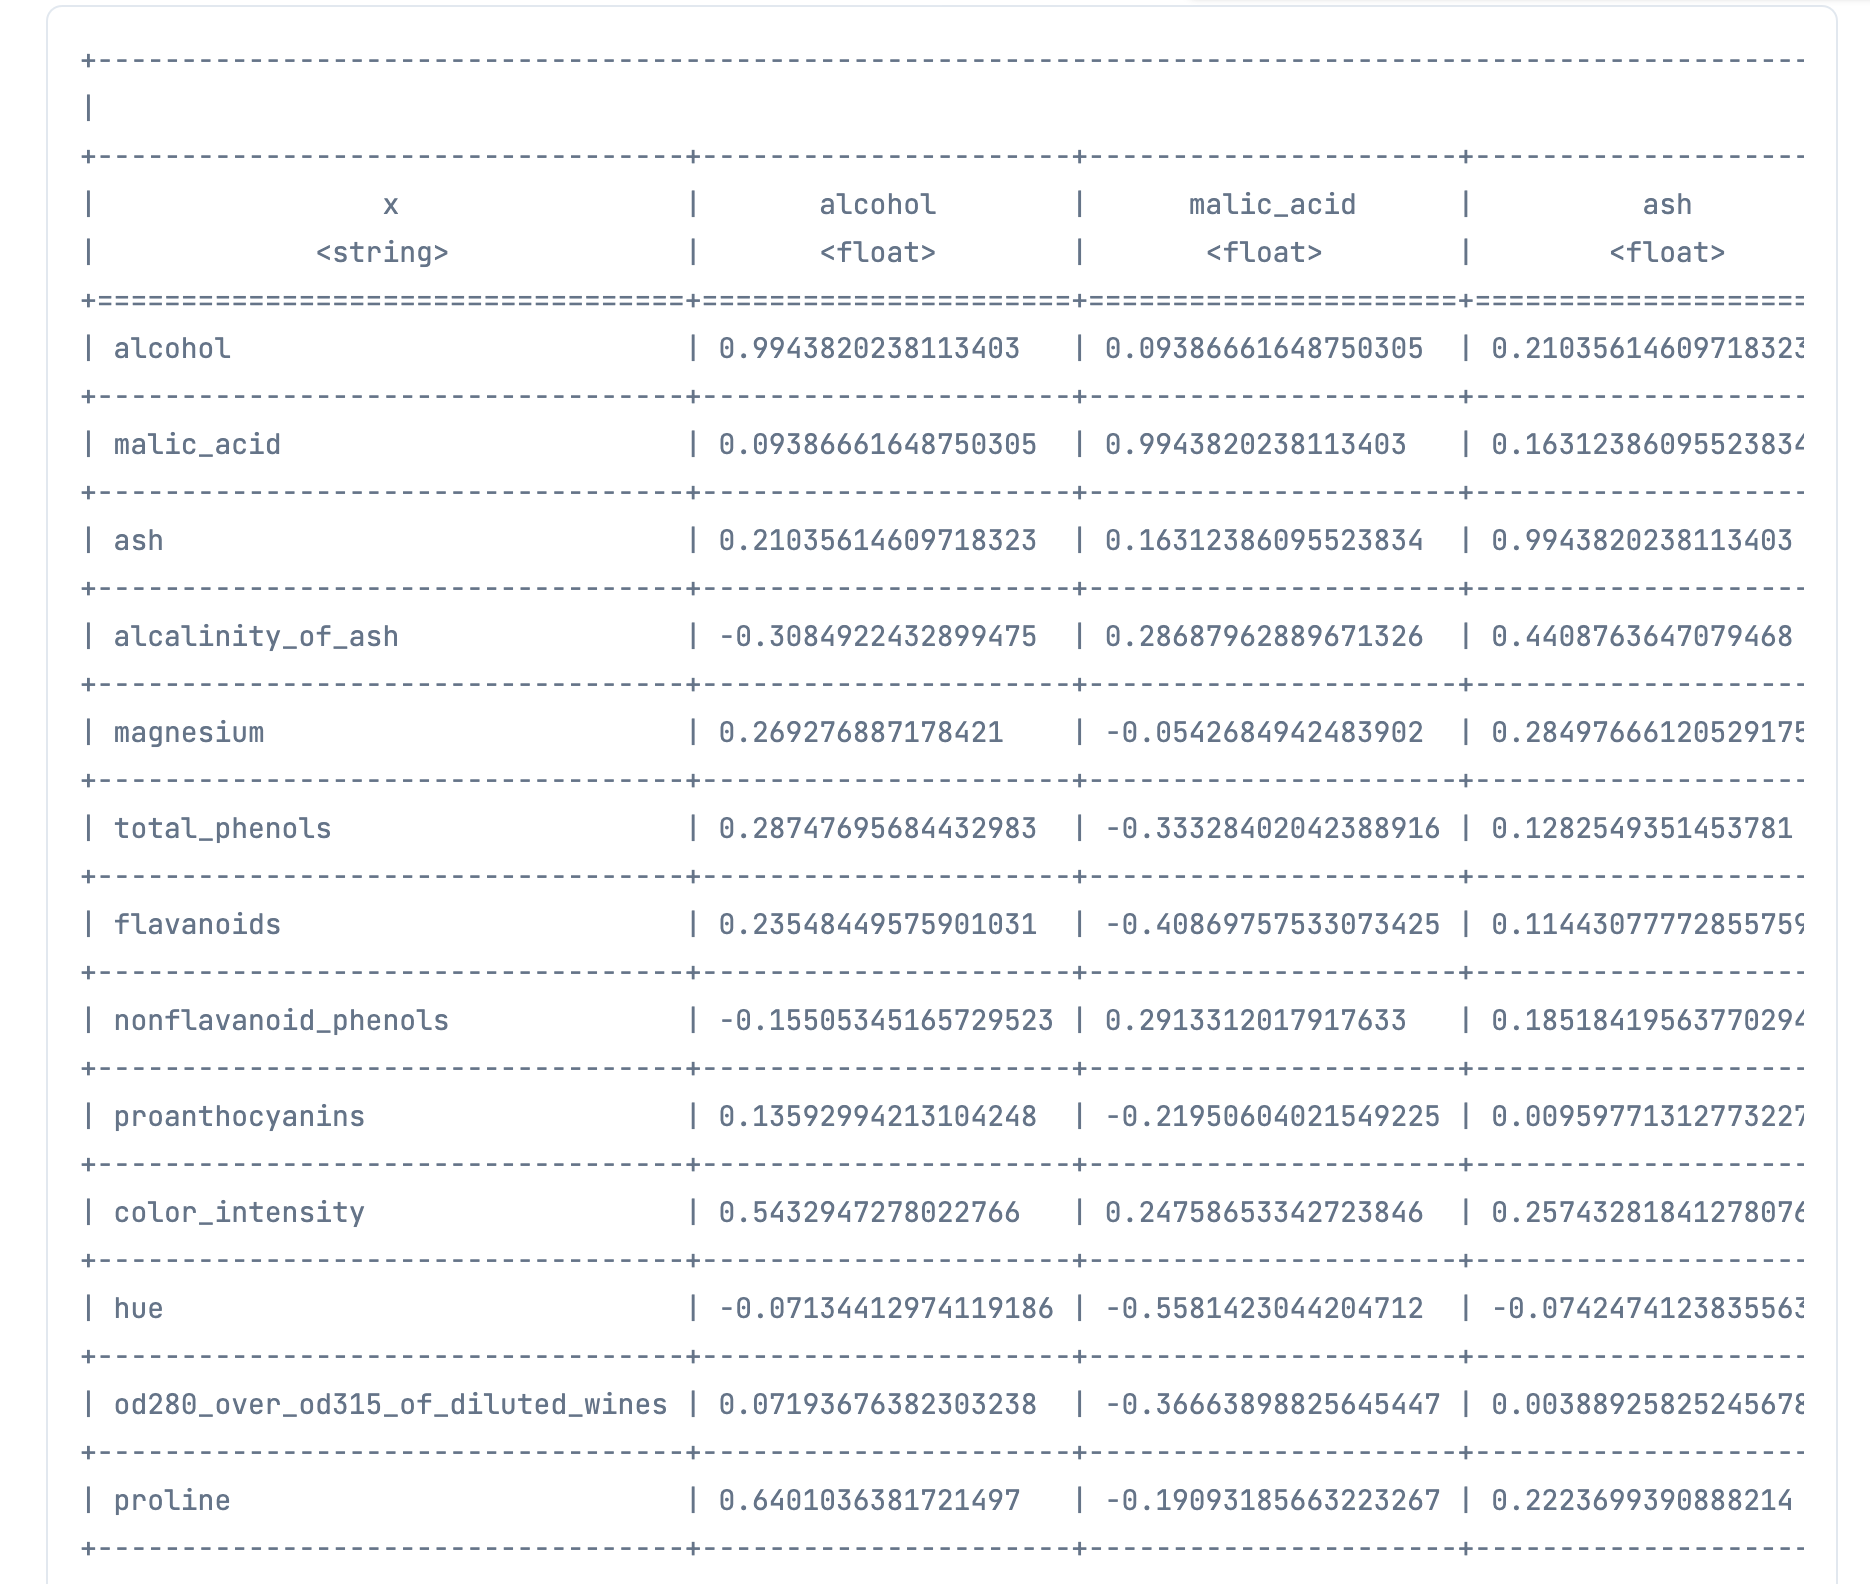
取得した相関行列をテンソルからデータフレームに変換してテーブル表示してみます
add_cols_label = fn list, cols_ ->
  [{"x", cols_} | list]
end

covariance_df =
  cols
  |> Stream.with_index()
  |> Enum.map(fn {col, index} ->
    {col, Nx.to_flat_list(covariance_tensor[index])}
  end)
  |> add_cols_label.(cols)
  |> DataFrame.new()

covariance_df
|> DataFrame.table(limit: :infinity)
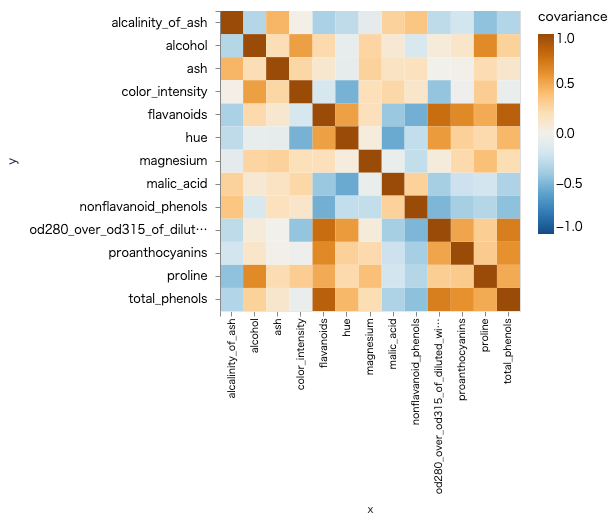
これでも見にくいので、ヒートマップにしてみます
heatmap =
  cols
  |> Stream.with_index()
  |> Enum.map(fn {col_1, index_1} ->
    cols
    |> Stream.with_index()
    |> Enum.map(fn {col_2, index_2} ->
      covariance =
        covariance_tensor[index_1][index_2]
        |> Nx.to_number()
      %{
        x: col_1,
        y: col_2,
        covariance: covariance
      }
    end)
  end)
  |> List.flatten()

Vl.new(width: 200, height: 200)
|> Vl.data_from_values(heatmap)
|> Vl.mark(:rect)
|> Vl.encode_field(:x, "x", type: :nominal)
|> Vl.encode_field(:y, "y", type: :nominal)
|> Vl.encode_field(
  :fill, "covariance",
  type: :quantitative,
  scale: [
    domain: [-1, 1],
    scheme: :blueorange
  ]
)
オレンジに近いところは正の相関、青に近いところは負の相関を持っています
対角線は同じ項目なので濃いオレンジです
項目間の関連具合が何となく見えますね
固有値、固有ベクトル
PCA のための固有値、固有ベクトルを取得します
これに関しては Nx がそのものずばりの関数を提供していたので、1行で済みました
しかも、固有値の大きい順に並べてくれているので、こちらで並べ替える必要がありません
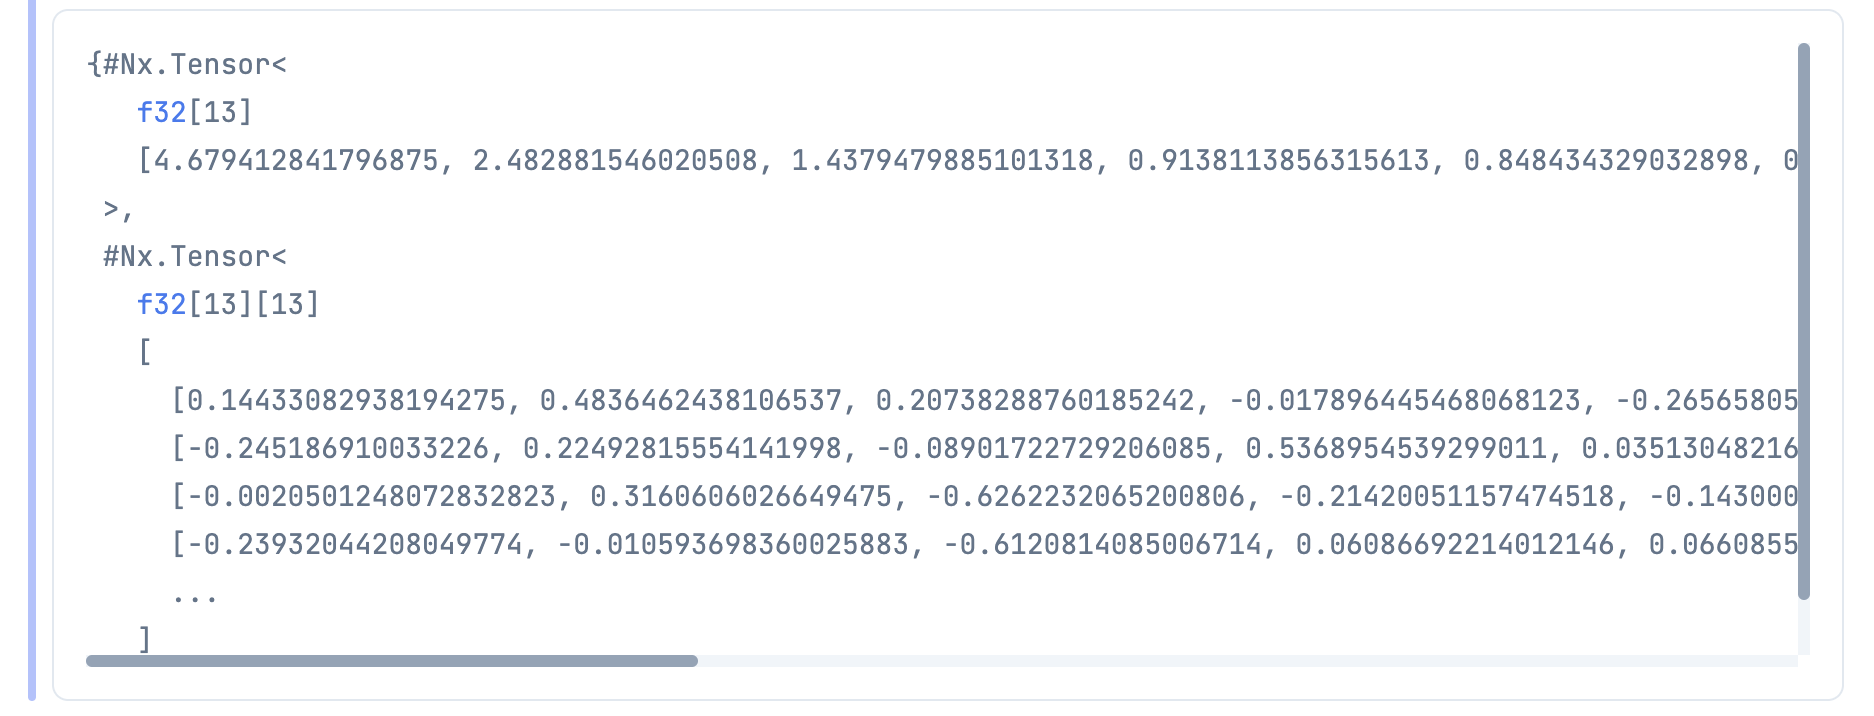
{eigenvals, eigenvecs} = Nx.LinAlg.eigh(covariance_tensor)
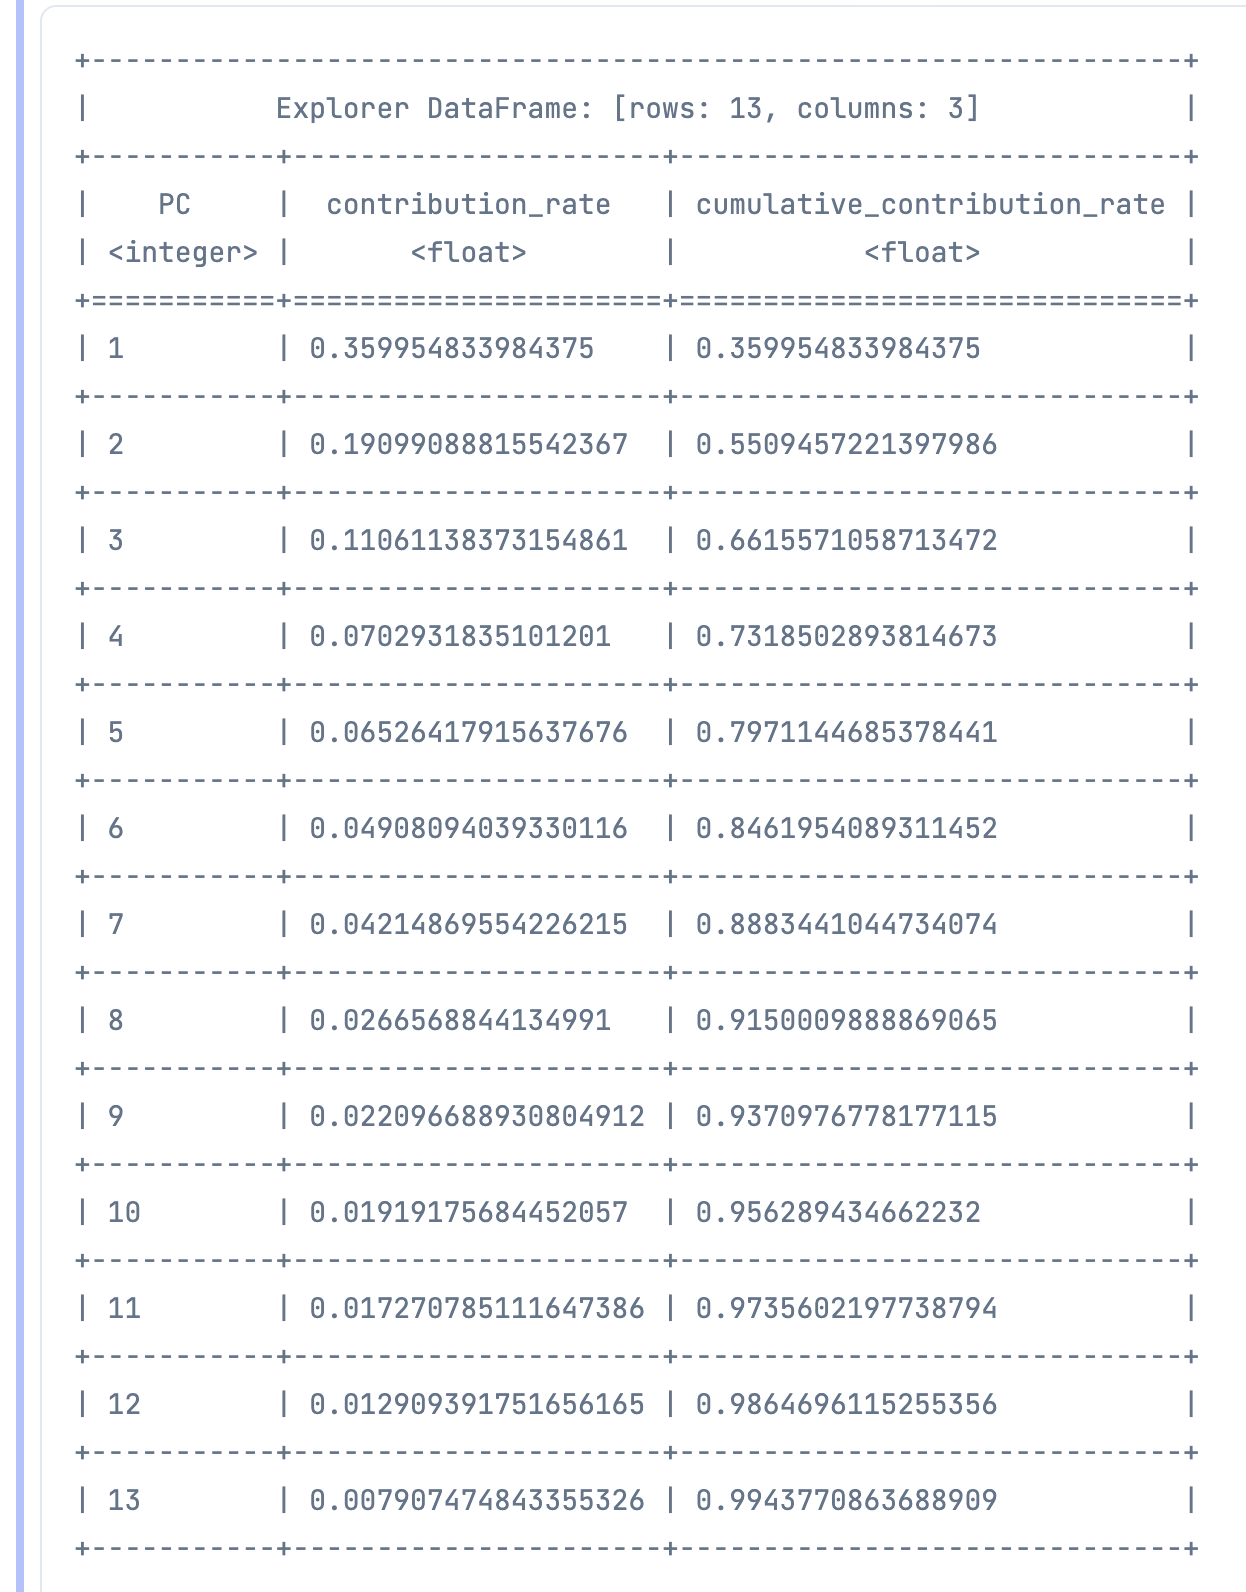
寄与率
各固有ベクトル = 主成分得点がどれくらい情報量を持っているのか、寄与率を出してみます
get_contribution_rate = fn index ->
  Nx.to_number(eigenvals[index - 1]) / Nx.size(eigenvals)
end

contribution_rate_list =
  1..Nx.size(eigenvals)
  |> Enum.to_list()
  |> Enum.map(fn index ->
    get_contribution_rate.(index)
  end)
そして、その累積値 = 累積寄与率を計算します
cumulative_contribution_rate_list =
  1..Nx.size(eigenvals)
  |> Enum.map(fn index ->
    contribution_rate_list
    |> Enum.slice(0, index)
    |> Enum.sum()
  end)
寄与率、累積寄与率をテーブル表示してみましょう
contribution_rate_df =
  %{
    "PC" => 1..Nx.size(eigenvals),
    "contribution_rate" => contribution_rate_list,
    "cumulative_contribution_rate" => cumulative_contribution_rate_list
  }
  |> DataFrame.new()

contribution_rate_df
|> DataFrame.table(limit: :infinity)
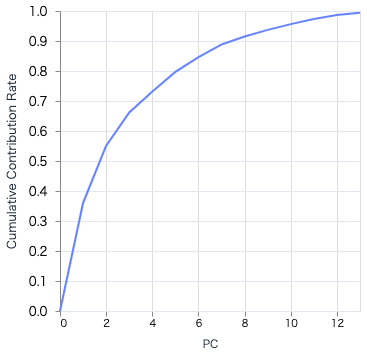
第2主成分の時点で情報量の半数以上を占めていることが分かります
これをグラフ化してみましょう
Vl.new(width: 300, height: 300)
|> Vl.data_from_values(
  x: 0..Nx.size(eigenvals),
  y: [ 0 | cumulative_contribution_rate_list]
)
|> Vl.mark(:line)
|> Vl.encode_field(
  :x, "x",
  type: :quantitative,
  title: "PC"
)
|> Vl.encode_field(
  :y, "y",
  type: :quantitative,
  title: "Cumulative Contribution Rate"
)
今回は第2主成分までを使って次元圧縮してみましょう
次元圧縮
第2主成分得点まで=固有ベクトルの1番目と2番目を取り出してくっつけます
これを射影行列とします
eigenvecs = Nx.transpose(eigenvecs)

w1 = eigenvecs[0]
w2 = eigenvecs[1]

IO.inspect(w1)
IO.inspect(w2)

w = Nx.stack([w1, w2], axis: 1)
標準化したデータと射影行列の内積によって、第1主成分と第2主成分を取得します
pca_wine_tensor =
  standardized_wine_tensor
  |> Nx.dot(w)
  |> Nx.transpose()
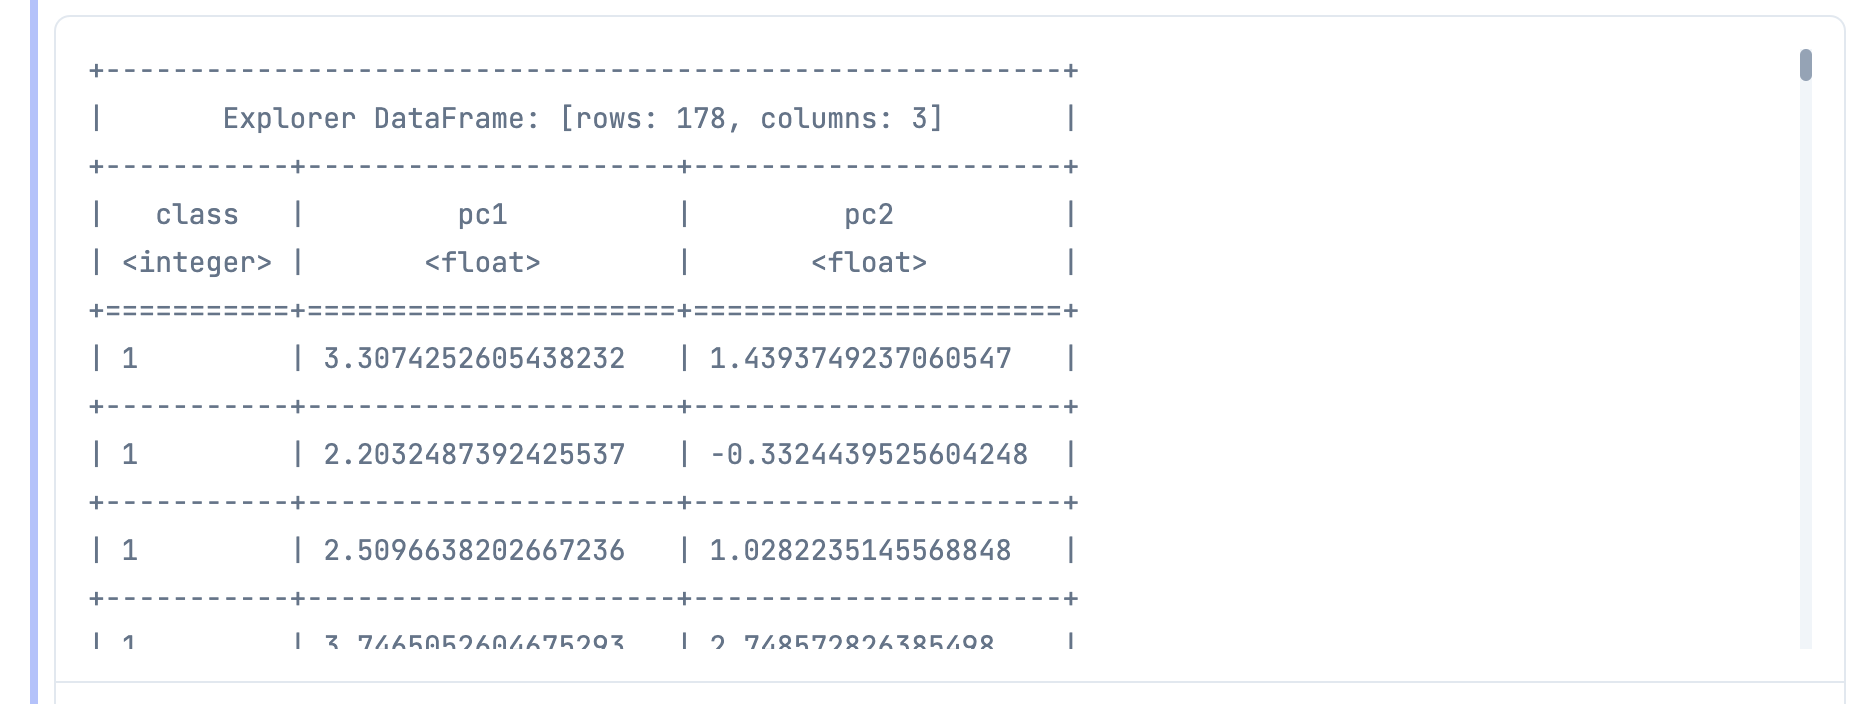
主成分とクラスでデータフレームを作り、テーブル表示してみます
classes = get_values.(wine_df, "class")

pca_wine_df =
  %{
    class: classes,
    pc1: Nx.to_flat_list(pca_wine_tensor[0]),
    pc2: Nx.to_flat_list(pca_wine_tensor[1])
  }
  |> DataFrame.new()

pca_wine_df
|> DataFrame.table(limit: :infinity)
今まで13項目もあったせいで横方法に収まっていなかったテーブルが、
2項目まで次元圧縮されたおかげでスッキリ見えます
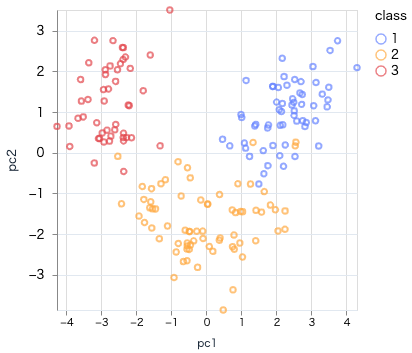
最後に第1主成分と第2主成分の散布図を表示します
scatter.(pca_wine_df, "pc1", "pc2")
明確にクラス毎に分かれてまとまっていることが分かります
この主成分を使えば、効率的に機械学習できそうです
おわりに
データの抽出や集計、テーブル表示をしたいときは Explorer
グラフ表示したいときは Kino.VegaLite
行列計算したいときは Nx
という感じに行ったり来たりすることで色々なデータ分析ができました
Python だと pandas matplotlib numpy をそれぞれ使い分ける感じですね
Explorer と Nx があれば大概の統計はできると思うので、
まだまだ色々と使えそうです
