はじめに
先日開催された LiveView JP#10 で @piacerex さんが披露してくださった
dbg を Livebook 上で動かすデモが面白かったので、
自分でも色々動かしてみました
実行環境
- macOS Monterey 12.5.1
- Elixir 1.14.0
- erlang 25.0.4
準備
最新版を動かすため、 Livebook のリポジトリをクローンしてきてローカルで実行します
git clone https://github.com/livebook-dev/livebook.git
cd livebook
私のように asdf を使っている人は以下のようにして Elixir 1.14 以上を使うようにします
それ以外の人は何らかの手段で Elixir 1.14 以上をインストールしてください
asdf install elixir 1.14.0-otp-25
asdf local elixir 1.14.0-otp-25
asdf install erlang 25.0.4
asdf local erlang 25.0.4
Livebook を起動します
mix deps.get --only prod
MIX_ENV=prod mix phx.server
[Livebook] Application running at http://localhost:8080/?token=... のように URL が表示されたら、
ブラウザで開いてください
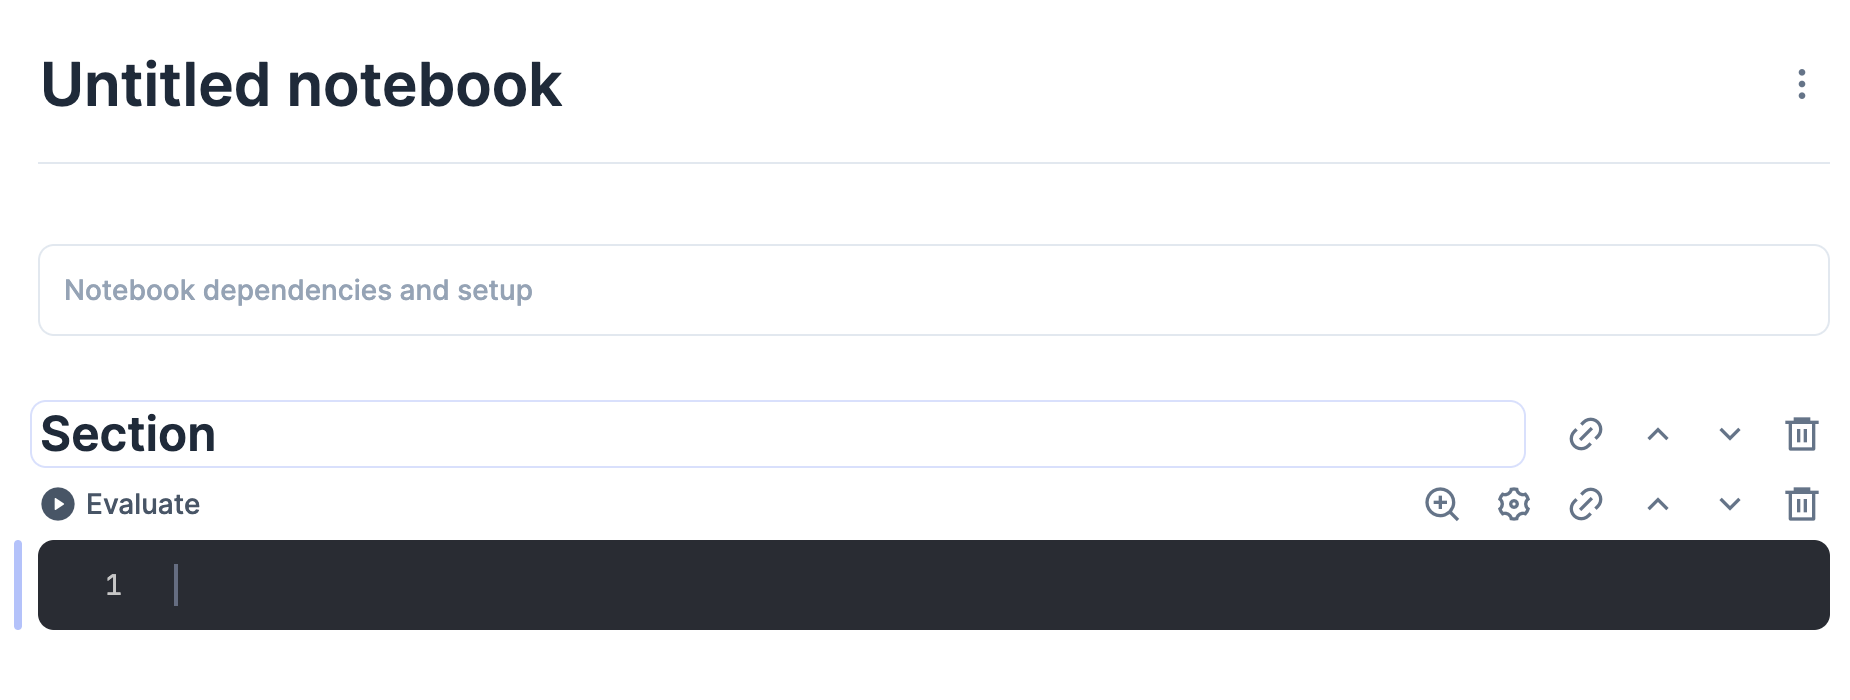
こんな感じの画面が開きます

右上 New notebook をクリックし、新しいノートブックを開けば準備完了です
パッケージのインストール
一番上(Section の上)のセルに以下の内容を貼り付けで実行してください
kino を GitHub からインストールしているのがミソです
Mix.install([
  {:kino, "~> 0.6", github: "livebook-dev/kino", branch: "main", override: true},
  {:kino_vega_lite, "~> 0.1.1"},
  {:nx, "~> 0.3"},
  {:evision, "~> 0.1", github: "cocoa-xu/evision", branch: "main"},
  {:explorer, "~> 0.3"},
  {:download, "~> 0.0"}
])
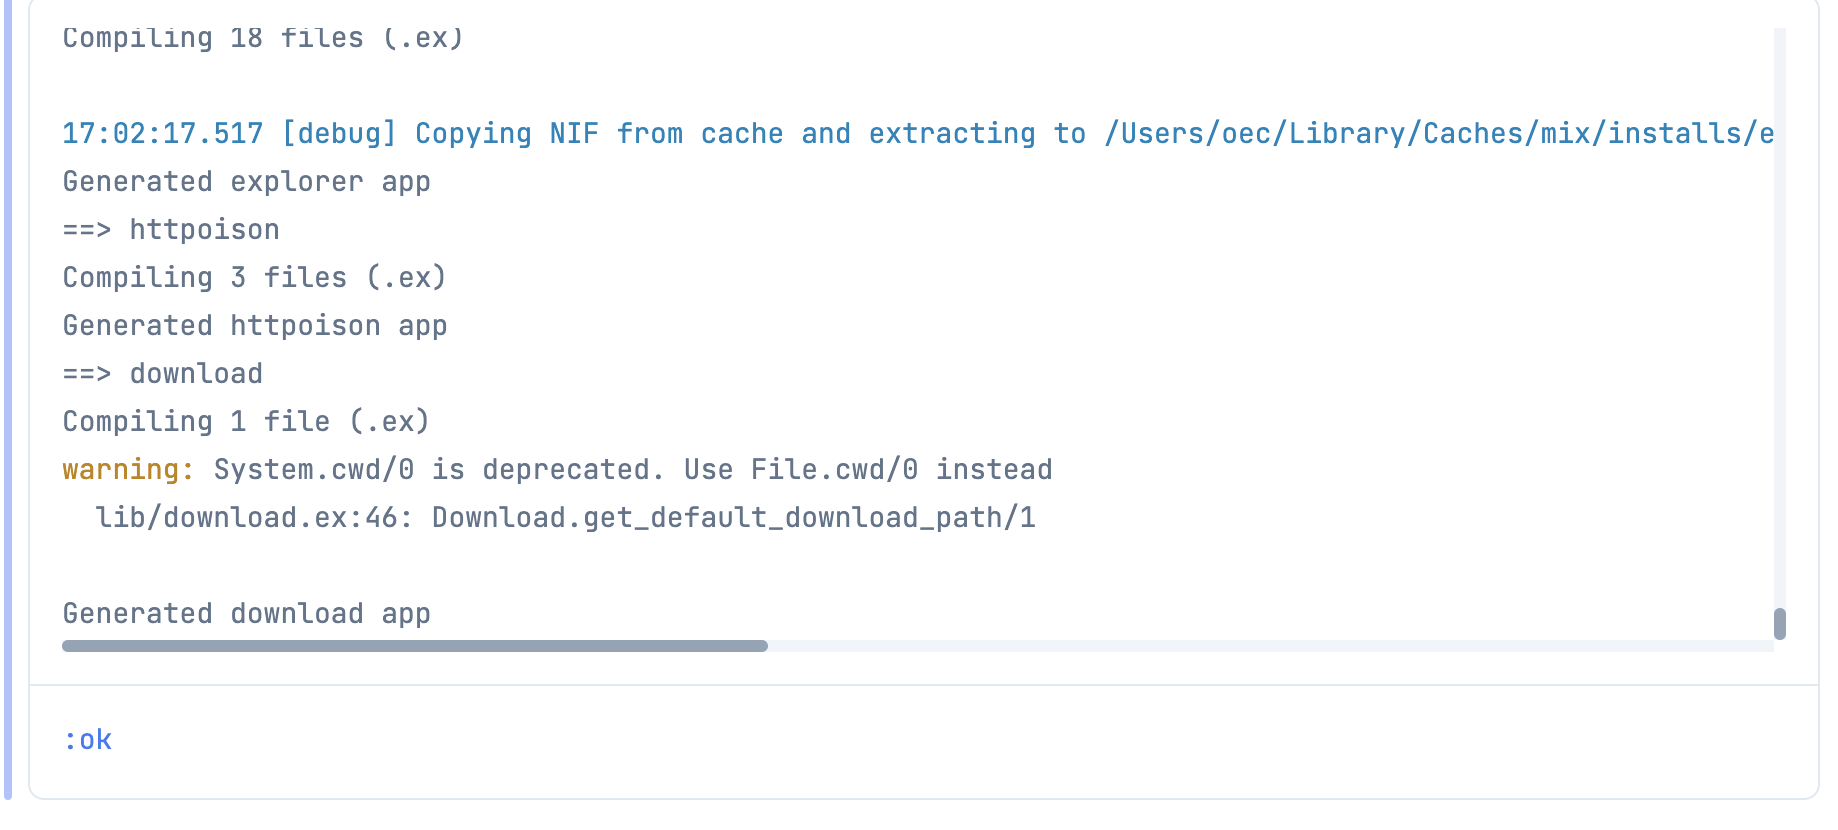
evision のインストールに10分くらいかかると思いますが、しばらく待ってください
最終的に :ok が出れば成功です
Elixir バージョン確認
dbg は Elixir 1.14 以上でないと動かないため、一応確認します
System.version()

エイリアス
長い名前のものにエイリアスをつけておきます
alias Explorer.DataFrame, as: DF
alias Explorer.Series, as: S
alias Evision, as: OpenCV
alias VegaLite, as: Vl
ヘルパー
画像ダウンロード、画像表示用のヘルパーを作っておきます
defmodule Helper do
  def download!(url, save_as) do
    unless File.exists?(save_as) do
      Download.from(url, path: save_as)
    end

    save_as
  end

  def show_image(mat) do
    OpenCV.imencode!(".png", mat)
    |> IO.iodata_to_binary()
    |> Kino.Image.new(:png)
  end

  def show_image_from_path(image_path) do
    image_path
    |> File.read!()
    |> Kino.Image.new(:jpeg)
  end
end
文字列操作
ここから dbg 祭りです
"Elixir is cool!"
|> String.trim_trailing("!")
|> String.split()
|> Enum.reverse()
|> List.first()
|> dbg()
うまくいくと、このように表示されます
パイプ毎に ▷ から始まる行として表示されています
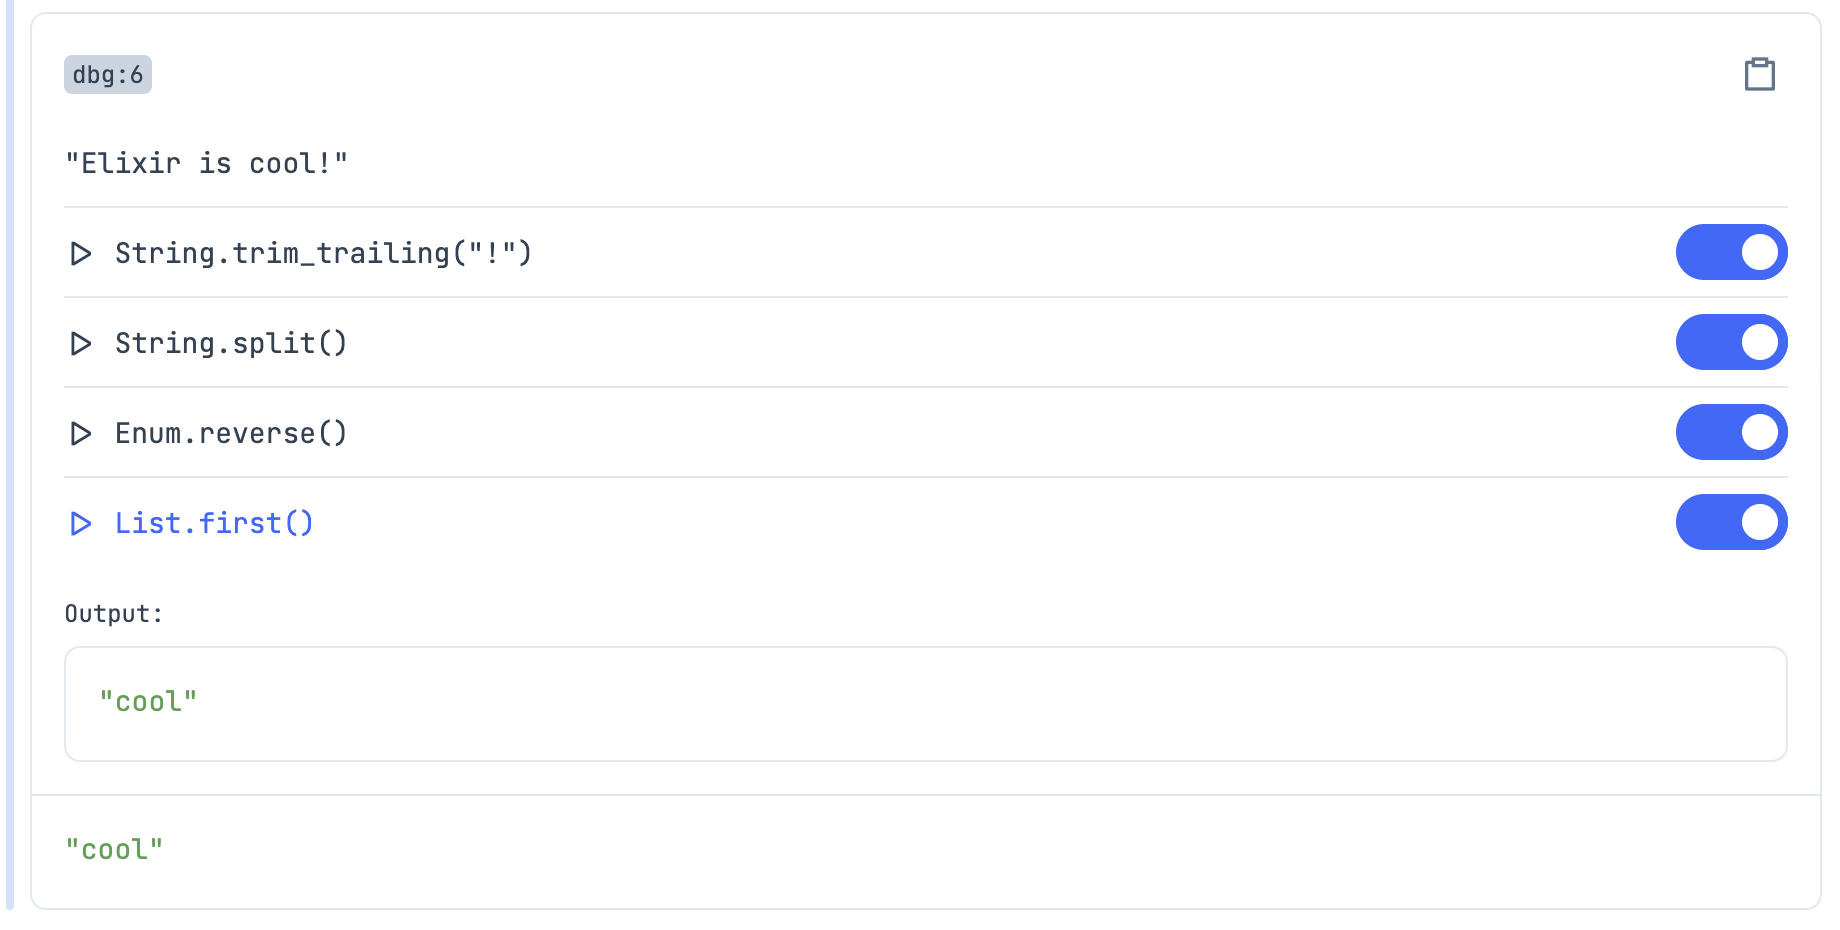
各パイプの行をクリックすると、その時点での出力が表示されます
また、各パイプの右端トグルスイッチをオフにすると、そのパイプが実行されなかった場合の処理結果が表示されます
数値計算
数値計算ならこんな感じになります
[1, 2, 3]
|> Enum.map(&(&1 * 3))
|> Enum.map(&(&1 + 1))
|> Enum.map(&(&1 * 2))
|> dbg()
ドラッグ&ドロップで順番を入れ替えることも可能です
行列演算
Nx を使った行列演算も
[1, 2, 3]
|> Nx.tensor()
|> Nx.multiply(3)
|> Nx.tile([2, 2])
|> Nx.mean()
|> dbg()
画像処理
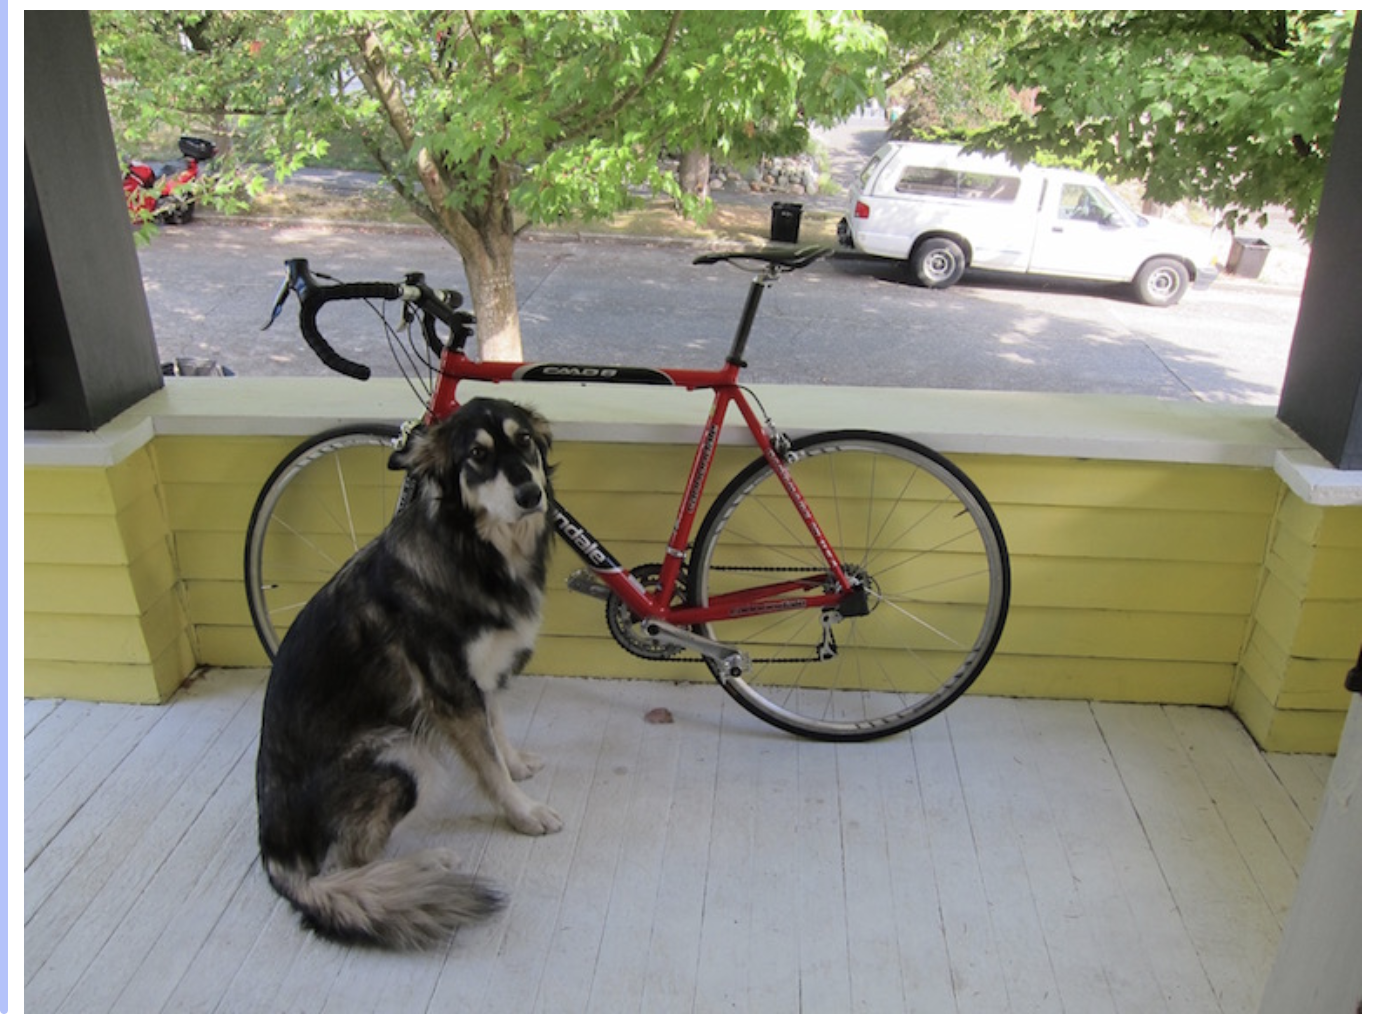
まず画像をダウンロードしてきます
image_path = "dog.jpg"

"https://raw.githubusercontent.com/pjreddie/darknet/master/data/dog.jpg"
|> Helper.download!(image_path)
|> Helper.show_image_from_path()
Evision でこれをアレコレ編集します
{:ok, move} =
  [
    [1, 0, 100],
    [0, 1, 50]
  ]
  |> Nx.tensor(type: {:f, 32})
  |> OpenCV.Nx.to_mat()

{:ok, rotation} = OpenCV.getRotationMatrix2D([512 / 2, 512 / 2], 90, 1)

image_path
|> OpenCV.imread!()
|> OpenCV.blur!([9, 9])
|> OpenCV.warpAffine!(move, [512, 512])
|> OpenCV.warpAffine!(rotation, [512, 512])
|> OpenCV.rectangle!([50, 10], [125, 60], [255, 0, 0])
|> OpenCV.ellipse!([300, 300], [100, 200], 30, 0, 360, [255, 255, 0], thickness: 3)
|> Helper.show_image()
|> dbg()
画像がコロコロ変わって面白いですね
データ分析
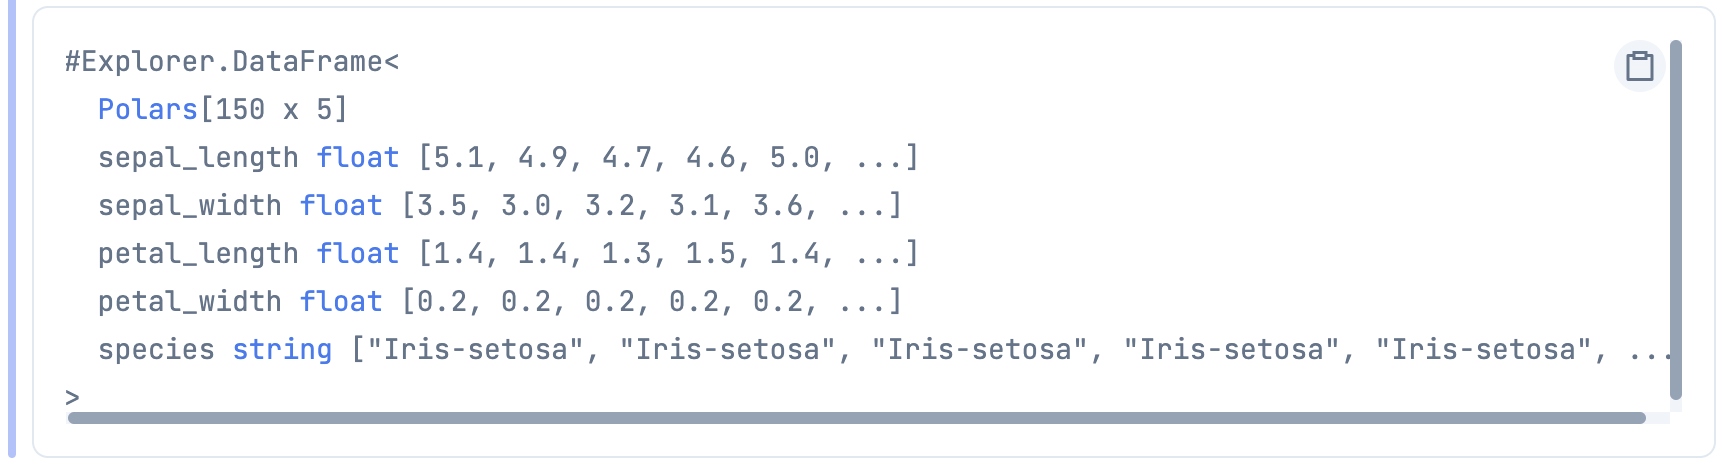
次は Explorer で試してみましょう
アヤメのデータセットを取得してきます
iris = Explorer.Datasets.iris()
これを編集してみます
iris
|> DF.filter_with(&S.equal(&1["species"], "Iris-virginica"))
|> DF.select(["sepal_length", "sepal_width", "petal_length", "petal_width"])
|> DF.arrange(desc: "sepal_width")
|> DF.rename(["ガクの長さ", "ガクの幅", "花弁の長さ", "花弁の幅"])
|> DF.to_rows()
|> Kino.DataTable.new()
|> dbg()
グラフ
最後にグラフです
散布図用関数を用意します
get_values = fn df, col ->
  df
  |> DF.pull(col)
  |> S.to_list()
end

scatter = fn df, x_col, y_col ->
  x = get_values.(df, x_col)
  y = get_values.(df, y_col)
  class = get_values.(df, "species")

  Vl.new(width: 300, height: 300)
  |> Vl.data_from_values(x: x, y: y, class: class)
  |> Vl.mark(:point)
  |> Vl.encode_field(:x, "x",
    type: :quantitative,
    scale: [domain: [Enum.min(x), Enum.max(x)]],
    title: x_col
  )
  |> Vl.encode_field(:y, "y",
    type: :quantitative,
    scale: [domain: [Enum.min(y), Enum.max(y)]],
    title: y_col
  )
  |> Vl.encode_field(:color, "class", type: :nominal)
end
アヤメのデータを編集しながら散布図に出します
iris
|> DF.filter_with(&S.greater(&1["sepal_length"], 3))
|> DF.filter_with(&S.greater(&1["petal_length"], 3))
|> DF.filter_with(&S.equal(&1["species"], "Iris-virginica"))
|> scatter.("sepal_length", "petal_length")
|> dbg()
まとめ
画像も表もグラフもコロコロ変えられるので、
画像処理やデータ分析が捗りそうですね!