Goでグラフを描きたい
データを可視化するツールやパッケージは沢山ありますが,
Go言語のみでグラフを描く必要があったので,その際に調べたことを整理しました.
Overview
作業環境
- Go 1.12
- Windows 10
- Goland 2019.1
事前準備
以下のコマンドで,goパッケージをインストールしてください.
こちらがgoでグラフを描画するために利用するパッケージになります.
パッケージの詳細はこちらへ
go get gonum.org/v1/plot/...
折れ線グラフ
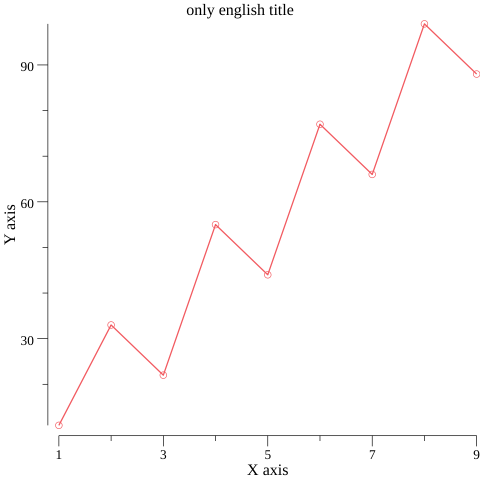
折れ線グラフを描画するまでに必要なコードを説明します.
こちらがインポートするパッケージ一覧です.
import (
	"gonum.org/v1/plot"
	"gonum.org/v1/plot/plotter"
	"gonum.org/v1/plot/plotutil"
	"gonum.org/v1/plot/vg"
)
まずは,plotインスタンスを生成してください.
続いて,グラフの表示項目を設定します.
// インスタンスを生成
p, err := plot.New()
if err != nil {
    panic(err)
}

// 表示項目の設定
p.Title.Text = "only english title"
p.X.Label.Text = "X axis"
p.Y.Label.Text = "Y axis"
棒グラフの表示には plotter.XYs 型を利用します.
XY 型は文字通り X,Y軸の値を表現します.数学でよく使うx,y座標表現と対応しています.
type XYs []XY

type XY struct {
    X, Y float64
}
今回のためにサンプルデータを作成しました.
xyAxis構造体を定義し,そのスライスを作成しています.
type xyAxis struct {
    x float64
    y float64
}

nums := []xyAxis {
    [1, 11],
    [2, 33],
    [3, 22],
    [4, 55],
    [5, 44],
    [6, 77],
    [7, 66],
    [8, 99],
    [9, 88],
}
サンプルデータをplotter.XYs型に当てはめます.
pts := make(plotter.XYs, len(nums))

for i, axis := range nums {
    pts[i].X = axis.x
    pts[i].Y = axis.y
}
これでデータの準備は完了しました.
以下の関数を利用してグラフを生成し,その結果を保存します.
// グラフを描画
err = plotutil.AddLinePoints(p, pts)
if err != nil {
    panic(err)
}

// 描画結果を保存
// "5*vg.Inch" の数値を変更すれば,保存する画像のサイズを調整できます.
if err := p.Save(5*vg.Inch, 5*vg.Inch, "sample1.png"); err != nil{
    panic(err)
}
ファイルを実行したのと同じディレクトリに"sample1.png"が生成されます.
棒グラフ
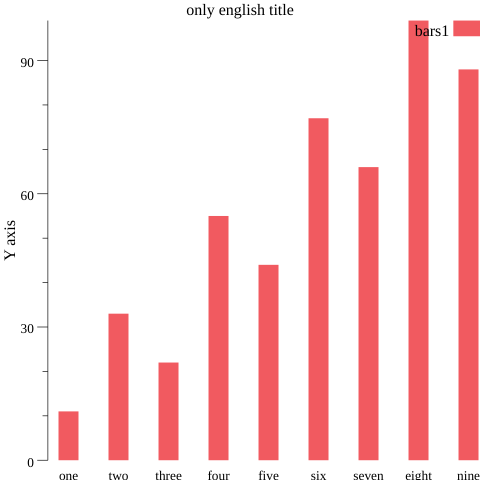
棒グラフを描画するまでに必要なコードを説明します.
こちらがインポートするパッケージ一覧です.
import (
	"gonum.org/v1/plot"
	"gonum.org/v1/plot/plotter"
	"gonum.org/v1/plot/plotutil"
	"gonum.org/v1/plot/vg"
)
まずは,plotインスタンスを生成してください.
続いて,グラフの表示項目を設定します.
// インスタンスを生成
p, err := plot.New()
if err != nil {
    panic(err)
}

// 表示項目の設定
p.Title.Text = "only english title"
p.Y.Label.Text = "Y axis"
棒グラフの描画にはplotter.Values型を利用します.
type Values []float64
今回用意したサンプルデータはこちらです.
nums := plotter.Values{11,33,22,55,44,77,66,99,88}
棒グラフで描画する棒の「幅」を設定します.
今回は15ピクセルとします.
breadth := vg.Points(15)
棒グラフを生成します.
描画後に詳細を設定し,レイアウトを整理します.
bar, err := plotter.NewBarChart(num, breadth)
if err != nil {
    panic(err)
}

// 棒グラフ自体の枠線
bar.LineStyle.Width = vg.Length(0)

// 色を決める 0は赤になります.
bar.Color = plotutil.Color(0)
生成した棒グラフを描画します.
同時に,グラフの説明を追加します.
p.Add(bar)

// 棒グラフの名前を"bar1"とします.
p.Legend.Add("bar1", bar)

// legendの位置を上側にします(デフォルトは下側)
p.Legend.Top = true

// X軸側の説明項目を追加します.
p.NominalX("one", "two", "three", "four", "five", "six", "seven", "eight", "nine")
最後に,描画した画像を保存します.
if err := p.Save(5*vg.Inch, 5*vg.Inch, "sample2.png"); err != nil {
    panic(err)
}

