Introduction
Following this good article, i have implemented KLD and JSD myself and evaluate the diff between mine and scipy one.
http://yusuke-ujitoko.hatenablog.com/entry/2017/05/07/200022
Theorem
reference:http://mathtrain.jp/logsumineq
- KL divergence
\begin{align}
&KL(P||Q)\\
&= 𝔼x∼P[logP(x)Q(x)]\\
&= 𝔼x∼P[logP(x)−logQ(x)]\\
&= ∫_xP(x)(logP(x)−logQ(x))\\
&= \sum P(x) \log \frac{P(x)}{Q(x)}
\end{align}
- JS divergence
reference:https://en.wikipedia.org/wiki/Jensen%E2%80%93Shannon_divergence
\begin{align}
&JSD(P||Q)\\
&= \frac{1}{2}KL(P||M) + \frac{1}{2}KL(Q||M)\\
& where \space M = \frac{1}{2}(P+Q)
\end{align}
# math definition of entropy => http://mathworld.wolfram.com/Entropy.html
# scipy entropy => https://github.com/scipy/scipy/blob/v1.1.0/scipy/stats/_distn_infrastructure.py#L2478-L2519
import matplotlib.pyplot as plt
import numpy as np
from scipy.stats import norm, entropy
def entropy_multi(p, q):
return np.sum(p * np.log(p / q), axis=0)
def entropy_single(p):
return np.sum(p * np.log(p), axis=0)
def KLD(pk, qk):
# arraynise
pk = np.asarray(pk)
# normalise
pk = 1.0*pk / np.sum(pk, axis=0)
# check to decide if we apply single or multi entorpy
if qk is None:
return np.sum(entropy_single(pk), axis=0)
else:
# arraynise
qk = np.asarray(qk)
if len(qk) != len(pk):
raise ValueError("qk and pk must have same length.")
qk = 1.0*qk / np.sum(qk, axis=0)
return np.sum(entropy_multi(pk, qk), axis=0)
# data prep
x = np.linspace(-10.0, 10.0, 1000)
# graph setting
plt.figure(figsize=(12,8))
# gradually shift the distribution
for i in np.arange(3):
for j in np.arange(3):
# index to shift
index = i*3 + j
# probabilistic distribution function
p = norm.pdf(x, loc=0, scale=1)
q = norm.pdf(x, loc=index*0.5, scale=1)
# mean of them
m = (p+q)/2
# scipy entropy
kl = entropy(p, q)
kl_mine = KLD(p,q)
# checker
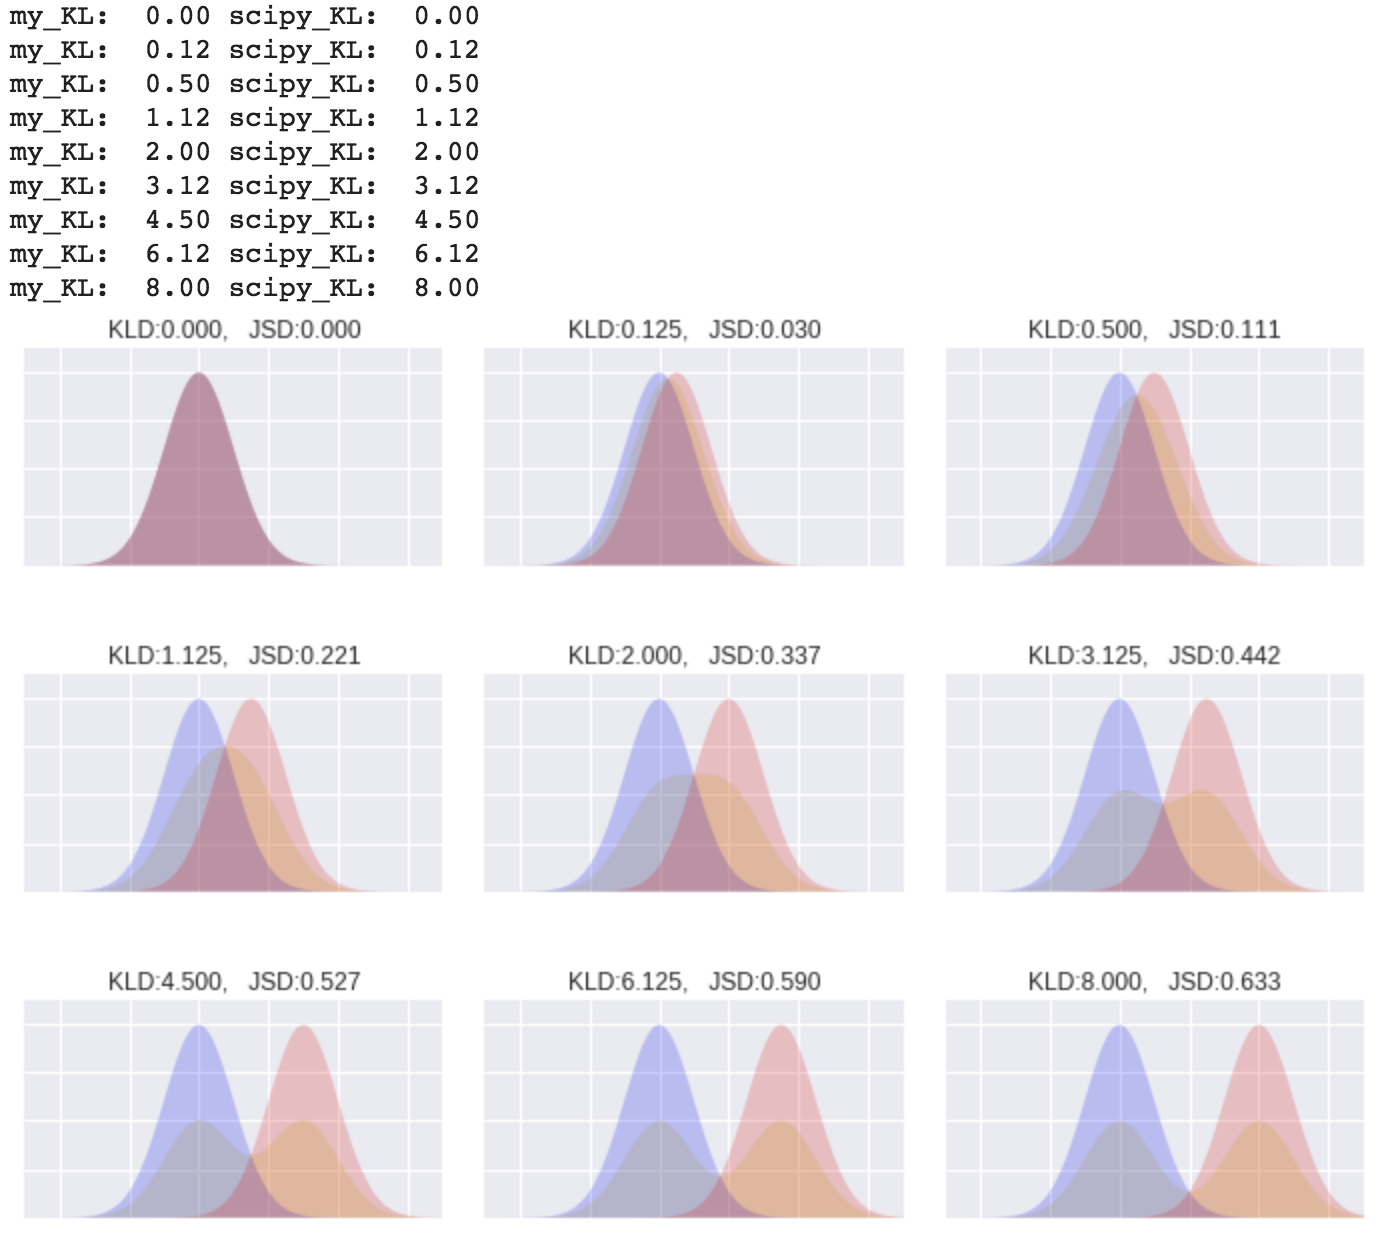
print("my_KL: ", "{0:.2f}".format(kl_mine), "scipy_KL: ", "{0:.2f}".format(kl))
# prep for js divergence
kl_pm = KLD(p, m)
kl_qm = KLD(q, m)
js = (kl_pm + kl_qm)/2
plt.subplot(3,3,i*3+j+1)
plt.fill_between(x, m, facecolor="y", alpha=0.2)
plt.fill_between(x, p, facecolor="b", alpha=0.2)
plt.fill_between(x, q, facecolor="r", alpha=0.2)
plt.xlim(-5, 7)
plt.ylim(0,0.45)
plt.title("KLD:{:>.3f}".format(kl) + ", JSD:{:>.3f}".format(js))
plt.tick_params(labelbottom="off")
plt.tick_params(labelleft="off")
plt.subplots_adjust(wspace=0.1, hspace=0.5)
plt.show()
Result