学びのメモとして、Matplotlib周辺の視覚化に活用できるコードをチートシート代わりに自分の参考用としてまとめています。
基本的なコードのまとめ
# matplotlibをpltとしてインポート
import matplotlib.pyplot as plt

# リストxを横軸、yを縦軸にした際の折れ線グラフを作成
plt.plot(x, y)

# リストxを横軸、yを縦軸、散布図を作成(プロットの大きさがsizeに比例、色をcol、透明度は0.8)
plt.scatter(x, y, s = size, c = col, alpha = 0.8))

# リストvalues内のデータをn個のビンにおけるヒストグラムを作成
plt.hist(values, bins = n)

# グラフにタイトル(TITLE)をつける
plt.title('TITLE')

# 横軸にXXX、縦軸にyyyという名前のラベルをつける
plt.xlabel('xxx')
plt.ylabel('yyy')

# 縦軸を指定 (例.0から10まで2刻み)
plt.yticks([0,2,4,6,8,10])
# 縦軸を指定 (例.0から10まで2刻みで、表記をカスタマイズ)
plt.yticks([0,2,4,6,8,10],['0','2万','4万','6万','8万','10万'])

# ある特定のプロットにテキストをつける(例. 横軸が10、縦軸が52のプロットに'text'というテキストを追加)
plt.text(10, 52, 'text')

# グリッド線を表示
plt.grid(True)

# 作成した図を描画
plt.show()

# 横軸を対数表示にする
plt.xscale('log')
実際のプロット例
# データの読み込み
with open('data.csv','r',encoding='shift_jis') as f:
    dataReader = csv.reader(f)
    list1 = [row for row in dataReader]
    district = list1[0]
    population = list1[1]
    GDP = list1[2]
    district = district[1:]
    population = population[1:]
    GDP = GDP[1:]
    population = [int(s) for s in population]
    GDP = [int(s) for s in GDP]
# グラフ描画
import matplotlib.pyplot as plt
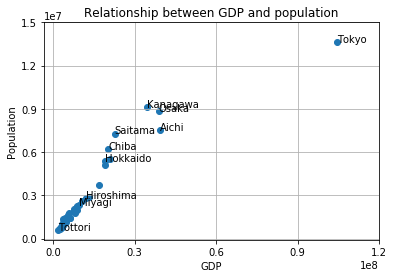
plt.scatter(GDP, population)
plt.title('Relationship between GDP and population')
plt.xlabel('GDP')
plt.ylabel('Population')
plt.xticks([0,30000000,60000000,90000000,120000000])
plt.yticks([0,3000000,6000000,9000000,12000000,15000000])
# 一部のプロットに名前付け
plt.text(104470026,13623937, 'Tokyo')
plt.text(1864072,569554, 'Tottori')
plt.text(39409405,7506900, 'Aichi')
plt.text(38994994,8832512, 'Osaka')
plt.text(11944686,2837348, 'Hiroshima')
plt.text(9475481,2330120, 'Miyagi')
plt.text(19018098,5351828, 'Hokkaido')
plt.text(34609343,9144504, 'Kanagawa')
plt.text(22689675,7289429, 'Saitama')
plt.text(20391622,6235725, 'Chiba')
plt.grid(True)
plt.show()
出展: https://www.esri.cao.go.jp/jp/sna/data/data_list/kenmin/files/contents/main_h28.html (内閣府・県民経済計算)
